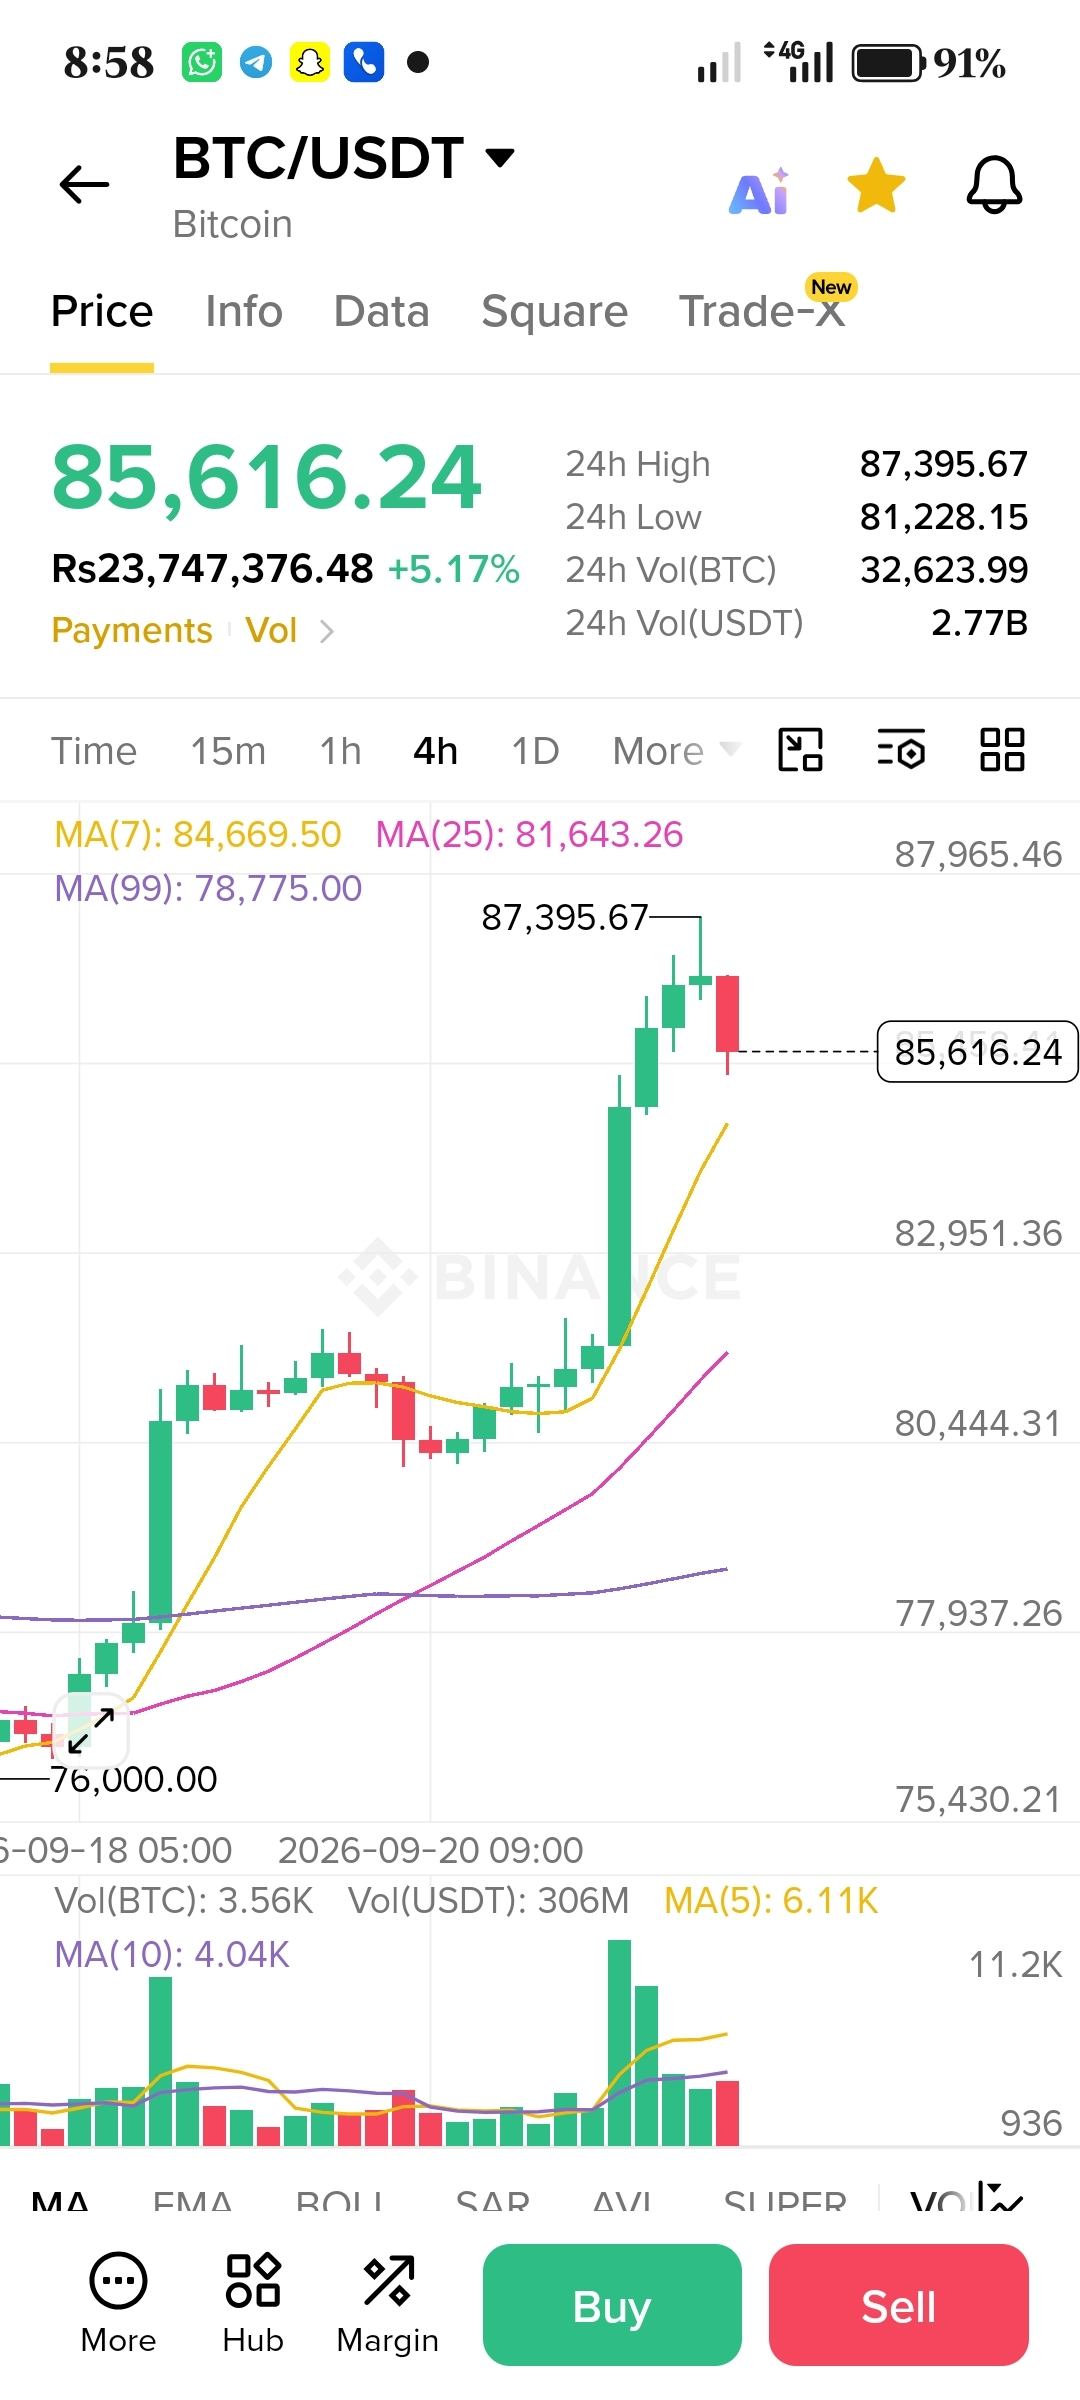

Bitcoin is showing strong bullish momentum on the 4H chart, currently trading around $85,616, after reaching a 24-hour high of $87,395.
📊 Key Technical Levels
.Current Price: $85,616
.24H High: $87,395
.24H Low: $81,228
.MA(7): $84,669
.MA(25): $81,643
.MA(99): $78,775
BTC is trading above all three moving averages shown on the chart, indicating that the short- and medium-term trend remains positive. However, the recent rejection from the $87,395 area shows that sellers are active near the current high.
🔥 Levels to Watch
Resistance: $87,400 → $88,000 → $90,000
Support: $84,600 → $81,600 → $78,800
If BTC holds above the $84,600–$85,000 area, buyers may continue testing the recent high. A decisive break above $87,400 could bring the $88K–$90K zone into focus.
On the other hand, losing the $84,600 area could lead to a deeper pullback toward the $81,600 moving-average region.
📌 Conclusion: BTC remains technically strong on the 4H chart, but traders should watch the $87.4K resistance and $84.6K support closely before taking a position.
⚠️ Not financial advice. Always DYOR and manage your risk.
#Bitcoin #BTC #BTCUSDT #Trading
#TechnicalAnalysis