📉 Market Breadth Is Weakening Again — And It's Getting Harder to Ignore
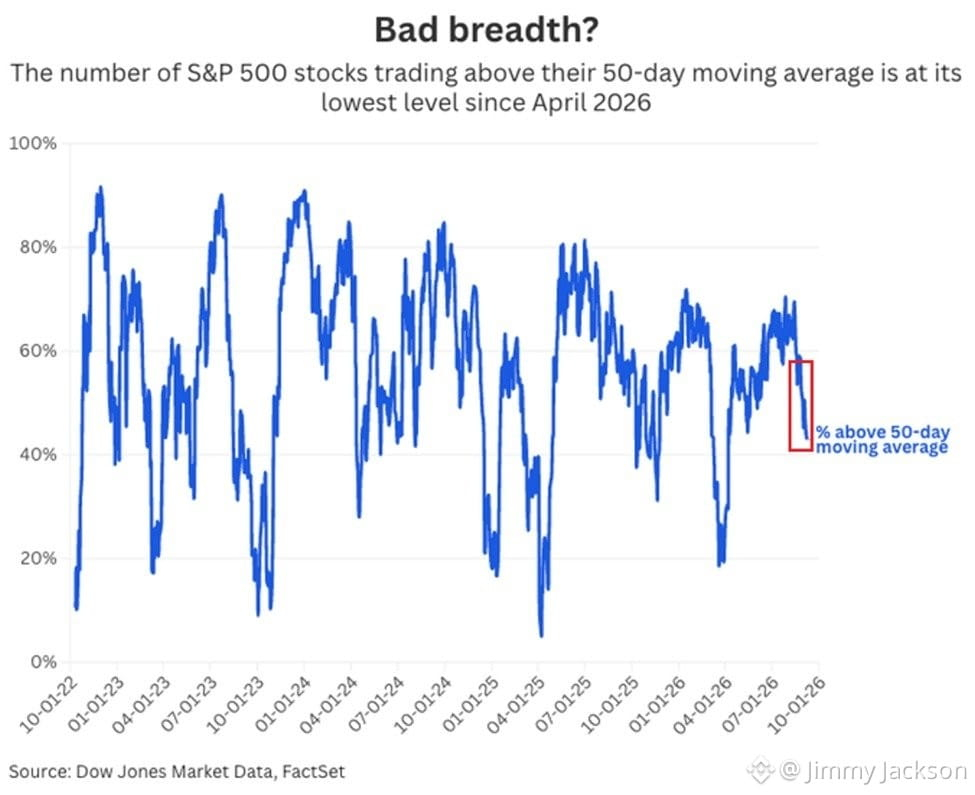
The internals of this rally are flashing warning signs once more. Only 44% of S&P 500 companies are now trading above their 50-day moving average — the thinnest reading since April. 😬
$BNB
Since mid-August alone, that number has slipped 14 percentage points. That's not a minor dip — that's a steady bleed.
The longer-term picture isn't much prettier. The share of S&P 500 stocks above their 200-day moving average has dropped 10 points to 64%, marking the lowest level since June.
Here's the part that really tells the story 👇
Over this same stretch, the equal-weighted S&P 500 has fallen 2.9%, while the cap-weighted index is down only 1.4%. That gap says everything: a shrinking group of heavyweights is doing the heavy lifting, while the average stock quietly struggles.
$BB
This is what deteriorating breadth looks like in real time — fewer names carrying the index, masking weakness underneath the surface. Historically, when participation narrows like this, it often signals a fragile rally that's more vulnerable to shocks. Not a guaranteed reversal, but a clear yellow flag. 🚩
$DCR
The market's foundation is getting thinner. Keep watching the internals — they usually speak before the headline index does.
Please don’t forget to like, follow, and share! 🩸 Thank you so much ❤️
#CircleLaunchesInstitutionalBTCBackedBorrowing #ECBStartsBlockchainEuroSettlement #SolanaCutsTargetSlotTimeTo250ms
The internals of this rally are flashing warning signs once more. Only 44% of S&P 500 companies are now trading above their 50-day moving average — the thinnest reading since April. 😬
$BNB
Since mid-August alone, that number has slipped 14 percentage points. That's not a minor dip — that's a steady bleed.
The longer-term picture isn't much prettier. The share of S&P 500 stocks above their 200-day moving average has dropped 10 points to 64%, marking the lowest level since June.
Here's the part that really tells the story 👇
Over this same stretch, the equal-weighted S&P 500 has fallen 2.9%, while the cap-weighted index is down only 1.4%. That gap says everything: a shrinking group of heavyweights is doing the heavy lifting, while the average stock quietly struggles.
$BB
This is what deteriorating breadth looks like in real time — fewer names carrying the index, masking weakness underneath the surface. Historically, when participation narrows like this, it often signals a fragile rally that's more vulnerable to shocks. Not a guaranteed reversal, but a clear yellow flag. 🚩
$DCR
The market's foundation is getting thinner. Keep watching the internals — they usually speak before the headline index does.
Please don’t forget to like, follow, and share! 🩸 Thank you so much ❤️
#CircleLaunchesInstitutionalBTCBackedBorrowing #ECBStartsBlockchainEuroSettlement #SolanaCutsTargetSlotTimeTo250ms