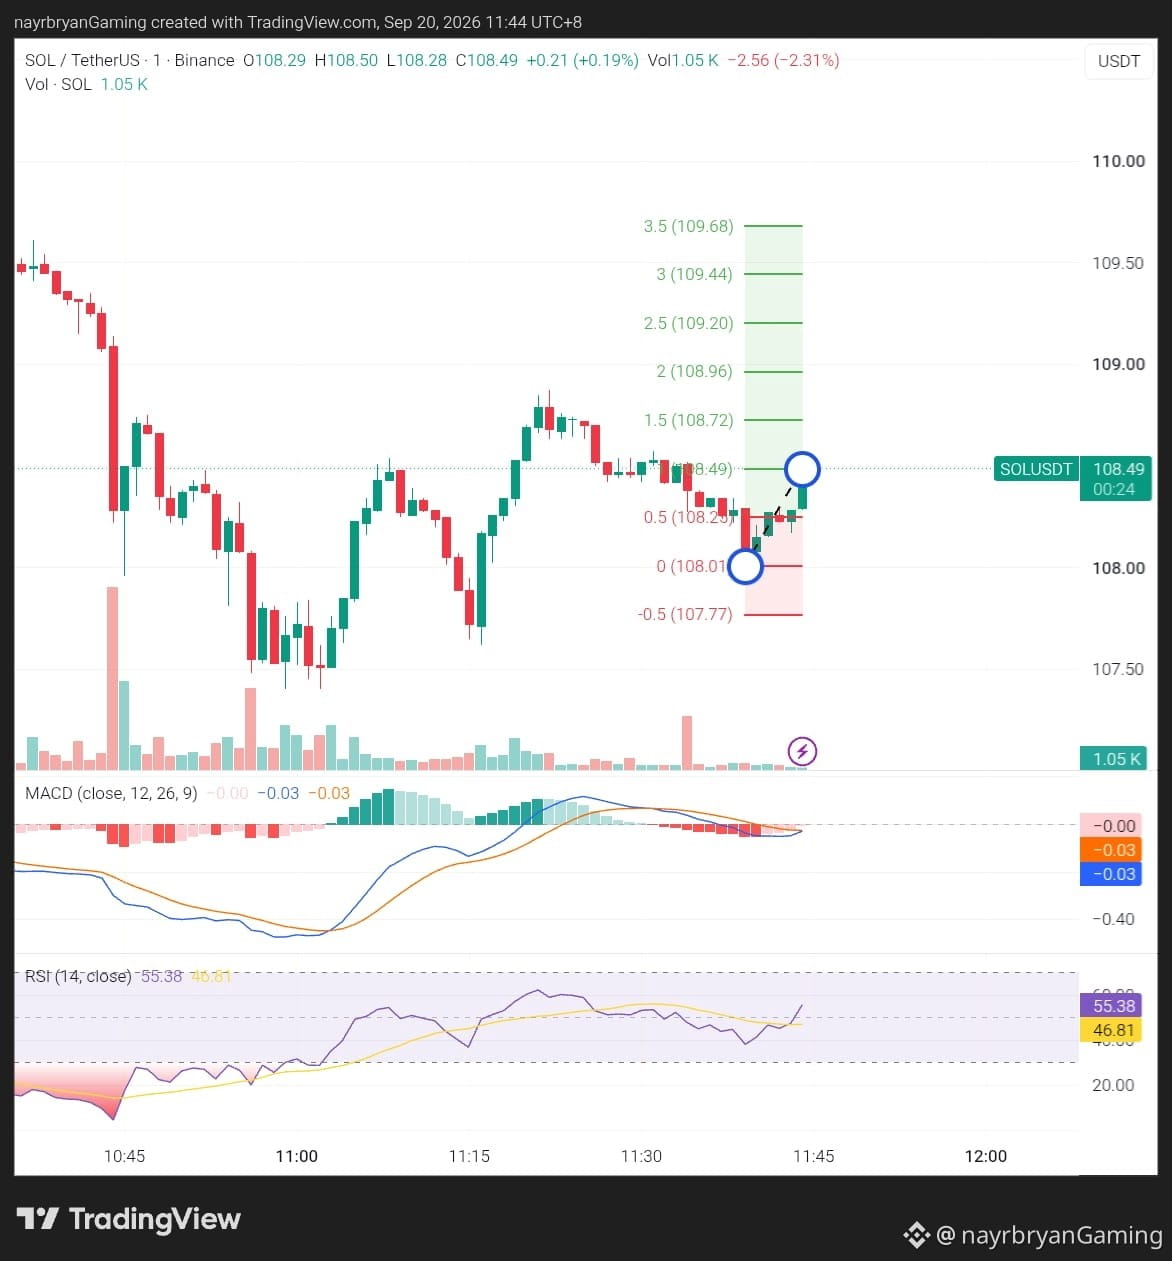
LIGHT ANALYSIS / CHART SETUP — SOL/USDT
📈 Structure Overview
Market phase: Selloff → Recovery → Structure Reclaim
Ascending structure: Higher lows along the rising trendline
Key reaction zone: 108.25 – 108.49
Major resistance: 108.72 – 108.96
Breakdown confirmation: Below 108.01
📌 What I’m Watching
Scenario A — Bullish Continuation
If SOL holds the 108.25–108.49 zone and continues above 108.49, price may rotate toward:
108.72 → 108.96 → 109.20 → 109.44 → 109.68
These levels correspond with the Fibonacci extensions marked on the chart.
Scenario B — Support Failure
If SOL loses 108.25 and then breaks 108.01, the bullish recovery structure weakens.
The next downside reference visible on the chart is:
107.77
📊 Indicator Check
MACD: Near zero → momentum recovering
RSI: 55.73 → moderate bullish momentum
Price Structure: Ascending trendline + recovery into resistance
Key Confirmation: 108.49 hold / 108.01 invalidation
Note: This is a chart framework, not a trade recommendation. Use it to support your own DYOR-based execution plan.
— @nayrbryanGaming #SOLAnalysis #ChartSetup #PriceAction #SmartMoney #Fibonacci #CryptoTrading #DYOR #NFA
📈 Structure Overview
Market phase: Selloff → Recovery → Structure Reclaim
Ascending structure: Higher lows along the rising trendline
Key reaction zone: 108.25 – 108.49
Major resistance: 108.72 – 108.96
Breakdown confirmation: Below 108.01
📌 What I’m Watching
Scenario A — Bullish Continuation
If SOL holds the 108.25–108.49 zone and continues above 108.49, price may rotate toward:
108.72 → 108.96 → 109.20 → 109.44 → 109.68
These levels correspond with the Fibonacci extensions marked on the chart.
Scenario B — Support Failure
If SOL loses 108.25 and then breaks 108.01, the bullish recovery structure weakens.
The next downside reference visible on the chart is:
107.77
📊 Indicator Check
MACD: Near zero → momentum recovering
RSI: 55.73 → moderate bullish momentum
Price Structure: Ascending trendline + recovery into resistance
Key Confirmation: 108.49 hold / 108.01 invalidation
Note: This is a chart framework, not a trade recommendation. Use it to support your own DYOR-based execution plan.
— @nayrbryanGaming #SOLAnalysis #ChartSetup #PriceAction #SmartMoney #Fibonacci #CryptoTrading #DYOR #NFA