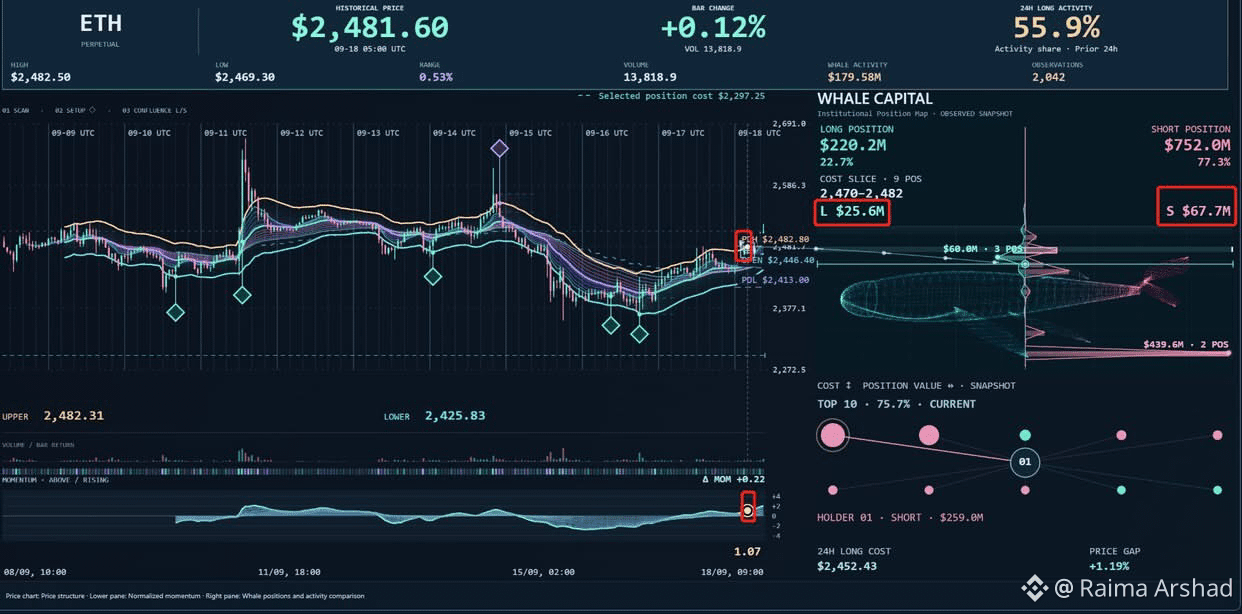
📊$ETH 4H Chart Analysis 📊
👉On the first chart, the bullish capital flow in the red-boxed candle was $25.6M.
👉On the second chart, the bullish capital flow dropped to just $9.3M, even as ETH pushed to a new high.
Price is rising, but bullish capital flow is declining.
This divergence suggests that buying momentum is weakening.
Price up + Bullish flow down = weakening buying pressure.
👀Watch the next 4H candle closely.
👉On the first chart, the bullish capital flow in the red-boxed candle was $25.6M.
👉On the second chart, the bullish capital flow dropped to just $9.3M, even as ETH pushed to a new high.
Price is rising, but bullish capital flow is declining.
This divergence suggests that buying momentum is weakening.
Price up + Bullish flow down = weakening buying pressure.
👀Watch the next 4H candle closely.