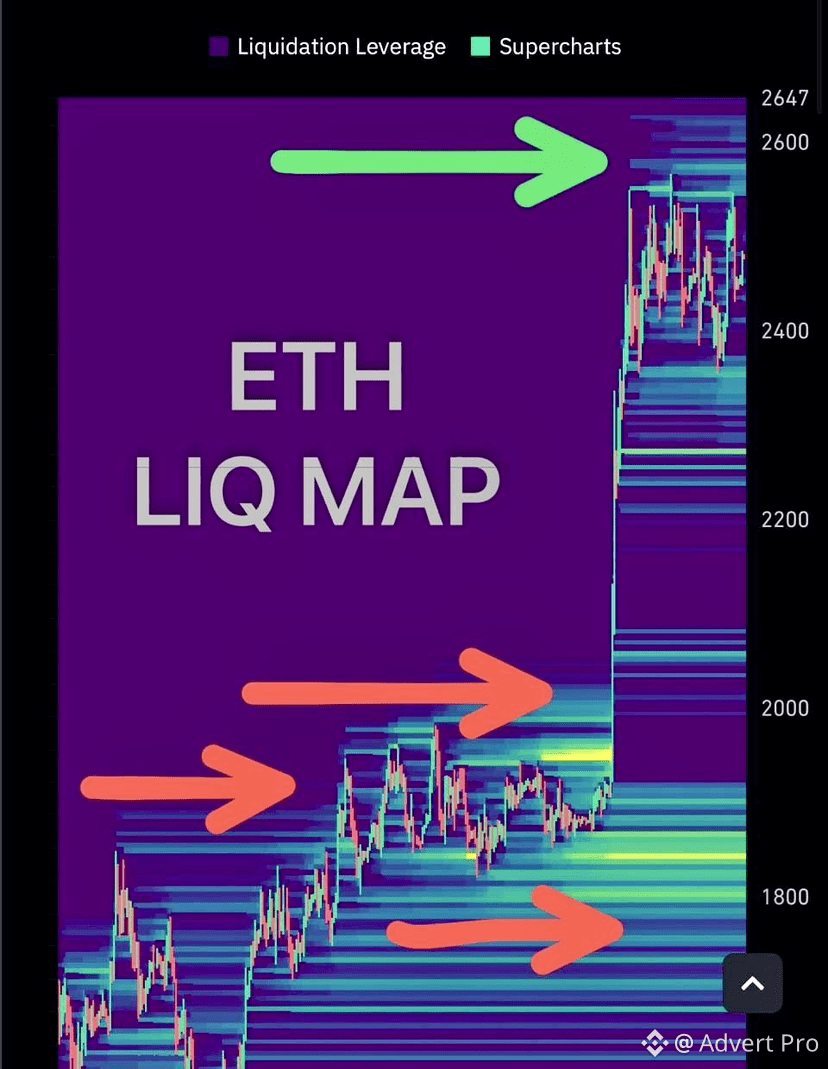
📊 RADAR: $ETH LIQUIDATION MAP 👀
🔥 THE MARKET STRUCTURE: Ethereum ($ETH ) shows a clean overhead profile with negligible short liquidation pressure above, leaving the path open for organic upward continuation!
📌 KEY LIQUIDITY ZONES & LEVELS:
• 🚀 UPSIDE (Clean Liquidity Runway):
Status: Minimal overhead short liquidation clusters.
Price Action: Free of heavy leveraged resistance, allowing spot buying momentum to push price higher without major squeeze roadblocks.
• 📉 DOWNSIDE (Major Liquidation Pocket):
Key Zone: $1,800 – $2,000
Market Risk: Dense long liquidation leverage is clustered here.
Trigger: If a sudden macro or fundamental event forces a trend reversal, this zone acts as the primary magnet for market makers to sweep liquidity.
💡 TACTICAL TRADER DIRECTIVE:
1️⃣ Trend Is Your Friend: As long as $ETH holds above major moving averages, the path of least resistance remains biased to the upside.
2️⃣ Beware the Liquidity Sweep: If price pulls back toward $2,000, watch for sharp, high-volatility liquidation wick retests followed by fast buyer absorption.
3️⃣ Risk Control: Avoid excessive leverage on long positions—set tight stop-losses above key support levels to prevent getting caught in a sudden downside liquidation cascade.
💬 COMMUNITY POLL:
Do you see $ETH continuing its upward momentum, or will macro headwinds push it down to test the $2,000 liquidation pool?
Drop your technical setups and targets below! 👇
🛡️ Disclaimer: On-chain liquidation maps show potential liquidity pools, not guaranteed price targets. Always perform your own research (DYOR) and manage risk strictly!
#Ethereum #ETH #CryptoAnalysis #BinanceSquare
🔥 THE MARKET STRUCTURE: Ethereum ($ETH ) shows a clean overhead profile with negligible short liquidation pressure above, leaving the path open for organic upward continuation!
📌 KEY LIQUIDITY ZONES & LEVELS:
• 🚀 UPSIDE (Clean Liquidity Runway):
Status: Minimal overhead short liquidation clusters.
Price Action: Free of heavy leveraged resistance, allowing spot buying momentum to push price higher without major squeeze roadblocks.
• 📉 DOWNSIDE (Major Liquidation Pocket):
Key Zone: $1,800 – $2,000
Market Risk: Dense long liquidation leverage is clustered here.
Trigger: If a sudden macro or fundamental event forces a trend reversal, this zone acts as the primary magnet for market makers to sweep liquidity.
💡 TACTICAL TRADER DIRECTIVE:
1️⃣ Trend Is Your Friend: As long as $ETH holds above major moving averages, the path of least resistance remains biased to the upside.
2️⃣ Beware the Liquidity Sweep: If price pulls back toward $2,000, watch for sharp, high-volatility liquidation wick retests followed by fast buyer absorption.
3️⃣ Risk Control: Avoid excessive leverage on long positions—set tight stop-losses above key support levels to prevent getting caught in a sudden downside liquidation cascade.
💬 COMMUNITY POLL:
Do you see $ETH continuing its upward momentum, or will macro headwinds push it down to test the $2,000 liquidation pool?
Drop your technical setups and targets below! 👇
🛡️ Disclaimer: On-chain liquidation maps show potential liquidity pools, not guaranteed price targets. Always perform your own research (DYOR) and manage risk strictly!
#Ethereum #ETH #CryptoAnalysis #BinanceSquare