$SOL is showing serious strength after the breakout 🚀🔥
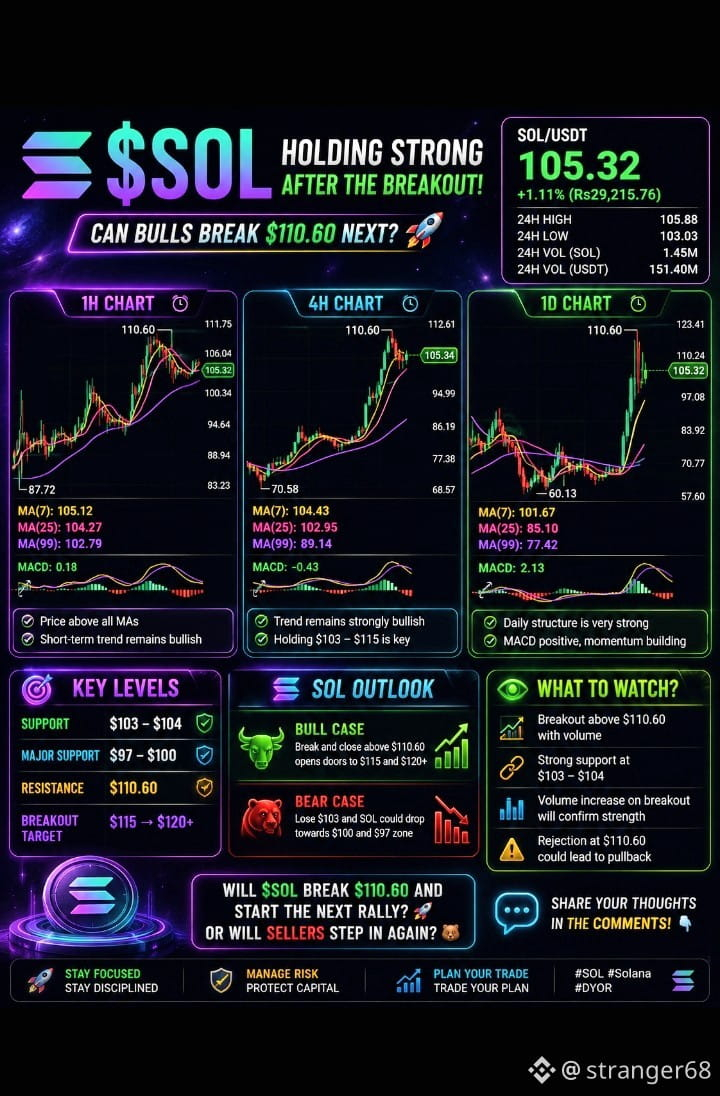
At around $105.32, Solana is consolidating just below the recent $110.60 high. The big question now: can buyers turn this pause into another leg higher? 👀
⏱️ 1H CHART • Price: $105.32 • MA(7): $105.12 • MA(25): $104.27 • MA(99): $102.79 • MACD: +0.18
Price is holding above all three moving averages — a positive short-term setup. 🟢
⏳ 4H CHART • MA(7): $104.43 • MA(25): $102.95 • MA(99): $89.14
The larger trend remains bullish after the explosive move from the $70s. Holding $103–$105 keeps the structure healthy. 💪
📅 1D CHART This is where the setup gets interesting. Price is well above the MA(25) at $85.10 and MA(99) at $77.42, while MACD remains positive. 📈
🎯 KEY LEVELS 🟢 Support: $103–$104 🟡 Major support: $97–$100 🔴 Resistance: $110.60 🚀 Breakout above $110.60 could target $115 → $120+
⚠️ If $103 breaks with strong selling pressure, a deeper pullback toward the $100/$97 area becomes possible.
🔥 The trend is bullish, but $110.60 is the wall bulls must destroy.
Will SOL break $110.60 and start the next rally, or are sellers preparing another rejection? 🚀🐻👇
#TrumpSaysUSReachedVenezuelaOilDeal #NYSilverFuturesDrop3% #SchwabPlansToAddSOLAVAXLINKTrading #USShortTermTreasuryYieldsJump
At around $105.32, Solana is consolidating just below the recent $110.60 high. The big question now: can buyers turn this pause into another leg higher? 👀
⏱️ 1H CHART • Price: $105.32 • MA(7): $105.12 • MA(25): $104.27 • MA(99): $102.79 • MACD: +0.18
Price is holding above all three moving averages — a positive short-term setup. 🟢
⏳ 4H CHART • MA(7): $104.43 • MA(25): $102.95 • MA(99): $89.14
The larger trend remains bullish after the explosive move from the $70s. Holding $103–$105 keeps the structure healthy. 💪
📅 1D CHART This is where the setup gets interesting. Price is well above the MA(25) at $85.10 and MA(99) at $77.42, while MACD remains positive. 📈
🎯 KEY LEVELS 🟢 Support: $103–$104 🟡 Major support: $97–$100 🔴 Resistance: $110.60 🚀 Breakout above $110.60 could target $115 → $120+
⚠️ If $103 breaks with strong selling pressure, a deeper pullback toward the $100/$97 area becomes possible.
🔥 The trend is bullish, but $110.60 is the wall bulls must destroy.
Will SOL break $110.60 and start the next rally, or are sellers preparing another rejection? 🚀🐻👇
#TrumpSaysUSReachedVenezuelaOilDeal #NYSilverFuturesDrop3% #SchwabPlansToAddSOLAVAXLINKTrading #USShortTermTreasuryYieldsJump