🚀 #SOL/USDT Market Update – Solana Showing Strength
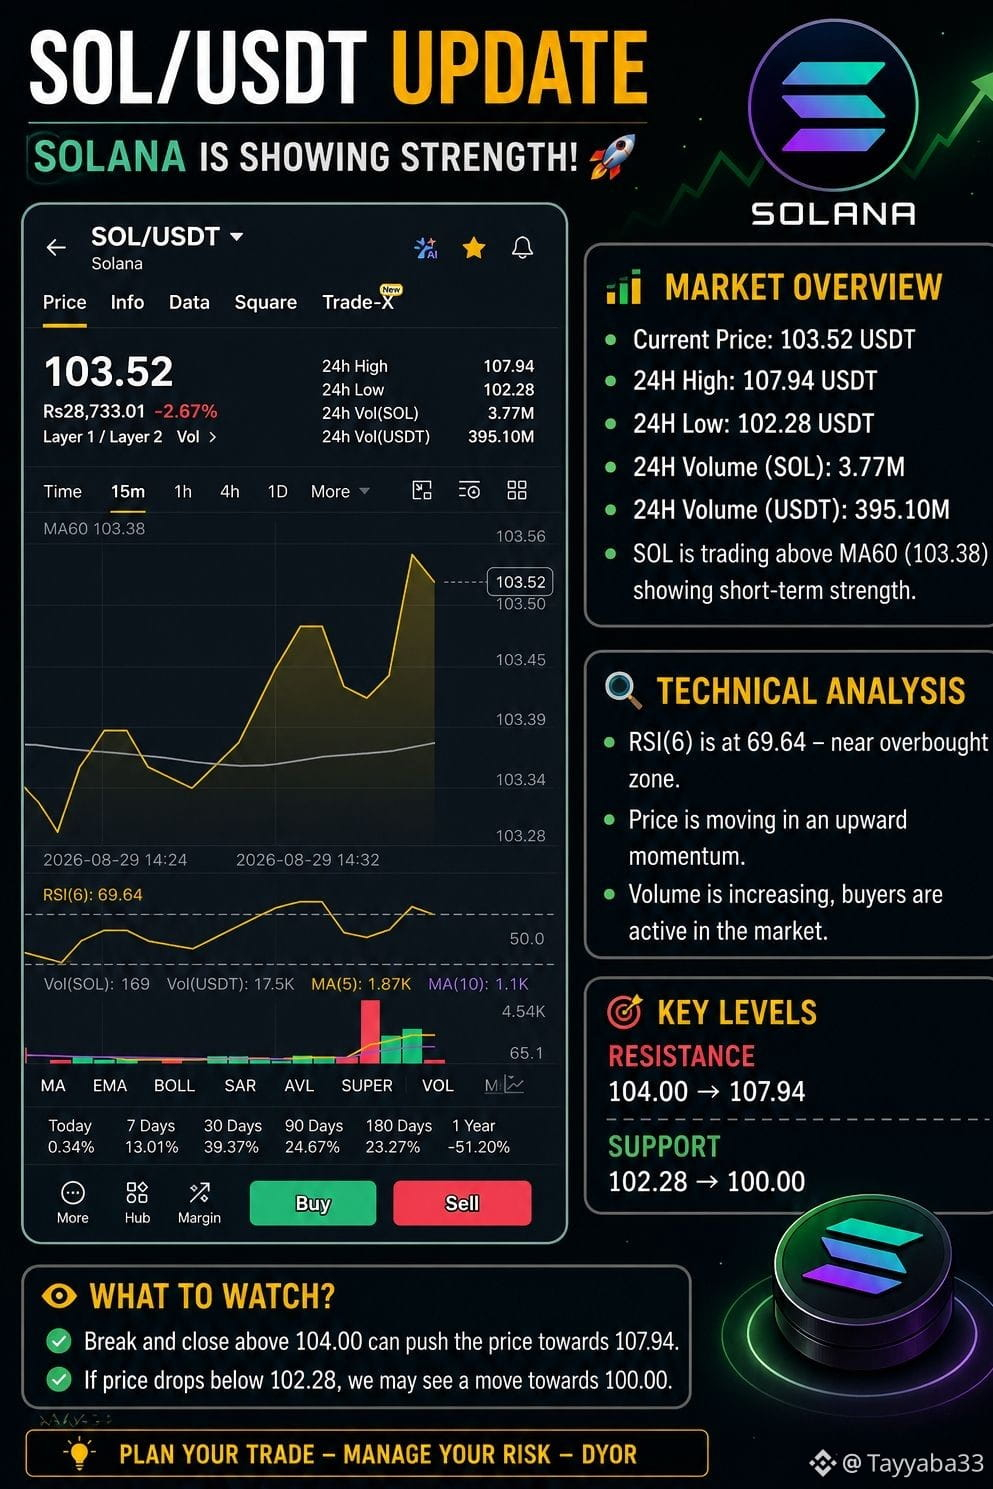
Solana (#SOL空投 ) is currently showing interesting price action in the #SolanaUSTD pair. According to the chart, SOL is trading around 103.52 USDT, while the 24-hour high is 107.94 USTD and the 24-hour low is 102.28 USDT. The market is experiencing volatility, so traders should watch the important support and resistance levels carefully.
On the 15-minute chart, #SOL is trading slightly above the MA60 at 103.38, which indicates that buyers are currently showing some strength. The price recently moved upward from the lower area and reached around 103.56 before pulling back slightly to 103.52.
One important indicator is the RSI(6), currently around 69.64. This is close to the overbought zone. It means buying pressure is relatively strong, but traders should also be careful because a short-term pullback can happen when RSI becomes too high. RSI alone should not be used as a signal to buy or sell.
📊 Key Levels to Watch
Resistance: 104.00 → 107.94
Support: 102.28 → 100.00
If SOL successfully breaks and holds above 104.00, buyers may try to push the price toward the 107.94 resistance area. However, if the price fails to break resistance and selling pressure SOL increases,could retest 102.28. A stronger drop below this level could bring the 100.00 psychological support level into focus.
Volume is another important factor. Increasing volume during an upward move can indicate stronger participation from buyers. Traders should therefore watch both price movement and volume before making a decision.
Overall, #SOL currently has short-term bullish momentum, but the high RSI means traders should avoid entering a trade purely because the price is moving up. Wait for confirmation, manage risk properly, and always use a suitable stop-loss according to your trading strategy.
This is not financial advice. Always do your own research (DYOR) before trading.
#SOL空投 #SOLANA
Solana (#SOL空投 ) is currently showing interesting price action in the #SolanaUSTD pair. According to the chart, SOL is trading around 103.52 USDT, while the 24-hour high is 107.94 USTD and the 24-hour low is 102.28 USDT. The market is experiencing volatility, so traders should watch the important support and resistance levels carefully.
On the 15-minute chart, #SOL is trading slightly above the MA60 at 103.38, which indicates that buyers are currently showing some strength. The price recently moved upward from the lower area and reached around 103.56 before pulling back slightly to 103.52.
One important indicator is the RSI(6), currently around 69.64. This is close to the overbought zone. It means buying pressure is relatively strong, but traders should also be careful because a short-term pullback can happen when RSI becomes too high. RSI alone should not be used as a signal to buy or sell.
📊 Key Levels to Watch
Resistance: 104.00 → 107.94
Support: 102.28 → 100.00
If SOL successfully breaks and holds above 104.00, buyers may try to push the price toward the 107.94 resistance area. However, if the price fails to break resistance and selling pressure SOL increases,could retest 102.28. A stronger drop below this level could bring the 100.00 psychological support level into focus.
Volume is another important factor. Increasing volume during an upward move can indicate stronger participation from buyers. Traders should therefore watch both price movement and volume before making a decision.
Overall, #SOL currently has short-term bullish momentum, but the high RSI means traders should avoid entering a trade purely because the price is moving up. Wait for confirmation, manage risk properly, and always use a suitable stop-loss according to your trading strategy.
This is not financial advice. Always do your own research (DYOR) before trading.
#SOL空投 #SOLANA