🔥 $ENA / USDT: Institutional 1H Breakout Expansion & Key Resistance Retest
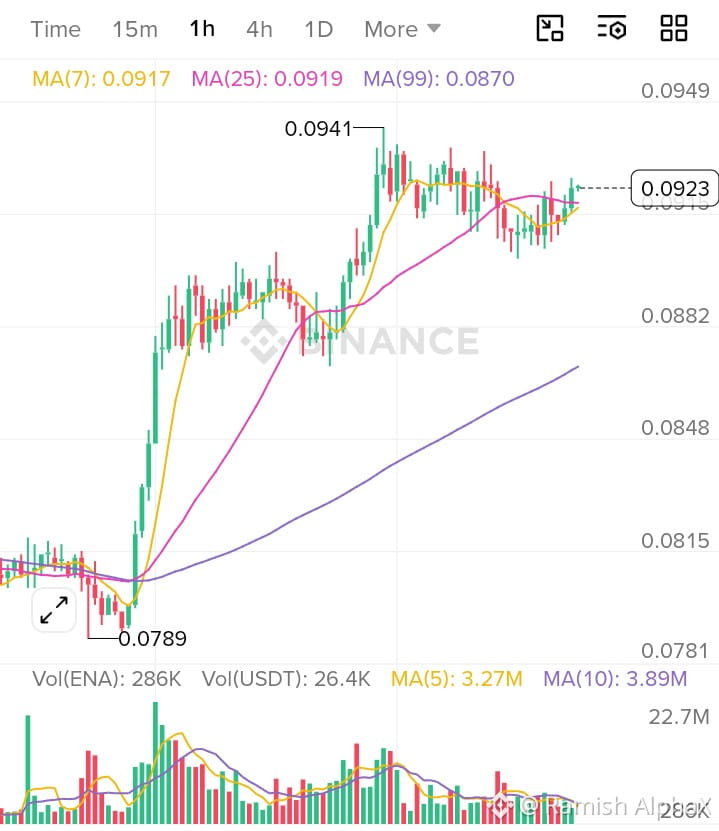
The 1-Hour (1H) chart for $ENA /USDT reveals an explosive recovery sequence from the $0.0789 structural demand floor. Institutional buying drove price into a high of $0.0941 before entering a healthy consolidation phase around $0.0923.
📊 Market Bias: Bullish (Impulsive Structural Expansion)
Trend Analysis: ENA has completed a strong shift into a bullish trend structure on the 1H timeframe. Price sits firmly above all dynamic moving average baselines—1H MA(7) ($0.0917), MA(25) ($0.0919), and MA(99) ($0.0870)—confirming buyers remain in full operational control following the initial breakout.
🎯 Trade Setup: LONG (On Retest / FVG Mitigation)
Action: LONG on a controlled pull-back into the 1H Fair Value Gap and moving average support level.
Entry Zone: $0.0905 – $0.0920 (Confluence with 1H MA(7)/MA(25) dynamic cluster and local order block)
Stop Loss (SL): $0.0865 (Below the 1H MA(99) macro structural support floor)
Take Profit 1 (TP1): $0.0941 (Immediate Swing High BSL Liquidity)
Take Profit 2 (TP2): $0.0980 (Mid-Term Resistance Level)
Take Profit 3 (TP3): $0.1040 (Macro Liquidity Target Zone)
Risk:Reward (R:R): ~1:2.6 (to TP2)
Trade Invalidation: A sustained 1H candle close below $0.0865 invalidates the immediate bullish continuation structure.
#ENA #ENAUSDT🚨 #ENALaunch #ENA智能策略库🥇🥇 #ENAAnalysis
The 1-Hour (1H) chart for $ENA /USDT reveals an explosive recovery sequence from the $0.0789 structural demand floor. Institutional buying drove price into a high of $0.0941 before entering a healthy consolidation phase around $0.0923.
📊 Market Bias: Bullish (Impulsive Structural Expansion)
Trend Analysis: ENA has completed a strong shift into a bullish trend structure on the 1H timeframe. Price sits firmly above all dynamic moving average baselines—1H MA(7) ($0.0917), MA(25) ($0.0919), and MA(99) ($0.0870)—confirming buyers remain in full operational control following the initial breakout.
🎯 Trade Setup: LONG (On Retest / FVG Mitigation)
Action: LONG on a controlled pull-back into the 1H Fair Value Gap and moving average support level.
Entry Zone: $0.0905 – $0.0920 (Confluence with 1H MA(7)/MA(25) dynamic cluster and local order block)
Stop Loss (SL): $0.0865 (Below the 1H MA(99) macro structural support floor)
Take Profit 1 (TP1): $0.0941 (Immediate Swing High BSL Liquidity)
Take Profit 2 (TP2): $0.0980 (Mid-Term Resistance Level)
Take Profit 3 (TP3): $0.1040 (Macro Liquidity Target Zone)
Risk:Reward (R:R): ~1:2.6 (to TP2)
Trade Invalidation: A sustained 1H candle close below $0.0865 invalidates the immediate bullish continuation structure.
#ENA #ENAUSDT🚨 #ENALaunch #ENA智能策略库🥇🥇 #ENAAnalysis