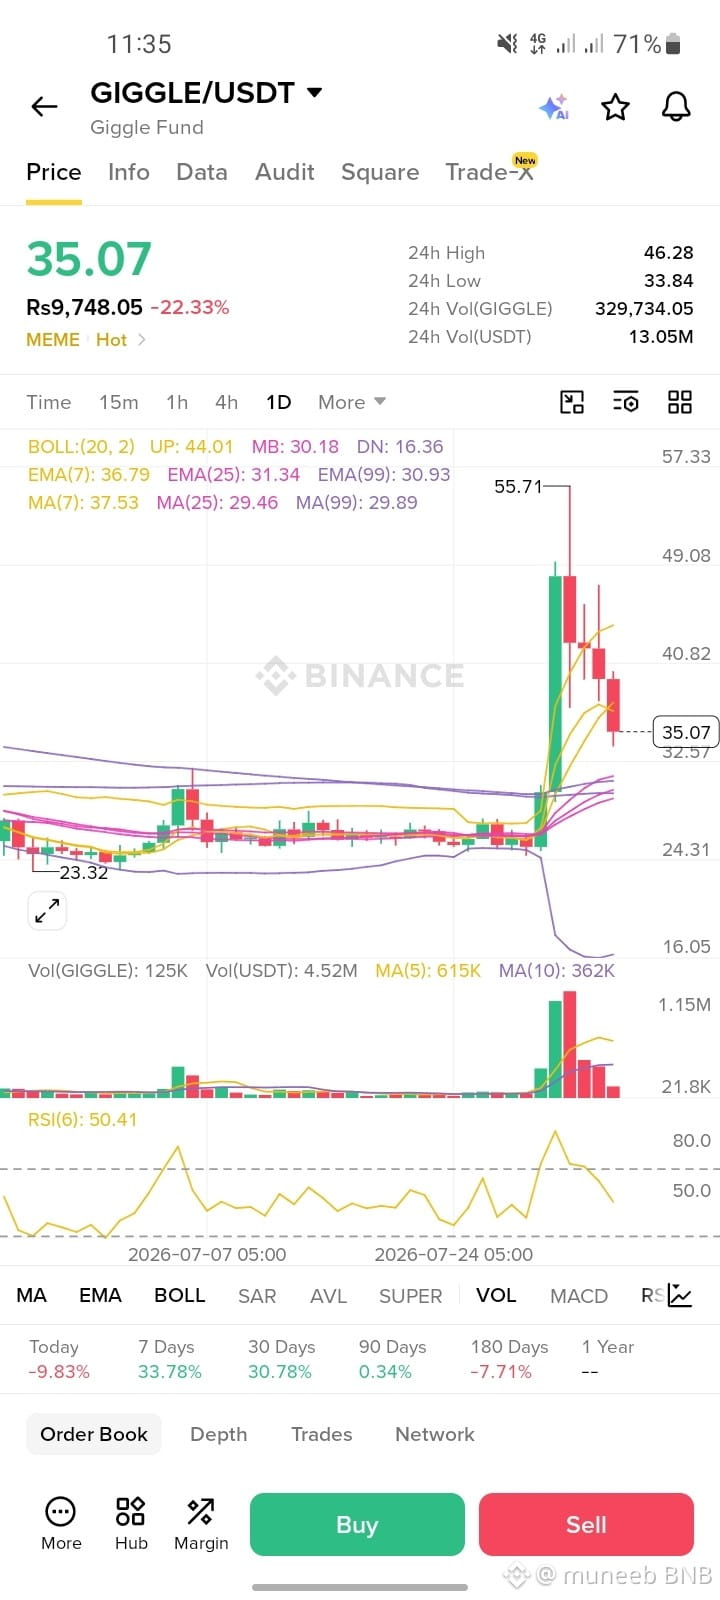
📊 Technical Chart Breakdown
Trend Overview: After a prolonged consolidation around $24–$25, GIGGLE surged rapidly to hit a local peak of $55.71. It is currently in a heavy retracement (-22.33% down to $35.07).
Moving Averages & Support:
Immediate Support: $30.00 – $31.50 (Cluster zone: EMA 25 at $31.34, EMA 99 at $30.93, and Middle Bollinger Band at $30.18).
Major Base Support: $24.00 – $25.00 (Previous multi-week accumulation zone).
Indicators:
RSI (6): Neutralized down to 50.41 from heavily overbought levels (>80), indicating momentum is resetting.
Bollinger Bands: Price is pulling back from the Upper Band ($44.01) toward the Middle Band ($30.18).
🎯 Realistic Price Predictions
Short-Term (1–7 Days)
Bearish / Pullback Scenario: Price is testing the EMA 7 ($36.79). If rejection continues, expect a retest of the strong support zone at $30.00 – $31.50.
Bullish Relief Scenario: If $30 holds as support, a quick bounce back to test immediate resistance at $40.00 – $44.00 is likely.
Mid-Term (2–4 Weeks)
Consolidation / Range: Expect trading within $30.00 to $45.00 as the market digests the recent massive surge.
Breakout Target: A clean breakout and daily close above $46.30 opens the path to retest $55.70 and potentially push toward $62.00.
$GIGGLE
#USIranDealOrNoDeal #KoreaMarginHikeCutsLeveragedETFTrading #MastercardCompletesBVNKStablecoinAcquisition #PalantirJumps10%OnQ2Beat #AmazonJumps15%OnAWS37%Growth
Trend Overview: After a prolonged consolidation around $24–$25, GIGGLE surged rapidly to hit a local peak of $55.71. It is currently in a heavy retracement (-22.33% down to $35.07).
Moving Averages & Support:
Immediate Support: $30.00 – $31.50 (Cluster zone: EMA 25 at $31.34, EMA 99 at $30.93, and Middle Bollinger Band at $30.18).
Major Base Support: $24.00 – $25.00 (Previous multi-week accumulation zone).
Indicators:
RSI (6): Neutralized down to 50.41 from heavily overbought levels (>80), indicating momentum is resetting.
Bollinger Bands: Price is pulling back from the Upper Band ($44.01) toward the Middle Band ($30.18).
🎯 Realistic Price Predictions
Short-Term (1–7 Days)
Bearish / Pullback Scenario: Price is testing the EMA 7 ($36.79). If rejection continues, expect a retest of the strong support zone at $30.00 – $31.50.
Bullish Relief Scenario: If $30 holds as support, a quick bounce back to test immediate resistance at $40.00 – $44.00 is likely.
Mid-Term (2–4 Weeks)
Consolidation / Range: Expect trading within $30.00 to $45.00 as the market digests the recent massive surge.
Breakout Target: A clean breakout and daily close above $46.30 opens the path to retest $55.70 and potentially push toward $62.00.
$GIGGLE
#USIranDealOrNoDeal #KoreaMarginHikeCutsLeveragedETFTrading #MastercardCompletesBVNKStablecoinAcquisition #PalantirJumps10%OnQ2Beat #AmazonJumps15%OnAWS37%Growth