$HOME
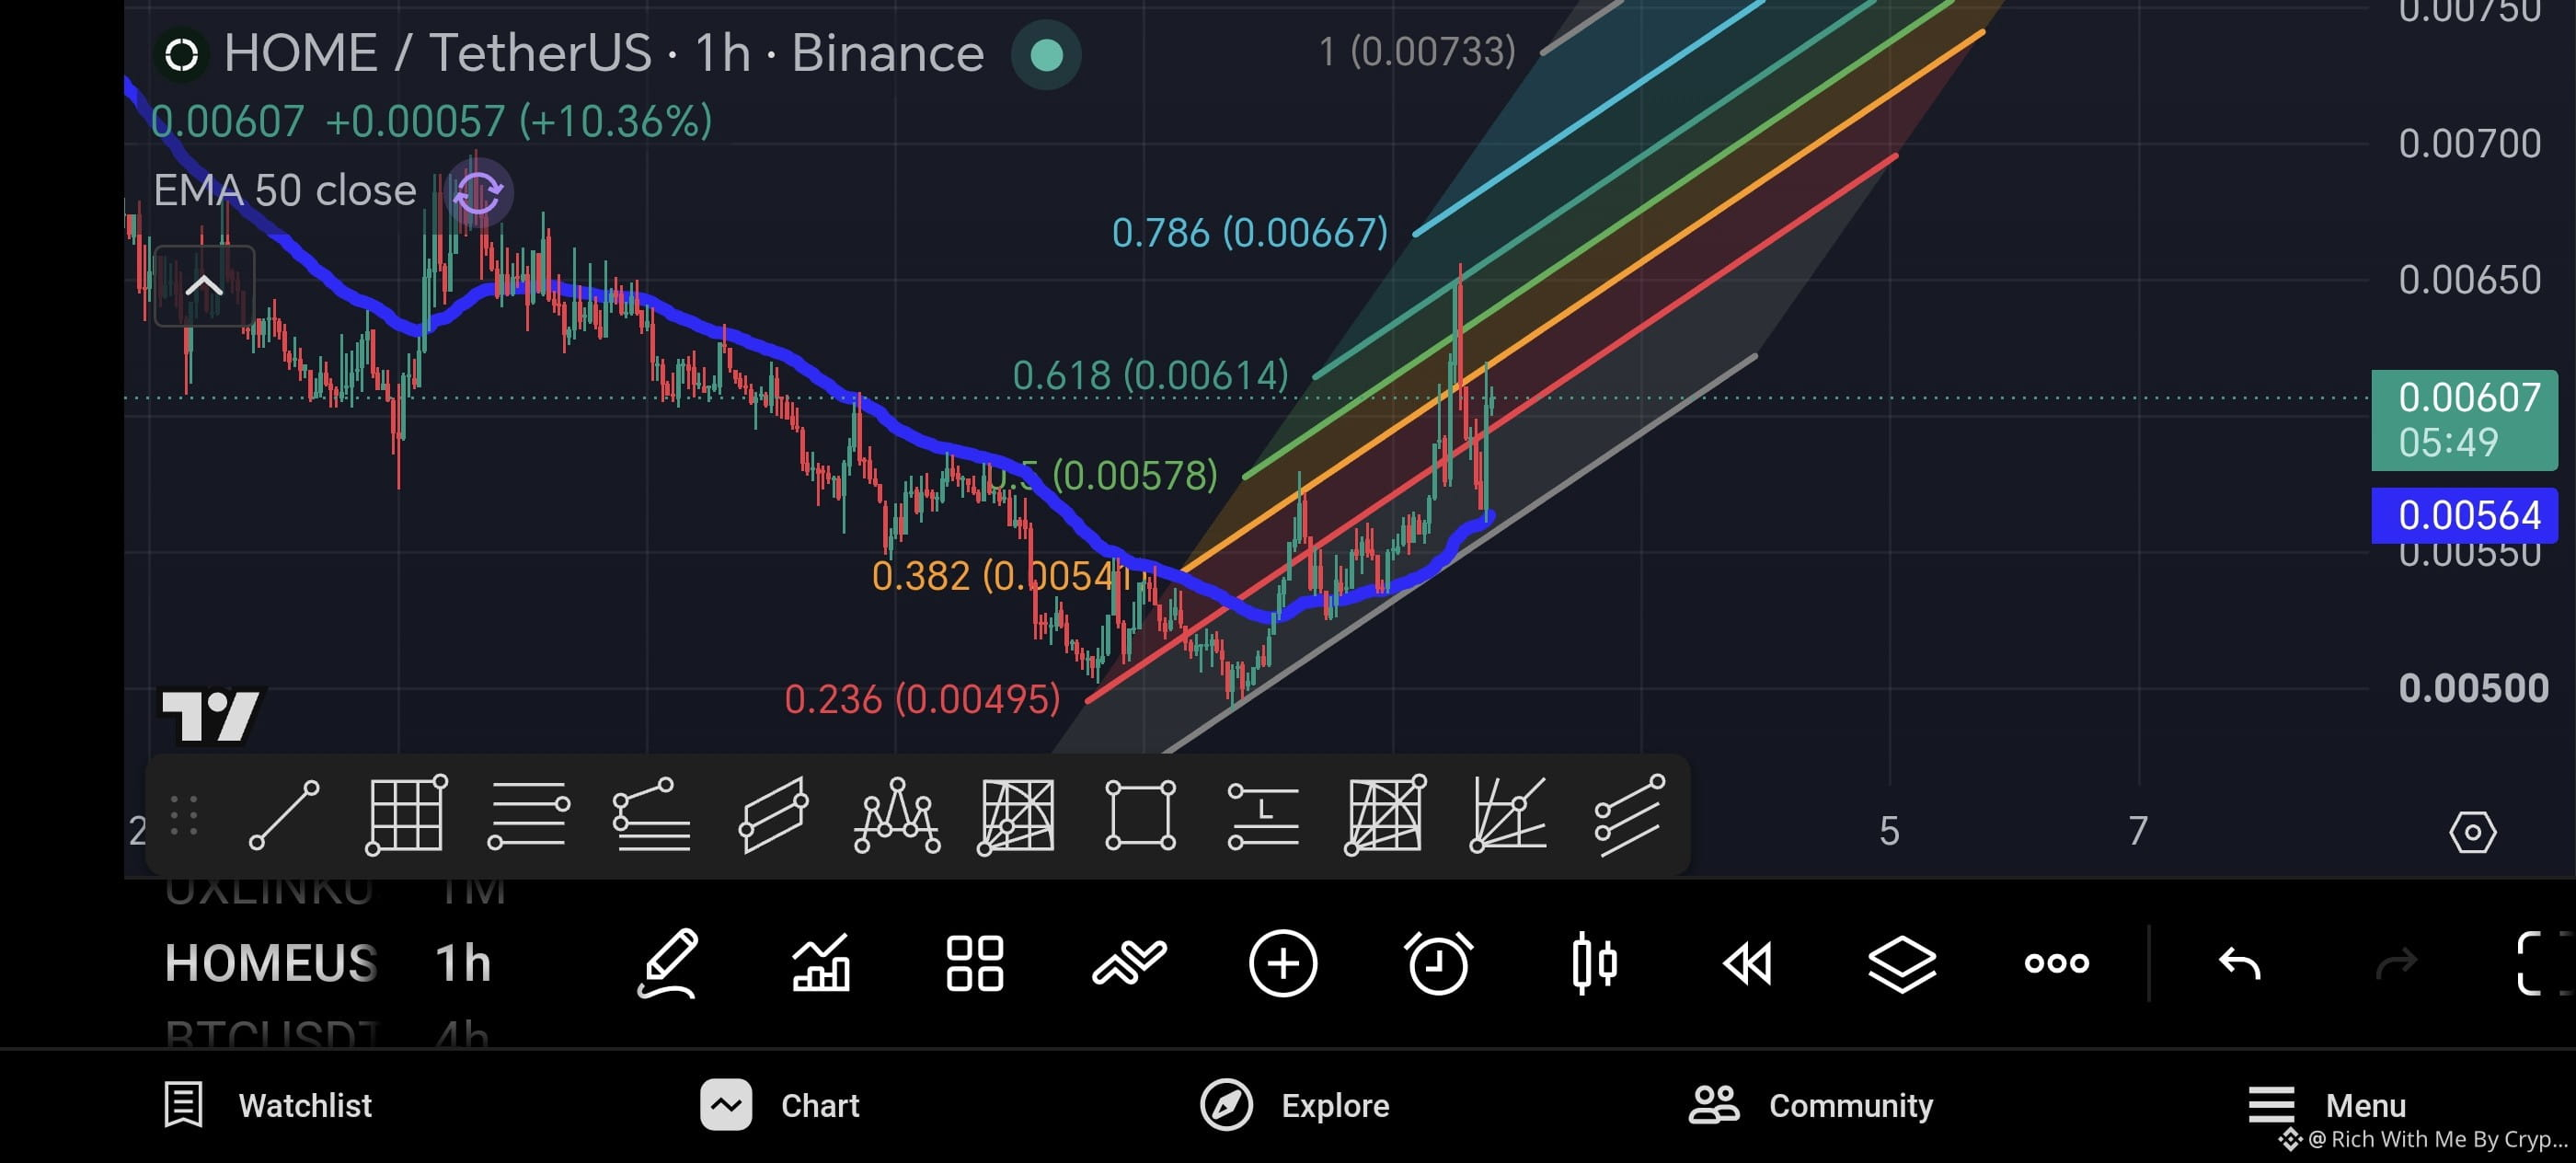
From your HOME/USDT (1H) chart:
Current structure: Bullish
Price is trading above the EMA 50, which is a positive sign.
The price is moving inside an ascending channel, indicating buyers are still in control.
There was a strong rejection near 0.00650–0.00667 (around the 0.786 Fibonacci level), followed by a pullback. This suggests sellers are active at that resistance.
Key levels
Support: 0.00580 → 0.00564 (EMA 50) → 0.00540
Resistance: 0.00614 → 0.00650–0.00667
Possible scenarios
✅ If the price holds above 0.00580 and the EMA 50, another attempt toward 0.00650–0.00670 is likely.
🚀 A strong breakout above 0.00667 with good volume could open the way toward 0.00700–0.00730.
⚠️ If 0.00564 is lost, the price may fall back toward 0.00540 or even 0.00500. Recent broader technical summaries for HOME are mixed to bearish on higher timeframes, so it's worth waiting for confirmation before expecting a sustained rally.
Trading idea
Conservative: Wait for a confirmed breakout above 0.00667 with strong volume before entering.
Aggressive: Consider entries only near the 0.00570–0.00580 support area with a tight stop-loss below 0.00560.
If you want, I can also give you a long entry, stop-loss, and take-profit (TP1/TP2/TP3) setup based on this chart.
From your HOME/USDT (1H) chart:
Current structure: Bullish
Price is trading above the EMA 50, which is a positive sign.
The price is moving inside an ascending channel, indicating buyers are still in control.
There was a strong rejection near 0.00650–0.00667 (around the 0.786 Fibonacci level), followed by a pullback. This suggests sellers are active at that resistance.
Key levels
Support: 0.00580 → 0.00564 (EMA 50) → 0.00540
Resistance: 0.00614 → 0.00650–0.00667
Possible scenarios
✅ If the price holds above 0.00580 and the EMA 50, another attempt toward 0.00650–0.00670 is likely.
🚀 A strong breakout above 0.00667 with good volume could open the way toward 0.00700–0.00730.
⚠️ If 0.00564 is lost, the price may fall back toward 0.00540 or even 0.00500. Recent broader technical summaries for HOME are mixed to bearish on higher timeframes, so it's worth waiting for confirmation before expecting a sustained rally.
Trading idea
Conservative: Wait for a confirmed breakout above 0.00667 with strong volume before entering.
Aggressive: Consider entries only near the 0.00570–0.00580 support area with a tight stop-loss below 0.00560.
If you want, I can also give you a long entry, stop-loss, and take-profit (TP1/TP2/TP3) setup based on this chart.