$HBAR /BTC SHOWING SIGNS OF RECOVERY 🚀
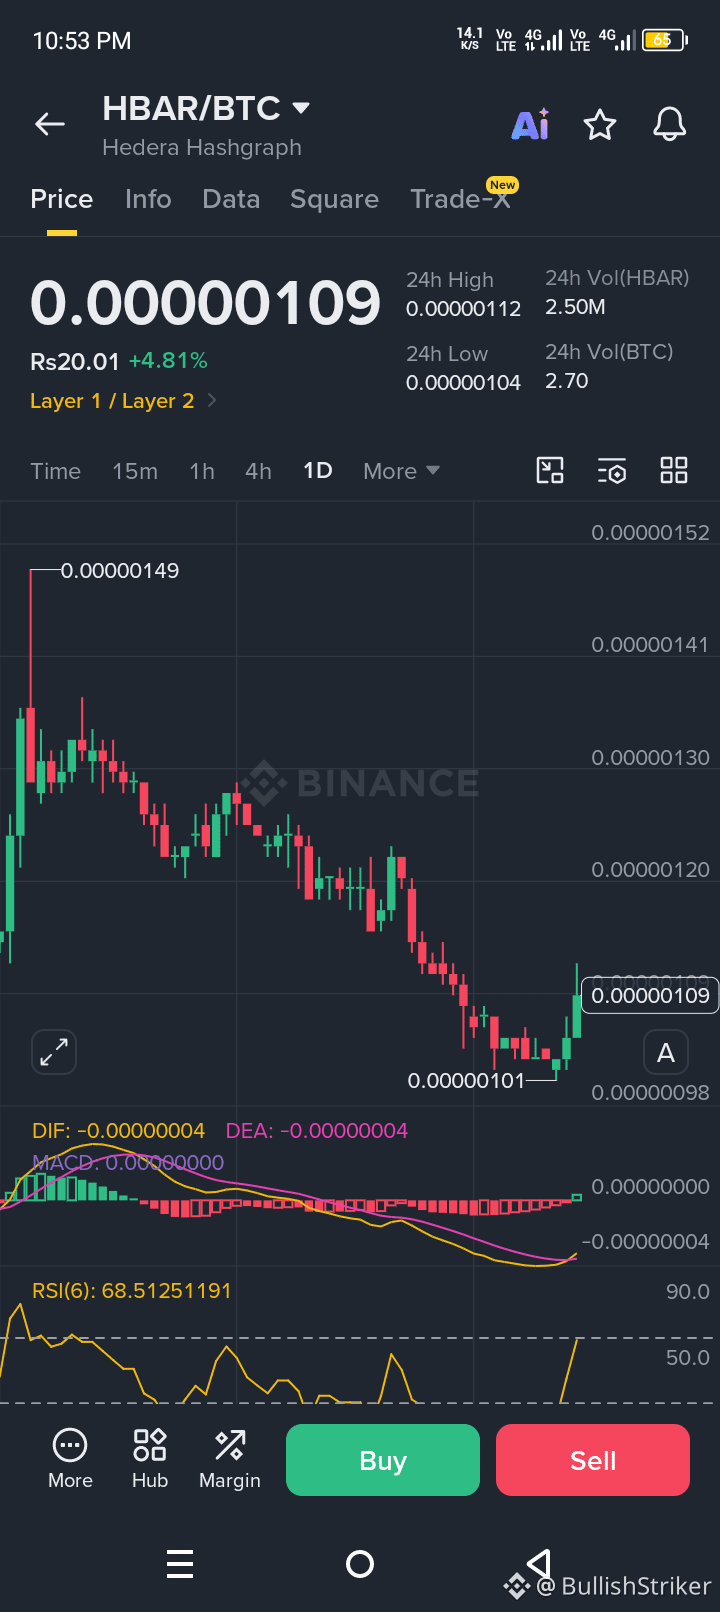
After an extended downtrend, $HBAR /BTC is beginning to show early bullish momentum, with buyers stepping in near the recent lows. The latest price action suggests that bearish pressure is easing while market sentiment gradually improves.
📊 Market Snapshot
• Pair: HBAR/BTC
• Price: 0.00000109 BTC
• 24H Change: +4.81% 🟢
• 24H High: 0.00000112
• 24H Low: 0.00000104
• 24H Volume: 2.50M HBAR
📈 Bullish Technical Outlook
✅ Price bounced strongly from the 0.00000101 support zone.
✅ MACD histogram is turning positive, indicating momentum is improving.
✅ RSI has recovered toward the bullish zone, reflecting renewed buying interest.
✅ Green candles after a prolonged decline often signal an early trend reversal attempt.
🧭 Key Price Zones
Resistance:
0.00000112 → 0.00000120 → 0.00000130
Support:
0.00000104 → 0.00000101
🔥 Market Context
✔ Buyers are defending key support.
✔ Selling pressure appears to be weakening.
✔ Momentum indicators are improving.
✔ Layer-1 projects continue to attract attention during broader market rotations.
While confirmation of a sustained uptrend still depends on future price action, the current chart structure is more constructive than it was during the recent decline.
📌 Disclaimer: This post is for market information only and is not financial or trading advice.
Community Question:
Can HBAR/BTC build enough momentum to reclaim higher resistance levels, or will sellers return near the recent highs? 👇
$HBAR
After an extended downtrend, $HBAR /BTC is beginning to show early bullish momentum, with buyers stepping in near the recent lows. The latest price action suggests that bearish pressure is easing while market sentiment gradually improves.
📊 Market Snapshot
• Pair: HBAR/BTC
• Price: 0.00000109 BTC
• 24H Change: +4.81% 🟢
• 24H High: 0.00000112
• 24H Low: 0.00000104
• 24H Volume: 2.50M HBAR
📈 Bullish Technical Outlook
✅ Price bounced strongly from the 0.00000101 support zone.
✅ MACD histogram is turning positive, indicating momentum is improving.
✅ RSI has recovered toward the bullish zone, reflecting renewed buying interest.
✅ Green candles after a prolonged decline often signal an early trend reversal attempt.
🧭 Key Price Zones
Resistance:
0.00000112 → 0.00000120 → 0.00000130
Support:
0.00000104 → 0.00000101
🔥 Market Context
✔ Buyers are defending key support.
✔ Selling pressure appears to be weakening.
✔ Momentum indicators are improving.
✔ Layer-1 projects continue to attract attention during broader market rotations.
While confirmation of a sustained uptrend still depends on future price action, the current chart structure is more constructive than it was during the recent decline.
📌 Disclaimer: This post is for market information only and is not financial or trading advice.
Community Question:
Can HBAR/BTC build enough momentum to reclaim higher resistance levels, or will sellers return near the recent highs? 👇
$HBAR