
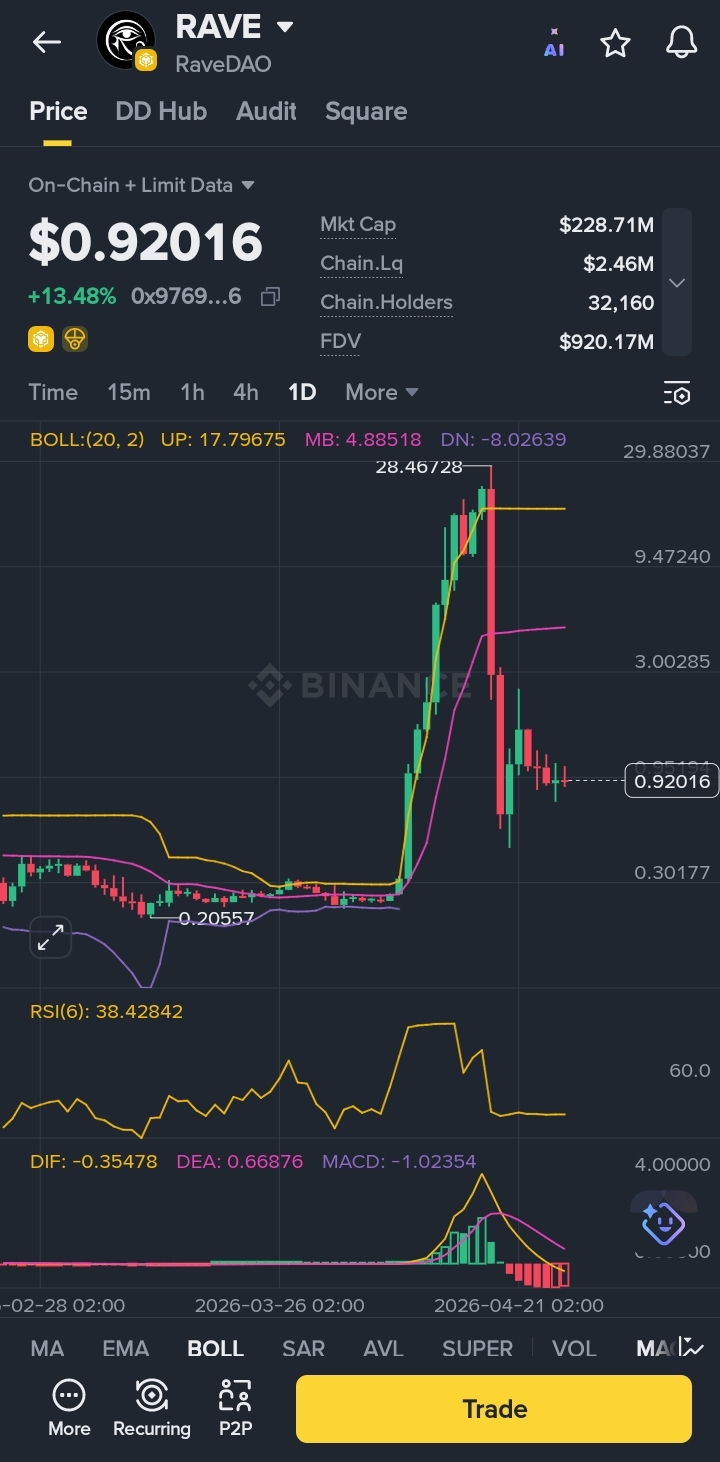
The recent price action of RAVE Token looks like a classic parabolic pump followed by a sharp correction — a pattern traders know well, but many still underestimate.
🚀 Phase 1: The Vertical Pump
Price surged aggressively from below $0.30 to nearly $28+
This kind of move is driven by:
FOMO (fear of missing out)
Low liquidity + hype
Momentum traders jumping in late
👉 In simple terms: the market went into “rocket mode” without building a solid base.
🔻 Phase 2: The Harsh Reality (Dump)
A massive red candle wiped out most gains
Price collapsed back under $1
This is typical of:
Early investors taking profit
(low liquidity)
Exhaustion of buyers
💡 When a move goes up too fast… it usually comes down even faster.
📉 Indicators Breakdown
🔸 Bollinger Bands
Price exploded above the upper band → extreme overbought
Now compressing → volatility cooling down
🔸 RSI (38)
Below 50 → weak momentum
Not oversold yet → still room to drop or range
🔸 MACD
Bearish crossover confirmed
Histogram turning red → downtrend pressure still active
🧠 Current Market Structure
Right now, the chart is in a post-pump consolidation phase:
Support zone: around $0.70 – $0.90
Resistance zone: around $1.5 – $3
Price is moving sideways… but under bearish pressure.
🎯 What To Do Next?
🟡 Scenario 1: Short-Term Traders
Wait for:
Break above resistance with volume → possible quick trade
Or drop to strong support → bounce play
👉 No confirmation = No trade
🔵 Scenario 2: Safer Approach
Let the chart “cool down”
Watch if price builds a new base (accumulation zone)
👉 Smart money doesn’t chase… it waits.
🔴 Scenario 3: Risk Warning
This looks like a classic pump & dump structure
If volume keeps fading → price may slowly bleed down
🧩 Final Thought
This chart isn’t whispering… it’s shouting:
“The hype phase is over. Now comes the decision phase.”
The next move depends on one thing: 👉 Will buyers return with strength… or was that the peak?