Here's the breakdown across short-term and swing views:
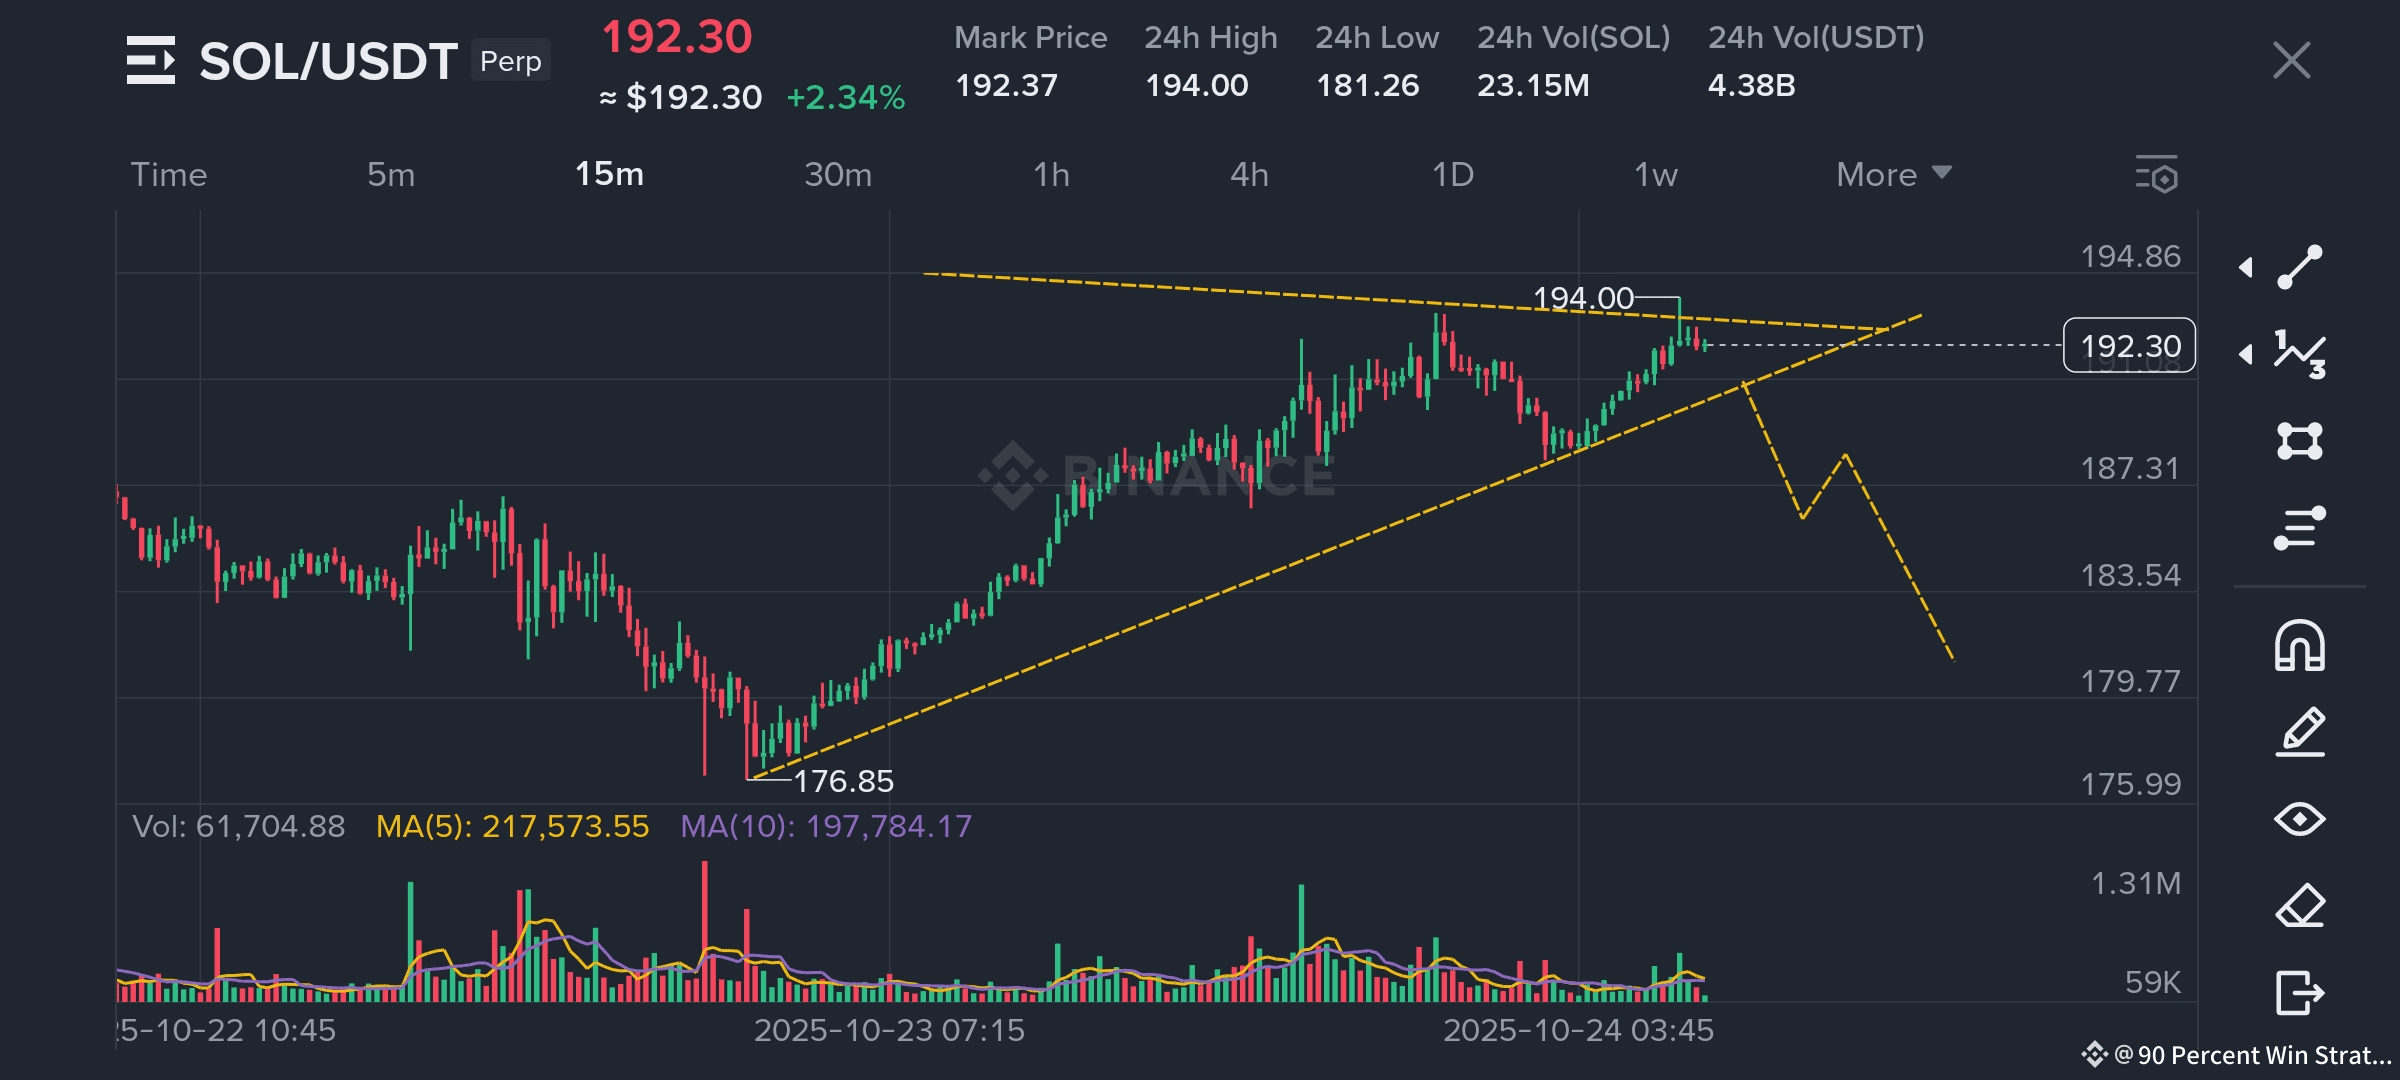
Chart 1: Short-Term View (Binance Pullback)
The momentum is shifting—watch for the dip!
Price Action: After pumping to $190, sellers strongly defended the $192-$195 zone, leading to a new lower high above $190. A strong trendline break attempt failed.
Momentum Signal (MACD): The MACD histogram has flipped red, and the lines are on the verge of crossing—a clear signal of bearish momentum shift.
Trade Strategy (Short):
📍 Optimal Add Zone: $193.00 - $193.50 (Wait for rejection/confirmation here)
🎯 Target: Below $182.00
🛑 Stop: Above $203.00
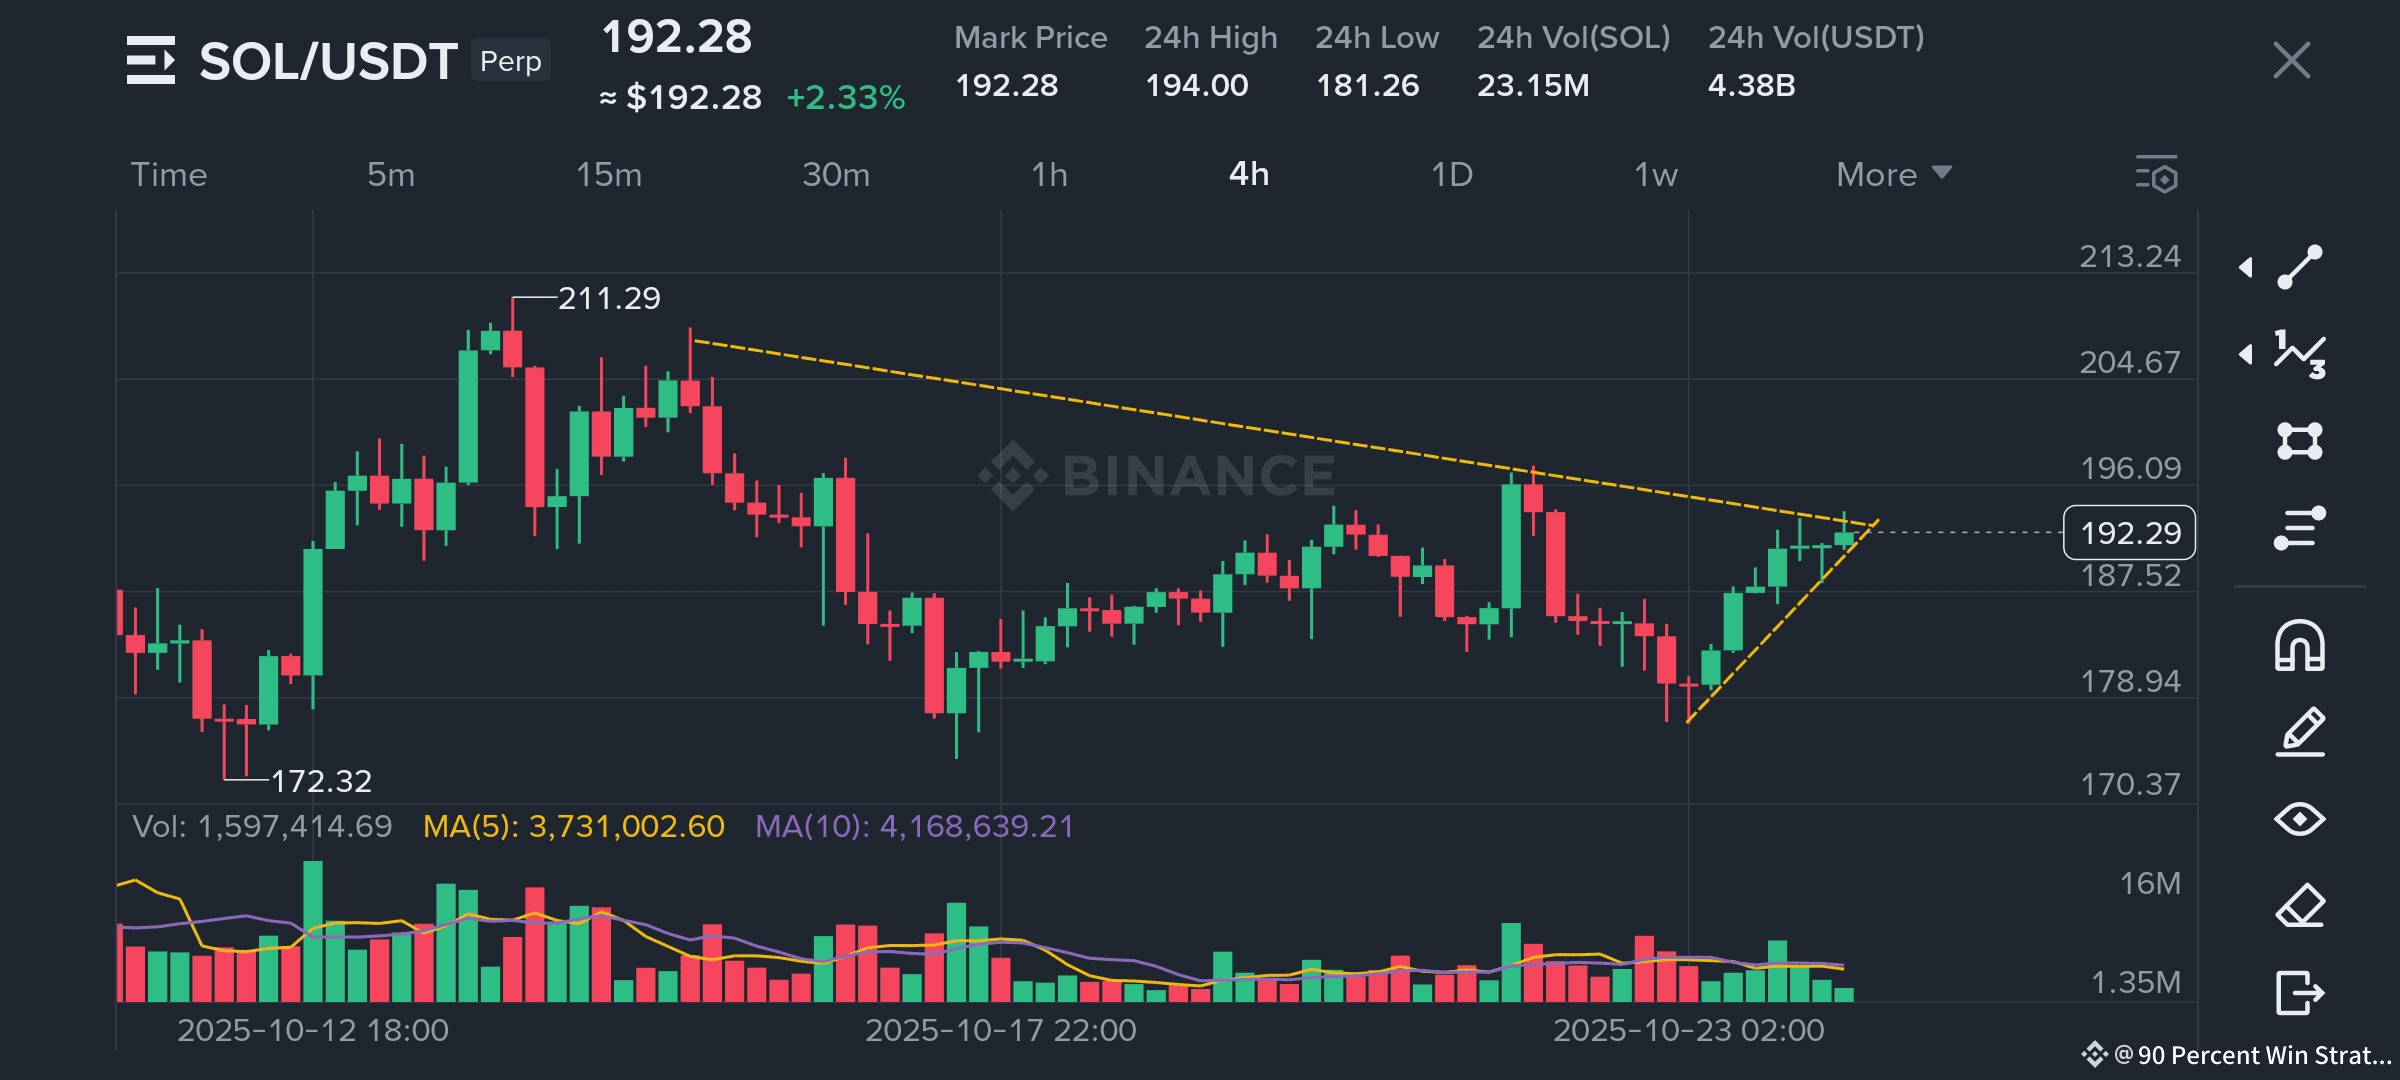
Chart 2: Swing Confirmation (Trendline Structure)
This looks like a healthy retest, not a full reversal, before the next move.
Structure: The price has broken the ascending trendline. This is the "perfect pullback entry" within an intact sideways trend.
Pattern: The initial breakout pattern remains valid. This dip is interpreted as a retest of the triangle support, not a reversal.
Confirmation: Volume contraction suggests an absorption phase is happening right now, preceding the next major price expansion.
Key Levels:]
🔨 Structure Resistance: $192.00 – $196.00
🛡️ Next Support Zones: $175.80 → 180.50
📈 Bias: Short Continuation - The primary trend remains intact.
Summary: The short-term bearish flip suggests a good opportunity to enter a short position, leveraging the retest of the broken swing structure. Trade safely! ⚠️
#APRBinanceTGE #MarketPullback #solanAnalysis