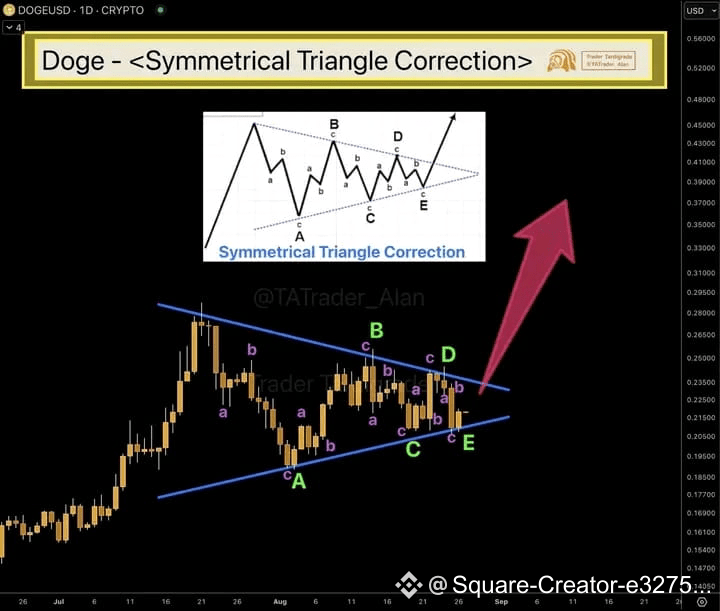
You have uploaded a technical analysis chart of Dogecoin (DOGE) that shows a symmetrical triangle correction. This pattern is typically considered a continuation pattern in Elliott Wave Theory, suggesting that the existing trend will likely continue after the pattern is completed. Let's break down the key elements shown in the image.
What the Chart Shows
The chart you provided illustrates a symmetrical triangle pattern forming in the price of Dogecoin.
A symmetrical triangle is a type of technical analysis chart pattern where two converging trend lines connect a series of peaks and troughs. The top trend line slopes downwards, while the bottom trend line slopes upwards, creating a triangle shape. .
The chart labels the internal waves of this pattern using Elliott Wave Theory, with the internal sub-waves labeled 'a', 'b', 'c', 'd', 'e' within the larger corrective waves labeled 'A', 'B', 'C', 'D', 'E'.
Interpretation and Forecast
Pattern Completion
Based on the chart, the price appears to be near the end of the 'E' wave, which is the final wave of the corrective pattern. This suggests that the symmetrical triangle is nearing its completion.
Breakout and Trend Continuation
The large red arrow on the chart indicates a potential upward breakout. This is the expected outcome for a symmetrical triangle in an overall uptrend. The theory suggests that once the 'E' wave is complete and the price breaks above the upper trend line of the triangle, it will resume the previous bullish trend.
In summary, the chart indicates that a significant price move is likely imminent for Dogecoin, and based on this specific pattern, the forecast is bullish. This analysis suggests a high probability of an upward breakout and a continuation of the upward trend after the completion of the symmetrical triangle correction.
$DOGE
What the Chart Shows
The chart you provided illustrates a symmetrical triangle pattern forming in the price of Dogecoin.
A symmetrical triangle is a type of technical analysis chart pattern where two converging trend lines connect a series of peaks and troughs. The top trend line slopes downwards, while the bottom trend line slopes upwards, creating a triangle shape. .
The chart labels the internal waves of this pattern using Elliott Wave Theory, with the internal sub-waves labeled 'a', 'b', 'c', 'd', 'e' within the larger corrective waves labeled 'A', 'B', 'C', 'D', 'E'.
Interpretation and Forecast
Pattern Completion
Based on the chart, the price appears to be near the end of the 'E' wave, which is the final wave of the corrective pattern. This suggests that the symmetrical triangle is nearing its completion.
Breakout and Trend Continuation
The large red arrow on the chart indicates a potential upward breakout. This is the expected outcome for a symmetrical triangle in an overall uptrend. The theory suggests that once the 'E' wave is complete and the price breaks above the upper trend line of the triangle, it will resume the previous bullish trend.
In summary, the chart indicates that a significant price move is likely imminent for Dogecoin, and based on this specific pattern, the forecast is bullish. This analysis suggests a high probability of an upward breakout and a continuation of the upward trend after the completion of the symmetrical triangle correction.
$DOGE