📉 Solana (SOL/USDT) Trend Analysis
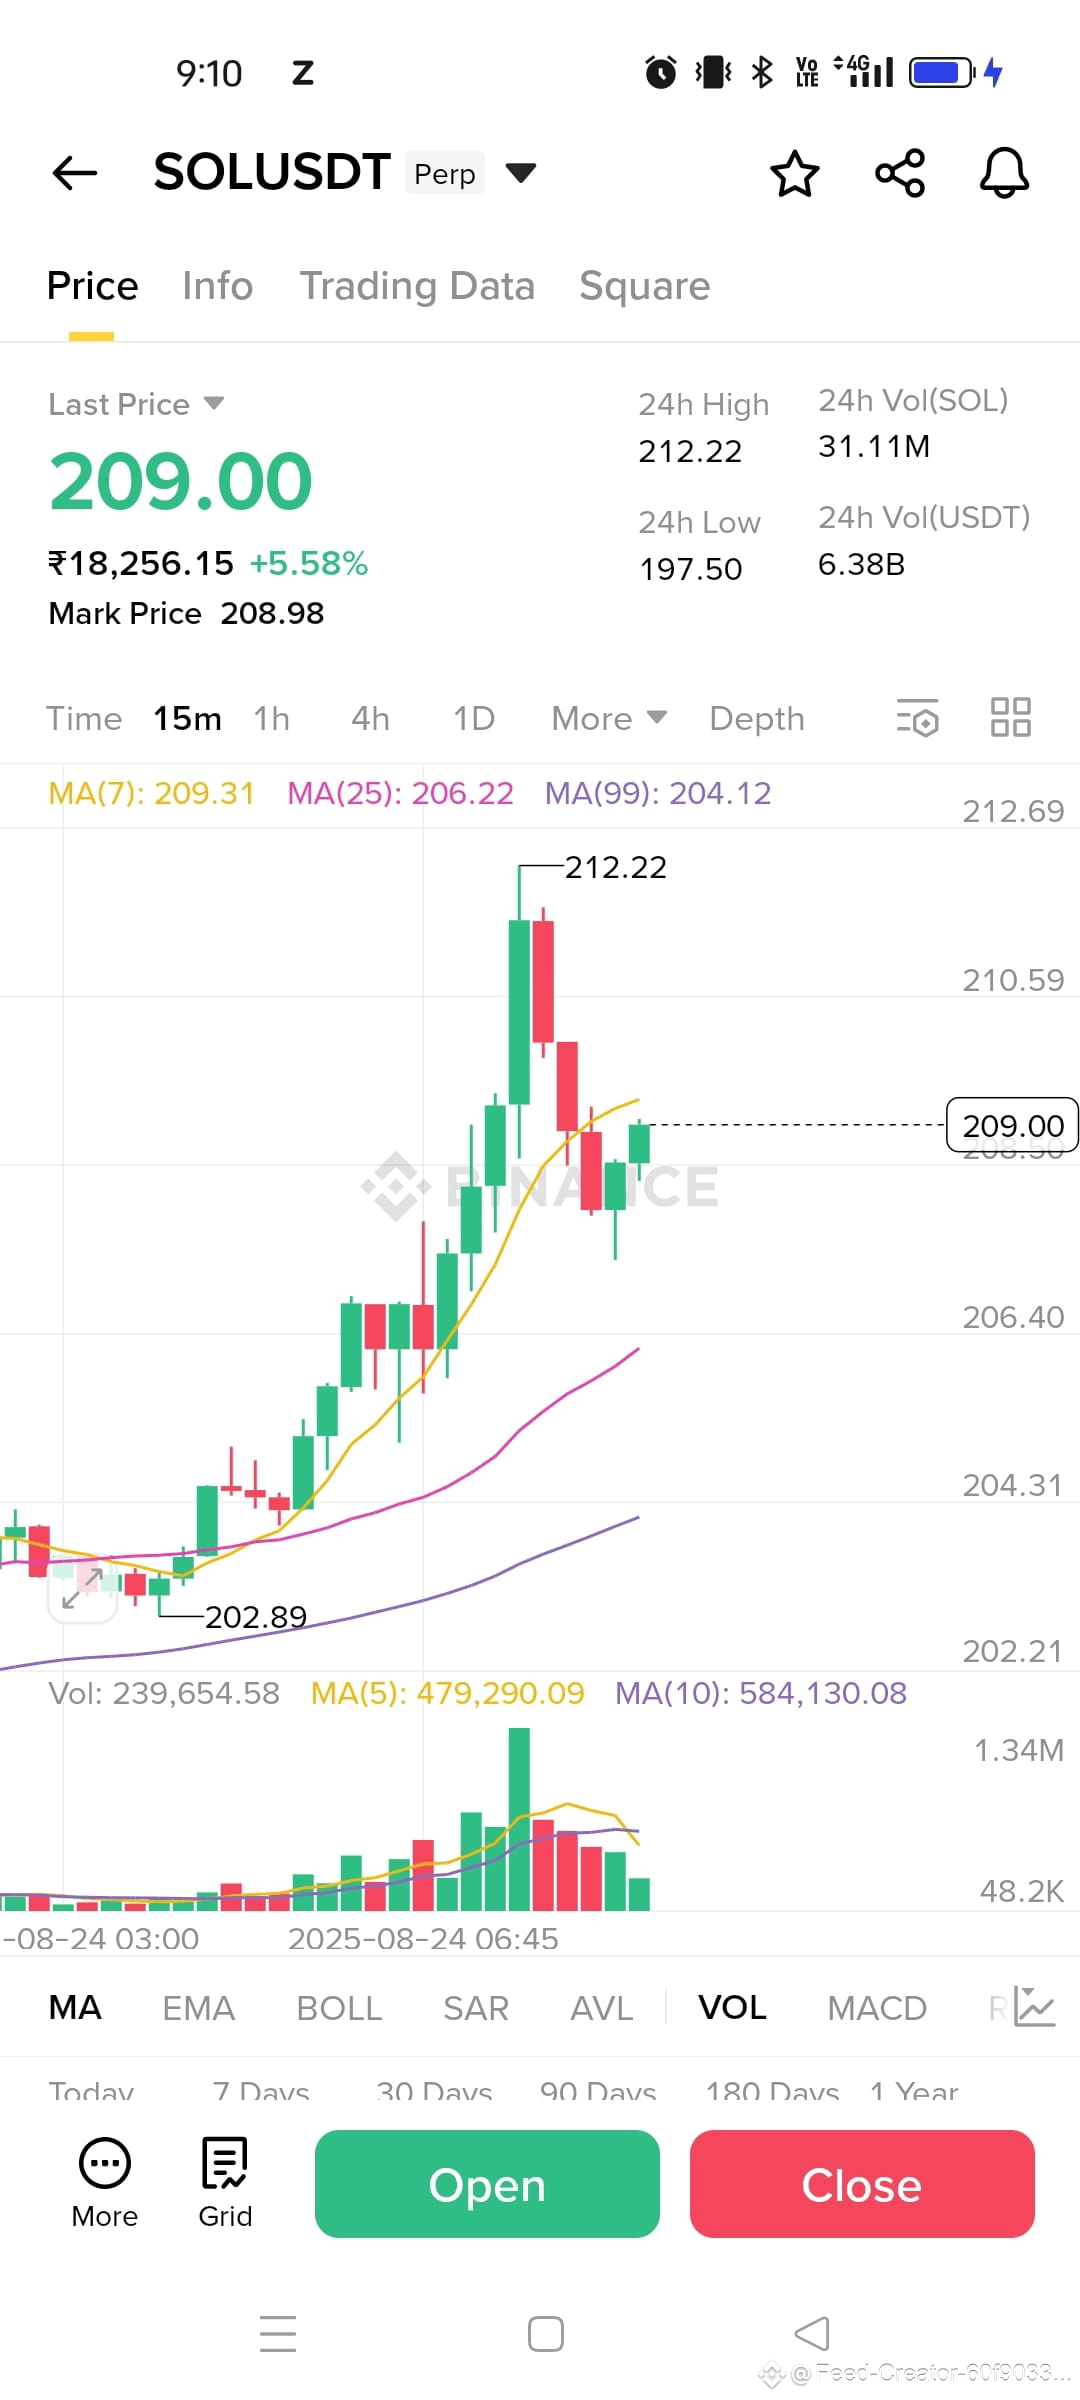
After touching a recent high of $212.22, Solana is showing signs of losing momentum. The price has pulled back to $209, and the candles on the 15m chart indicate selling pressure near the resistance zone.
Key points:
❌ Rejection at $212 suggests strong resistance.
📉 Price is now moving closer to short-term support at $206–$204.
📊 Trading volume is decreasing, which often signals weakness in the uptrend.
If SOL fails to hold above $206, we may see a shift towards a downtrend, with possible retests of $202 and below.
💬 What do you think?
➡️ Is this just a small correction before another move up, or are we entering a deeper downtrend? Share your opinion ⬇️#sol #BEARISH📉
After touching a recent high of $212.22, Solana is showing signs of losing momentum. The price has pulled back to $209, and the candles on the 15m chart indicate selling pressure near the resistance zone.
Key points:
❌ Rejection at $212 suggests strong resistance.
📉 Price is now moving closer to short-term support at $206–$204.
📊 Trading volume is decreasing, which often signals weakness in the uptrend.
If SOL fails to hold above $206, we may see a shift towards a downtrend, with possible retests of $202 and below.
💬 What do you think?
➡️ Is this just a small correction before another move up, or are we entering a deeper downtrend? Share your opinion ⬇️#sol #BEARISH📉