$BTC 📊 BTC/USDT Analysis
1. Price Action:
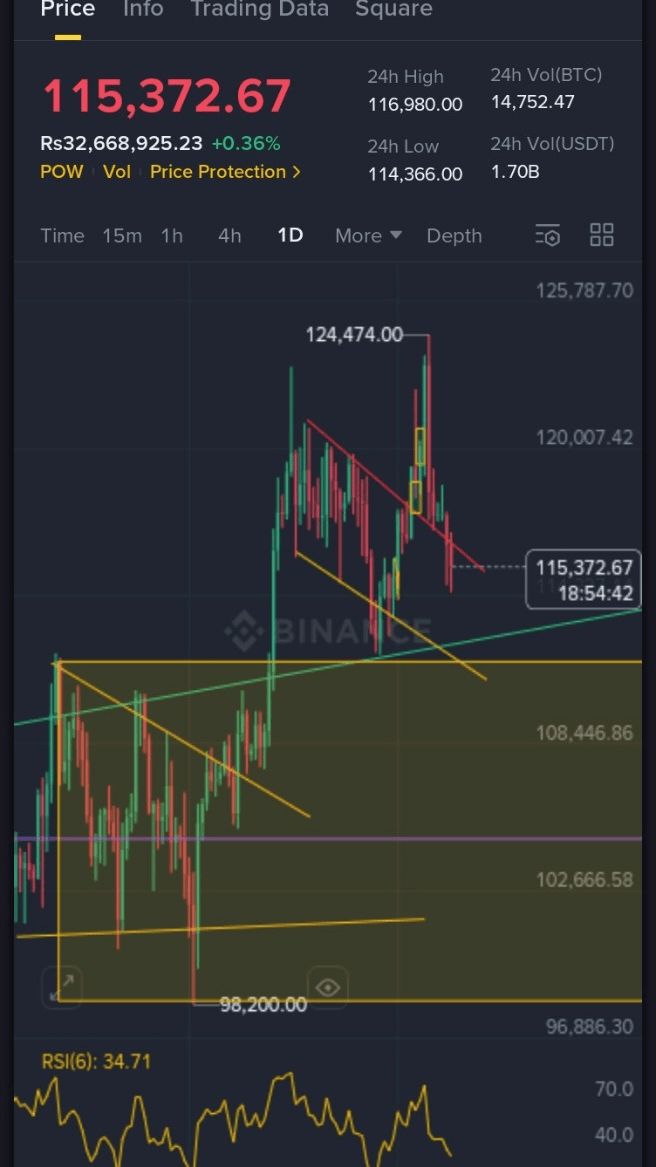
A high was made at 124,474, and since then price has been moving down.
Current price is 115,372 and it is forming lower highs + lower lows.
2. Trendline:
Price is trading close to the green uptrend support line.
If this breaks, there is a higher chance of moving further down.
3. RSI (Relative Strength Index):
Current RSI = 34, which is near the oversold zone (30).
This indicates selling pressure is high, but a bounce/reversal may come soon.
4. Support & Resistance Levels:
Support: 114,366 → 108,446 → 98,200
Resistance: 120,007 → 124,474
📉 Conclusion:
Short-term trend = Downtrend (because of lower highs & lower lows).
Major trend = Uptrend is still alive as long as 108,000 – 110,000 zone holds.
👉 In simple words:
Market is currently in a correction (downtrend).
If price holds above 114k–112k, trend can continue upward again.
If this zone breaks, price may fall to 108k and then 98k.
📊 Possible Scenarios
1. Bullish Scenario (Uptrend Continuation)
If price holds 114,000 – 112,000 support zone strongly.
RSI moves up from oversold.
Then price can bounce to 120,000 → 124,000.
If 124k resistance breaks → New high (130k+) possible.
2. Bearish Scenario (Downtrend Continuation)
If price closes below 114,000.
Next strong support = 108,000 – 110,000.
If this also breaks → price can drop to 98,200.
3. Sideways/Consolidation
Price may range between 114k – 120k for some days.
This is the decision zone → breakout up or breakdown down.
📌 For Traders
Short-Term Traders:
Buy only near strong supports (114k or 108k) with stoploss.
Sell/Short only if daily candle closes below 114k.
Long-Term Investors:
This correction is normal.
Main uptrend will only break if 98k support breaks.
Strong long-term buying zones = 108k and 98k.
#BTC走势分析 #UK #usa #UAE #BTC☀
1. Price Action:
A high was made at 124,474, and since then price has been moving down.
Current price is 115,372 and it is forming lower highs + lower lows.
2. Trendline:
Price is trading close to the green uptrend support line.
If this breaks, there is a higher chance of moving further down.
3. RSI (Relative Strength Index):
Current RSI = 34, which is near the oversold zone (30).
This indicates selling pressure is high, but a bounce/reversal may come soon.
4. Support & Resistance Levels:
Support: 114,366 → 108,446 → 98,200
Resistance: 120,007 → 124,474
📉 Conclusion:
Short-term trend = Downtrend (because of lower highs & lower lows).
Major trend = Uptrend is still alive as long as 108,000 – 110,000 zone holds.
👉 In simple words:
Market is currently in a correction (downtrend).
If price holds above 114k–112k, trend can continue upward again.
If this zone breaks, price may fall to 108k and then 98k.
📊 Possible Scenarios
1. Bullish Scenario (Uptrend Continuation)
If price holds 114,000 – 112,000 support zone strongly.
RSI moves up from oversold.
Then price can bounce to 120,000 → 124,000.
If 124k resistance breaks → New high (130k+) possible.
2. Bearish Scenario (Downtrend Continuation)
If price closes below 114,000.
Next strong support = 108,000 – 110,000.
If this also breaks → price can drop to 98,200.
3. Sideways/Consolidation
Price may range between 114k – 120k for some days.
This is the decision zone → breakout up or breakdown down.
📌 For Traders
Short-Term Traders:
Buy only near strong supports (114k or 108k) with stoploss.
Sell/Short only if daily candle closes below 114k.
Long-Term Investors:
This correction is normal.
Main uptrend will only break if 98k support breaks.
Strong long-term buying zones = 108k and 98k.
#BTC走势分析 #UK #usa #UAE #BTC☀