$BTC
🟢 BTC/USDT Technical & Fundamental Analysis
📅 Date: July 12, 2025
📊 Exchange: Binance
🔄 Pair: BTC/USDT
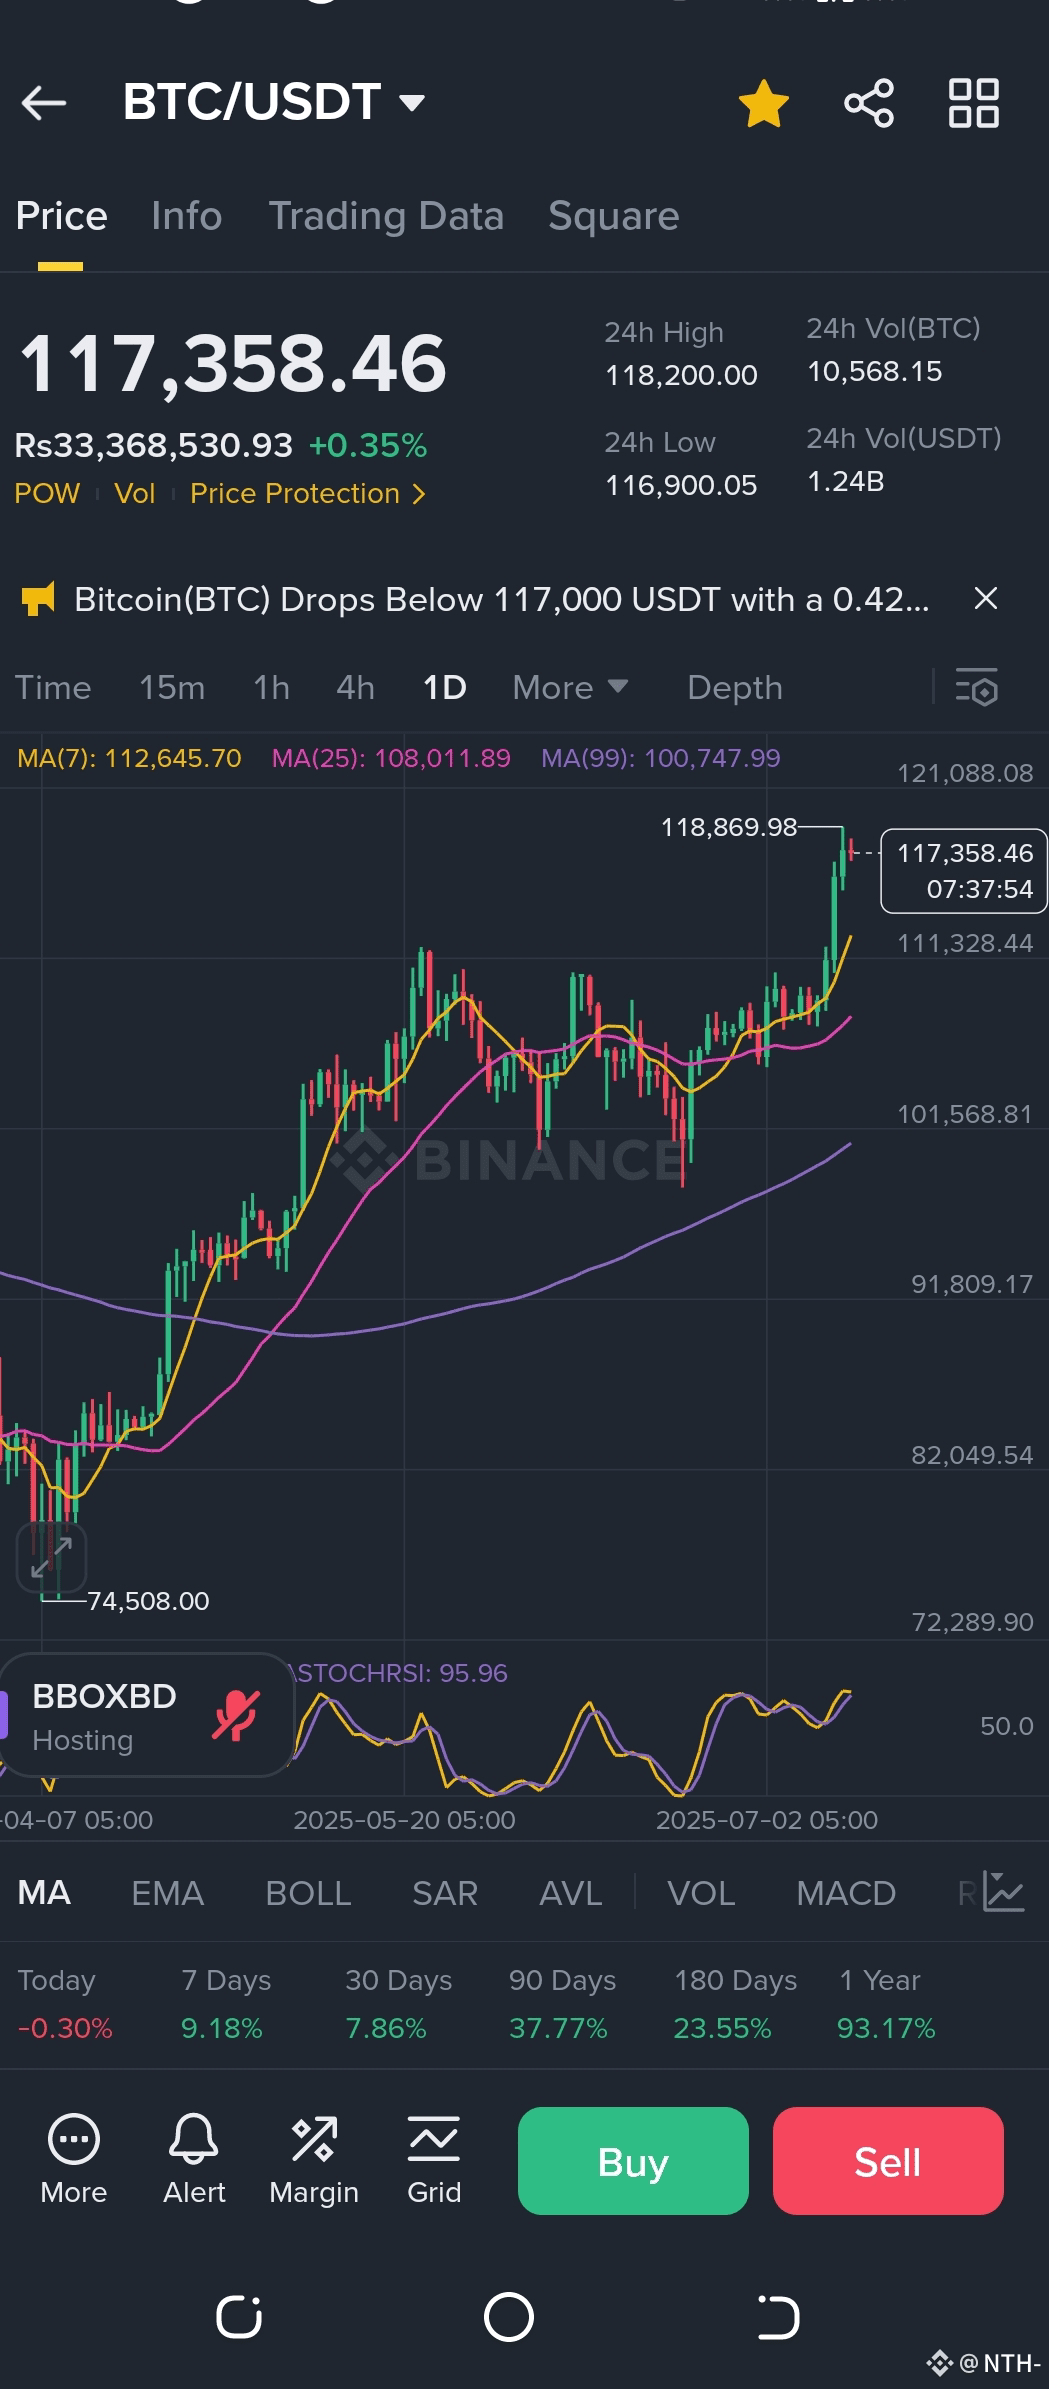
📌 Current Price: $117,358.46 (+0.35%)
🔍 Technical Analysis (1D Chart)
🔸 Key Indicators:
MA(7): $112,645.70 ✅ Short-term bullish crossover
MA(25): $108,011.89 ✅ Mid-term uptrend
MA(99): $100,747.99 🔼 Long-term support strong
Stochastic RSI: 95.96 ⚠️ Overbought zone – possible short-term pullback
📈 Support & Resistance Levels:
Resistance: $118,869.98 (Recent High)
Support: $111,328.44 (Local MA zone), $101,568.81 (Next strong support)
⚠️ Trend Summary:
Trend: Bullish continuation with strong buying volume
Structure: Higher highs and higher lows confirmed
Warning: StochRSI indicates overheating – some correction possible
💹 Volume & Order Book Analysis
🔸 24h Volume:
BTC: 10,568.15 BTC
USDT: $1.24B – Strong liquidity
🧾 Order Book Snapshot:
Buy Orders:
Large buyer clusters between $116,000–$117,000
Indicates strong demand support below current price
Sell Orders:
Resistance begins from $118,200+
Moderate profit-taking seen above current zone
📰 Fundamental Drivers
🔺 Recent Positive News:
ETF Inflows Rebound: Institutional inflows into spot Bitcoin ETFs have resumed, driving momentum.
Macro Easing Signals: Fed rate-cut talks signal risk-on behavior returning.
Hashrate Stability: Bitcoin’s network is stable post-recent difficulty adjustment.
🔻 Risk Factors:
Mt. Gox Repayments: Anticipated distribution of BTC could increase short-term volatility.
Regulatory Overhang: Ongoing US policy discussions may impact sentiment.
📌 Conclusion:
Bitcoin remains in a strong bullish phase, driven by institutional interest, strong macro trends, and technical strength. While short-term pullbacks are likely due to overbought indicators, the long-term structure remains intact. Buyers are active around $116K, with sellers looking to exit above $118K. Caution advised near resistance zones, but dips may offer strategic re-entry opportunities.
🟢 BTC/USDT Technical & Fundamental Analysis
📅 Date: July 12, 2025
📊 Exchange: Binance
🔄 Pair: BTC/USDT
📌 Current Price: $117,358.46 (+0.35%)
🔍 Technical Analysis (1D Chart)
🔸 Key Indicators:
MA(7): $112,645.70 ✅ Short-term bullish crossover
MA(25): $108,011.89 ✅ Mid-term uptrend
MA(99): $100,747.99 🔼 Long-term support strong
Stochastic RSI: 95.96 ⚠️ Overbought zone – possible short-term pullback
📈 Support & Resistance Levels:
Resistance: $118,869.98 (Recent High)
Support: $111,328.44 (Local MA zone), $101,568.81 (Next strong support)
⚠️ Trend Summary:
Trend: Bullish continuation with strong buying volume
Structure: Higher highs and higher lows confirmed
Warning: StochRSI indicates overheating – some correction possible
💹 Volume & Order Book Analysis
🔸 24h Volume:
BTC: 10,568.15 BTC
USDT: $1.24B – Strong liquidity
🧾 Order Book Snapshot:
Buy Orders:
Large buyer clusters between $116,000–$117,000
Indicates strong demand support below current price
Sell Orders:
Resistance begins from $118,200+
Moderate profit-taking seen above current zone
📰 Fundamental Drivers
🔺 Recent Positive News:
ETF Inflows Rebound: Institutional inflows into spot Bitcoin ETFs have resumed, driving momentum.
Macro Easing Signals: Fed rate-cut talks signal risk-on behavior returning.
Hashrate Stability: Bitcoin’s network is stable post-recent difficulty adjustment.
🔻 Risk Factors:
Mt. Gox Repayments: Anticipated distribution of BTC could increase short-term volatility.
Regulatory Overhang: Ongoing US policy discussions may impact sentiment.
📌 Conclusion:
Bitcoin remains in a strong bullish phase, driven by institutional interest, strong macro trends, and technical strength. While short-term pullbacks are likely due to overbought indicators, the long-term structure remains intact. Buyers are active around $116K, with sellers looking to exit above $118K. Caution advised near resistance zones, but dips may offer strategic re-entry opportunities.