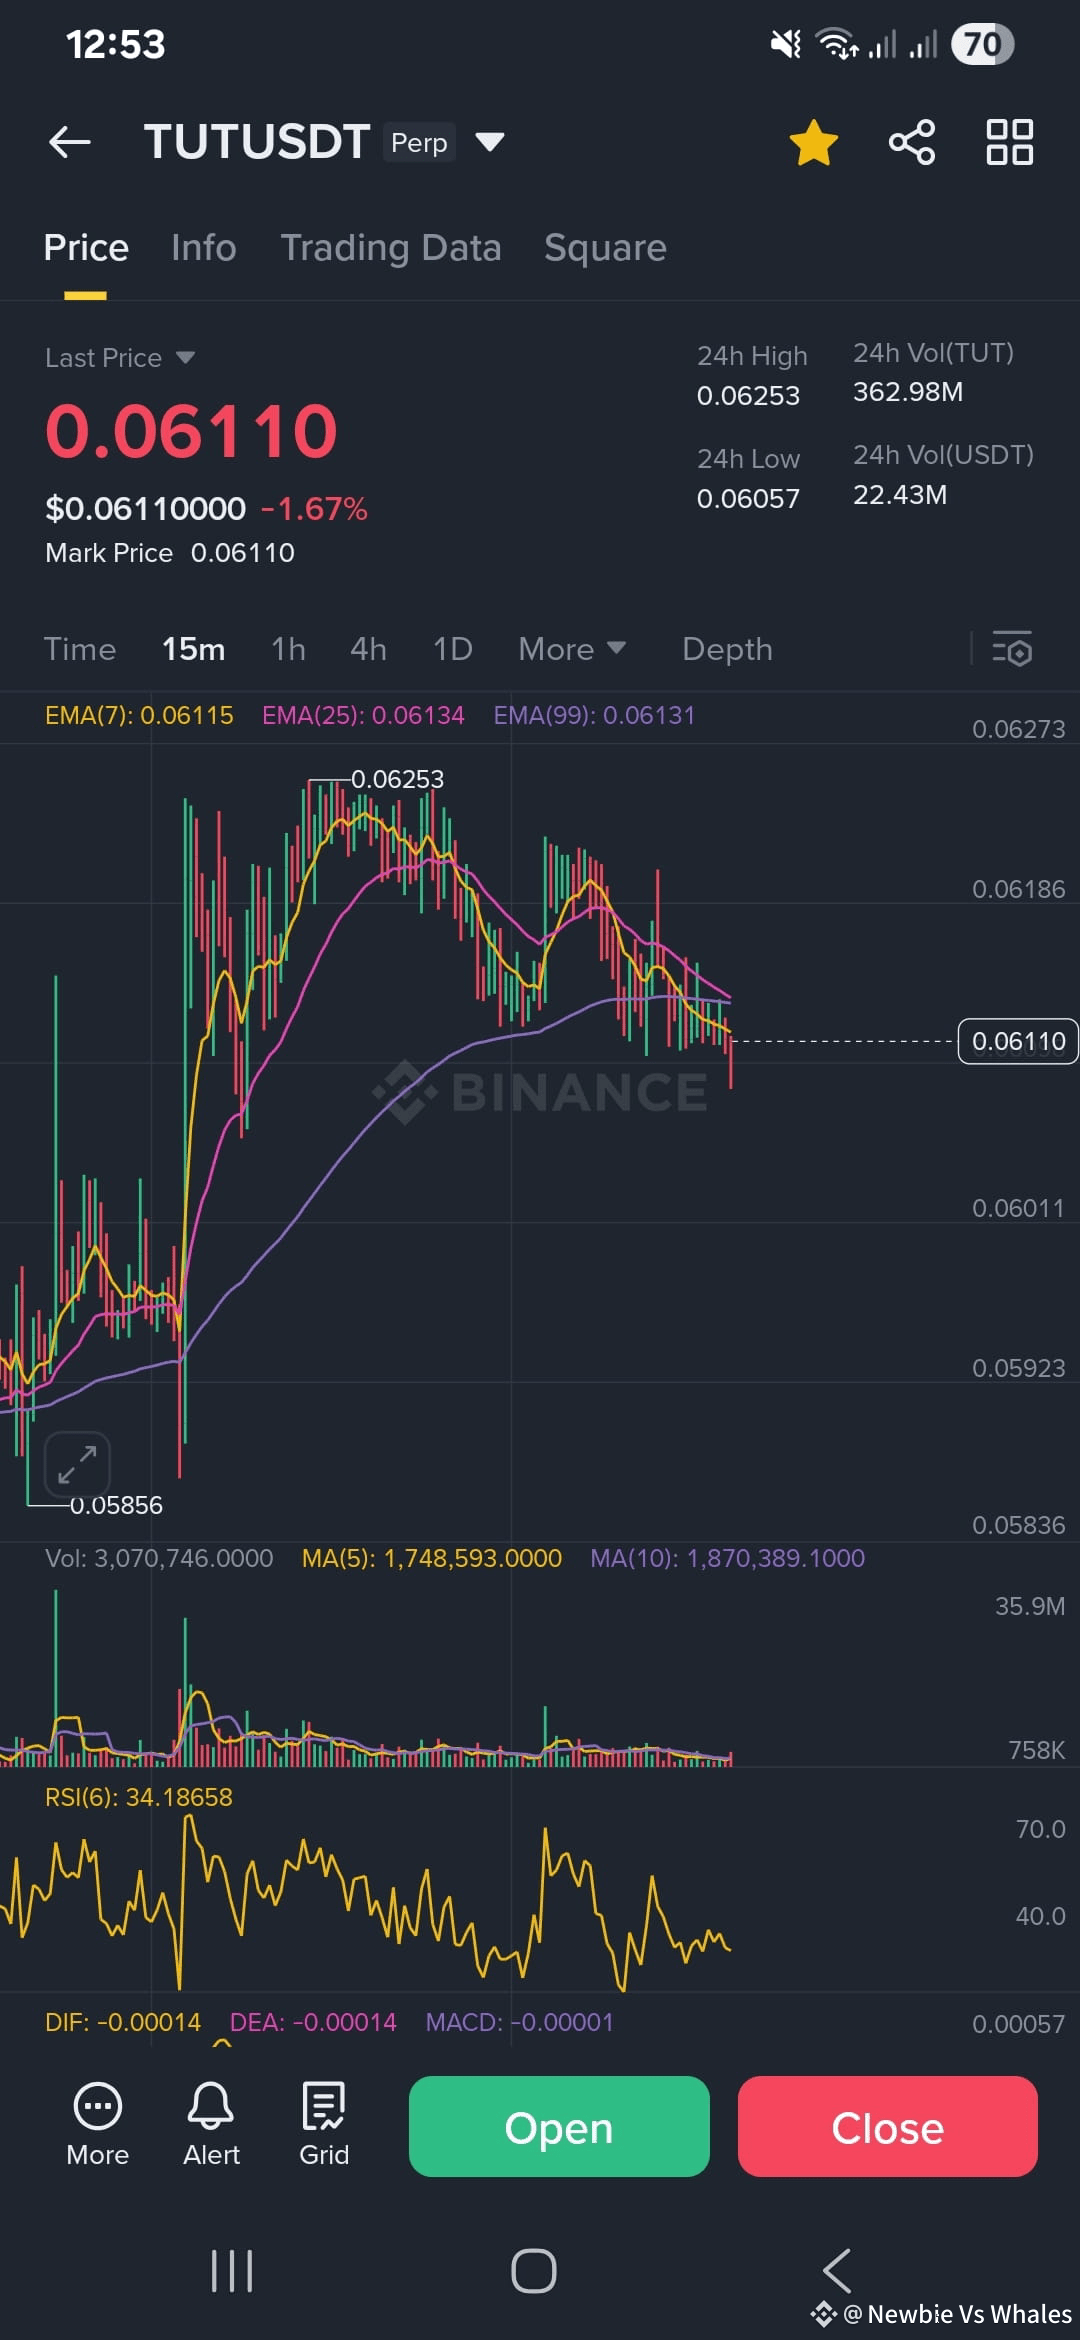
#STAYSAFU Here's an updated overview of TUTUSDT
📈 Daily & Multi‑Timeframe Overview
Daily chart: Price ~ $0.0612, up ~2–3% in the past 24 h; recent breakout above key short-term MA zone indicates bullish bias .
3-day candle: Price rebounded from ~$0.044, gaining roughly 25–30%—a sign of medium-term bullish pressure .
Weekly candle: Showed a strong long lower wick, reflecting significant buying at dips and confirming bullish sentiment over the week .
Support & Resistance Levels to Note (Daily/Weekly):
🔵 Support zone: $0.0542–$0.0549 (50-day MA / recent low) .
🔴 Resistance zones: $0.0613 (recent ATH), next at ~$0.063–$0.065 .
🔄 Strategy Integration Across Timeframes
🎯 Mid-term (Daily/Weekly) Perspective:
Bias: Bullish. Weekly and 3-day candles suggest strong buying interest near dips.
Key zones: Monitor $0.054–$0.055 for support; watch for breakout above $0.0613–$0.062 as bullish triggers.
🕒 Short-Term (15m) Plan (Your Existing Setup):
Long entry above: $0.0625–$0.0630
SL: $0.0604
TPs: $0.065, $0.0675, $0.070 (for aggressive squeeze)
If price fails and breaks down: Consider short targeting $0.0588–$0.055
🧭 Unified View
Bullish view (aligned across timeframes):
Weekly/3-day show dip buying
Daily shows breakout and higher highs
Short squeeze could trigger an aggressive move above $0.063
Bearish fallback:
If $0.0604 breaks, daily bias may shift, opening shorts toward $0.056–$0.053
✔️ What You Should Do Now (15m time frame):
1. Monitor 15m price action:
Stay alert to breakouts above $0.063 (confirm squeeze trigger).
Watch support at ~$0.0604–$0.0605 (break here invalidates long plan).
2. Align trades with higher timeframe context:
A successful bounce above daily resistance ($0.0613–$0.062) increases the chance of reaching long-term targets.
A breakdown may lead to tests of daily/weekly support.
📌 Summary Table
Timeframe Key Levels Bias Trade Setup
Weekly / 3-day Support: $0.054–$0.055, Resistance: $0.0613+ Bullish Use dips for long entries
Daily Support: $0.0542, Resistance: $0.0613
#STAYSAFU
📈 Daily & Multi‑Timeframe Overview
Daily chart: Price ~ $0.0612, up ~2–3% in the past 24 h; recent breakout above key short-term MA zone indicates bullish bias .
3-day candle: Price rebounded from ~$0.044, gaining roughly 25–30%—a sign of medium-term bullish pressure .
Weekly candle: Showed a strong long lower wick, reflecting significant buying at dips and confirming bullish sentiment over the week .
Support & Resistance Levels to Note (Daily/Weekly):
🔵 Support zone: $0.0542–$0.0549 (50-day MA / recent low) .
🔴 Resistance zones: $0.0613 (recent ATH), next at ~$0.063–$0.065 .
🔄 Strategy Integration Across Timeframes
🎯 Mid-term (Daily/Weekly) Perspective:
Bias: Bullish. Weekly and 3-day candles suggest strong buying interest near dips.
Key zones: Monitor $0.054–$0.055 for support; watch for breakout above $0.0613–$0.062 as bullish triggers.
🕒 Short-Term (15m) Plan (Your Existing Setup):
Long entry above: $0.0625–$0.0630
SL: $0.0604
TPs: $0.065, $0.0675, $0.070 (for aggressive squeeze)
If price fails and breaks down: Consider short targeting $0.0588–$0.055
🧭 Unified View
Bullish view (aligned across timeframes):
Weekly/3-day show dip buying
Daily shows breakout and higher highs
Short squeeze could trigger an aggressive move above $0.063
Bearish fallback:
If $0.0604 breaks, daily bias may shift, opening shorts toward $0.056–$0.053
✔️ What You Should Do Now (15m time frame):
1. Monitor 15m price action:
Stay alert to breakouts above $0.063 (confirm squeeze trigger).
Watch support at ~$0.0604–$0.0605 (break here invalidates long plan).
2. Align trades with higher timeframe context:
A successful bounce above daily resistance ($0.0613–$0.062) increases the chance of reaching long-term targets.
A breakdown may lead to tests of daily/weekly support.
📌 Summary Table
Timeframe Key Levels Bias Trade Setup
Weekly / 3-day Support: $0.054–$0.055, Resistance: $0.0613+ Bullish Use dips for long entries
Daily Support: $0.0542, Resistance: $0.0613
#STAYSAFU