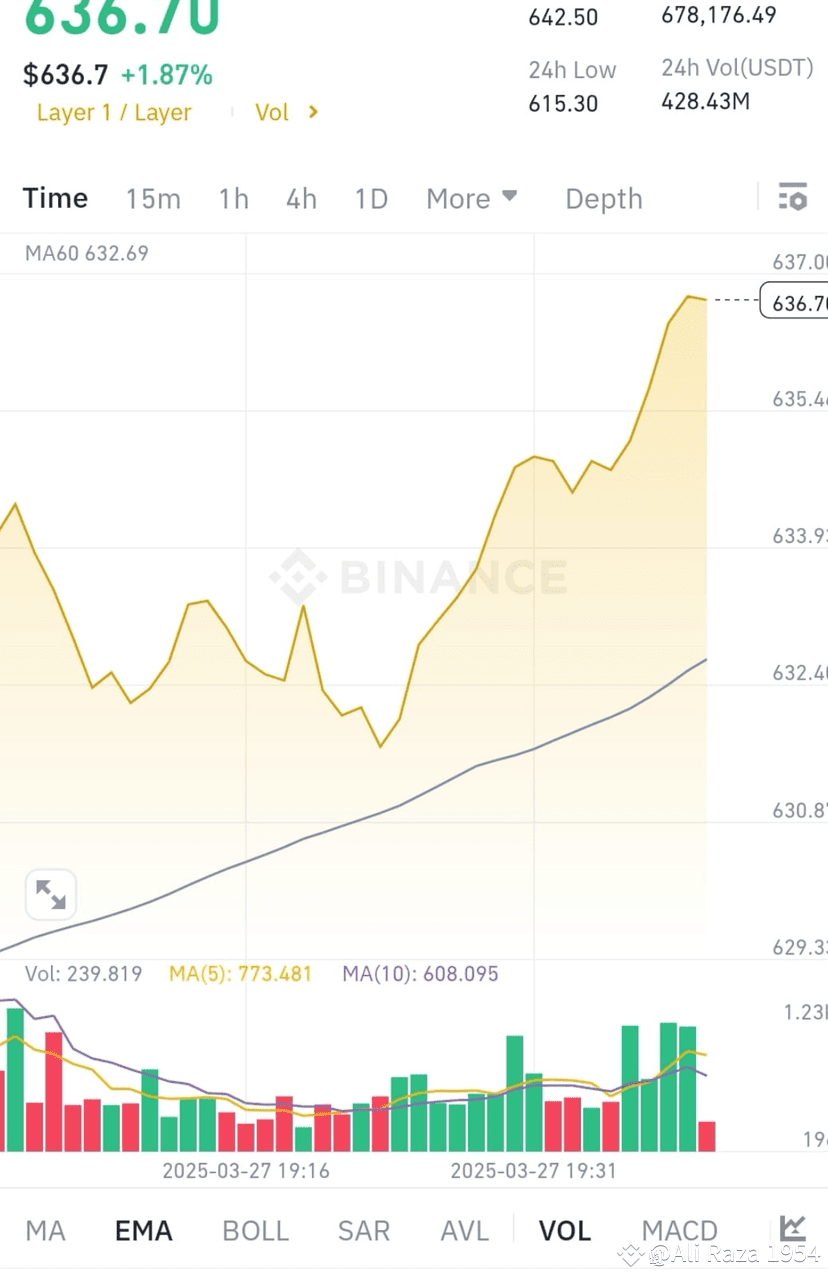
$BNB $BNB here is a technical analysis of the BNB/USDT
### **Trend Analysis**
1. **Current Price:** **$636.70**
2. **24h High/Low:** **$642.50 / $615.30**
- The price is moving closer to the 24h high, indicating bullish momentum.
3. **Moving Averages (MA):**
- **MA60 (632.69):** The price is above the 60-period moving average, showing an uptrend.
- **MA5 (773.481) & MA10 (608.095):** The short-term MA is above the long-term MA, confirming a bullish crossover.
### **Volume Analysis**
- The volume bars show increasing green candles, indicating buying pressure.
- **24h Volume (USDT):** **428.43M**, suggesting strong market activity.
### **Performance Over Time**
- **Today:** **+3.06%** (Strong positive move)
- **7 Days:** **+2.47%**
- **30 Days:** **+0.59%**
- **90 Days:** **-8.12%** (Longer-term downtrend still present)
- **180 Days:** **+4.65%**
- **1 Year:** **+10.57%** (Overall bullish)
### **Buy/Sell Signal**
- The short-term trend is bullish.
- The price is above key moving averages, and volume supports the uptrend.
- However, long-term performance (90 days) is still negative, meaning a full reversal isn’t confirmed yet.
### **Conclusion**
- **Buy Signal:** If the price sustains above **$637**, it could continue the upward movement.
- **Sell Signal:** If the price falls below **$632**, it may indicate a pullback.
- **Risk Warning:** Watch resistance at **$642.50** (24h High). If it breaks above, it could rally further.#BinanceAlphaAlert
$BNB
### **Trend Analysis**
1. **Current Price:** **$636.70**
2. **24h High/Low:** **$642.50 / $615.30**
- The price is moving closer to the 24h high, indicating bullish momentum.
3. **Moving Averages (MA):**
- **MA60 (632.69):** The price is above the 60-period moving average, showing an uptrend.
- **MA5 (773.481) & MA10 (608.095):** The short-term MA is above the long-term MA, confirming a bullish crossover.
### **Volume Analysis**
- The volume bars show increasing green candles, indicating buying pressure.
- **24h Volume (USDT):** **428.43M**, suggesting strong market activity.
### **Performance Over Time**
- **Today:** **+3.06%** (Strong positive move)
- **7 Days:** **+2.47%**
- **30 Days:** **+0.59%**
- **90 Days:** **-8.12%** (Longer-term downtrend still present)
- **180 Days:** **+4.65%**
- **1 Year:** **+10.57%** (Overall bullish)
### **Buy/Sell Signal**
- The short-term trend is bullish.
- The price is above key moving averages, and volume supports the uptrend.
- However, long-term performance (90 days) is still negative, meaning a full reversal isn’t confirmed yet.
### **Conclusion**
- **Buy Signal:** If the price sustains above **$637**, it could continue the upward movement.
- **Sell Signal:** If the price falls below **$632**, it may indicate a pullback.
- **Risk Warning:** Watch resistance at **$642.50** (24h High). If it breaks above, it could rally further.#BinanceAlphaAlert
$BNB