🤑Buy and hold $RED
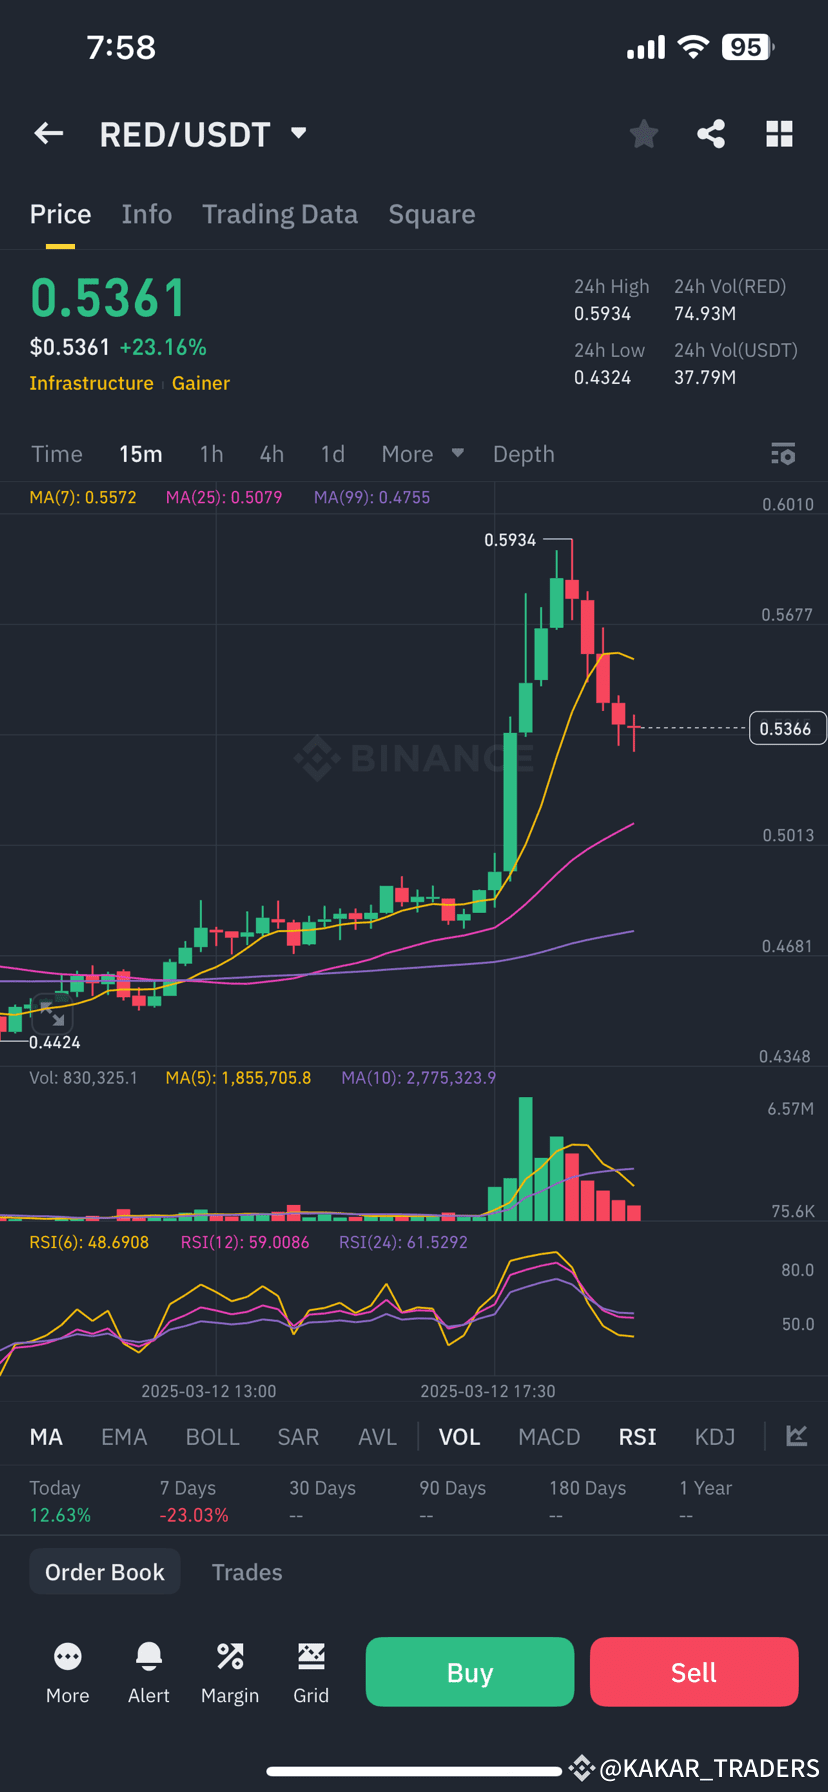
Based on the chart of RED/USDT from Binance, the overall trend still appears bullish despite the recent pullback. Here’s why it could be a good time to buy and hold:
1. Strong Uptrend Confirmation
• The price recently hit a high of $0.5934, showing strong bullish momentum.
• It is currently consolidating near $0.5361, which could act as a support level before another upward move.
2. Moving Averages Indicate Bullishness
• The 7-period MA ($0.5572) is above the 25-period MA ($0.5079) and the 99-period MA ($0.4755), suggesting an overall bullish trend.
• The price remains above the long-term moving averages, indicating that buying pressure is still present.
3. RSI Suggests Room for Growth
• The RSI(6) at 48.69 shows the price has cooled off from overbought levels, making it a good entry point.
• The RSI(12) at 59.00 and RSI(24) at 61.52 indicate that momentum is still on the bullish side.
4. Volume Analysis
• The recent price surge was supported by high trading volume, confirming strong buyer interest.
• Although the volume has slightly decreased, the market remains liquid, meaning another bullish wave is possible.
5. Market Sentiment & Price Action
• A pullback after a strong rally is a healthy sign of trend continuation rather than reversal.
• If support holds around $0.5300–$0.5400, the price could consolidate before another breakout towards $0.6000 and beyond.
Conclusion: Buy & Hold Opportunity
This dip could be a great buying opportunity before the next leg up. The overall trend remains bullish, and holding onto RED/USDT could lead to potential gains if the momentum continues.
Based on the chart of RED/USDT from Binance, the overall trend still appears bullish despite the recent pullback. Here’s why it could be a good time to buy and hold:
1. Strong Uptrend Confirmation
• The price recently hit a high of $0.5934, showing strong bullish momentum.
• It is currently consolidating near $0.5361, which could act as a support level before another upward move.
2. Moving Averages Indicate Bullishness
• The 7-period MA ($0.5572) is above the 25-period MA ($0.5079) and the 99-period MA ($0.4755), suggesting an overall bullish trend.
• The price remains above the long-term moving averages, indicating that buying pressure is still present.
3. RSI Suggests Room for Growth
• The RSI(6) at 48.69 shows the price has cooled off from overbought levels, making it a good entry point.
• The RSI(12) at 59.00 and RSI(24) at 61.52 indicate that momentum is still on the bullish side.
4. Volume Analysis
• The recent price surge was supported by high trading volume, confirming strong buyer interest.
• Although the volume has slightly decreased, the market remains liquid, meaning another bullish wave is possible.
5. Market Sentiment & Price Action
• A pullback after a strong rally is a healthy sign of trend continuation rather than reversal.
• If support holds around $0.5300–$0.5400, the price could consolidate before another breakout towards $0.6000 and beyond.
Conclusion: Buy & Hold Opportunity
This dip could be a great buying opportunity before the next leg up. The overall trend remains bullish, and holding onto RED/USDT could lead to potential gains if the momentum continues.