
#weeklystructure
weeklystructure
376 ຄັ້ງທີ່ເບິ່ງ
15 ກຳລັງສົນທະນາ
ມາແຮງ
ຫຼ້າສຸດ

🚨 $BTC HOLDING THROUGH $6.3B security incident & FED HAWKINESS 🦈
📊 BTC is defending the 50‑week moving average around $75,550 despite a $6.3 B Binance breach and a hawkish Fed stance. The weekly RSI nudges above 50, indicating neutral momentum while sellers are being soaked at the $75‑$78k zone.
⚡ The chart mirrors early‑2023: a tight range around major weekly averages, then a breakout toward the 100‑week line near $89,100. Watch the 200‑week floor at $67,800 for a decisive test of accumulation versus distribution.
💬 Do you view this hold as genuine accumulation or a fragile defense? 👇
⚠️ Not financial advice. Always manage your risk. 🛡️
🏷️ #BTC #Accumulation #WeeklyStructure #Crypto
🦈 ⚡
🚨 $BTC HOLDING THROUGH $6.3B security incident & FED HAWKINESS 🦈
📊 BTC is defending the 50‑week moving average around $75,550 despite a $6.3 B Binance breach and a hawkish Fed stance. The weekly RSI nudges above 50, indicating neutral momentum while sellers are being soaked at the $75‑$78k zone.
⚡ The chart mirrors early‑2023: a tight range around major weekly averages, then a breakout toward the 100‑week line near $89,100. Watch the 200‑week floor at $67,800 for a decisive test of accumulation versus distribution.
💬 Do you view this hold as genuine accumulation or a fragile defense? 👇
⚠️ Not financial advice. Always manage your risk. 🛡️
🏷️ #BTC #Accumulation #WeeklyStructure #Crypto
🦈 ⚡
📊 BTC is defending the 50‑week moving average around $75,550 despite a $6.3 B Binance breach and a hawkish Fed stance. The weekly RSI nudges above 50, indicating neutral momentum while sellers are being soaked at the $75‑$78k zone.
⚡ The chart mirrors early‑2023: a tight range around major weekly averages, then a breakout toward the 100‑week line near $89,100. Watch the 200‑week floor at $67,800 for a decisive test of accumulation versus distribution.
💬 Do you view this hold as genuine accumulation or a fragile defense? 👇
⚠️ Not financial advice. Always manage your risk. 🛡️
🏷️ #BTC #Accumulation #WeeklyStructure #Crypto
🦈 ⚡
9

·
--
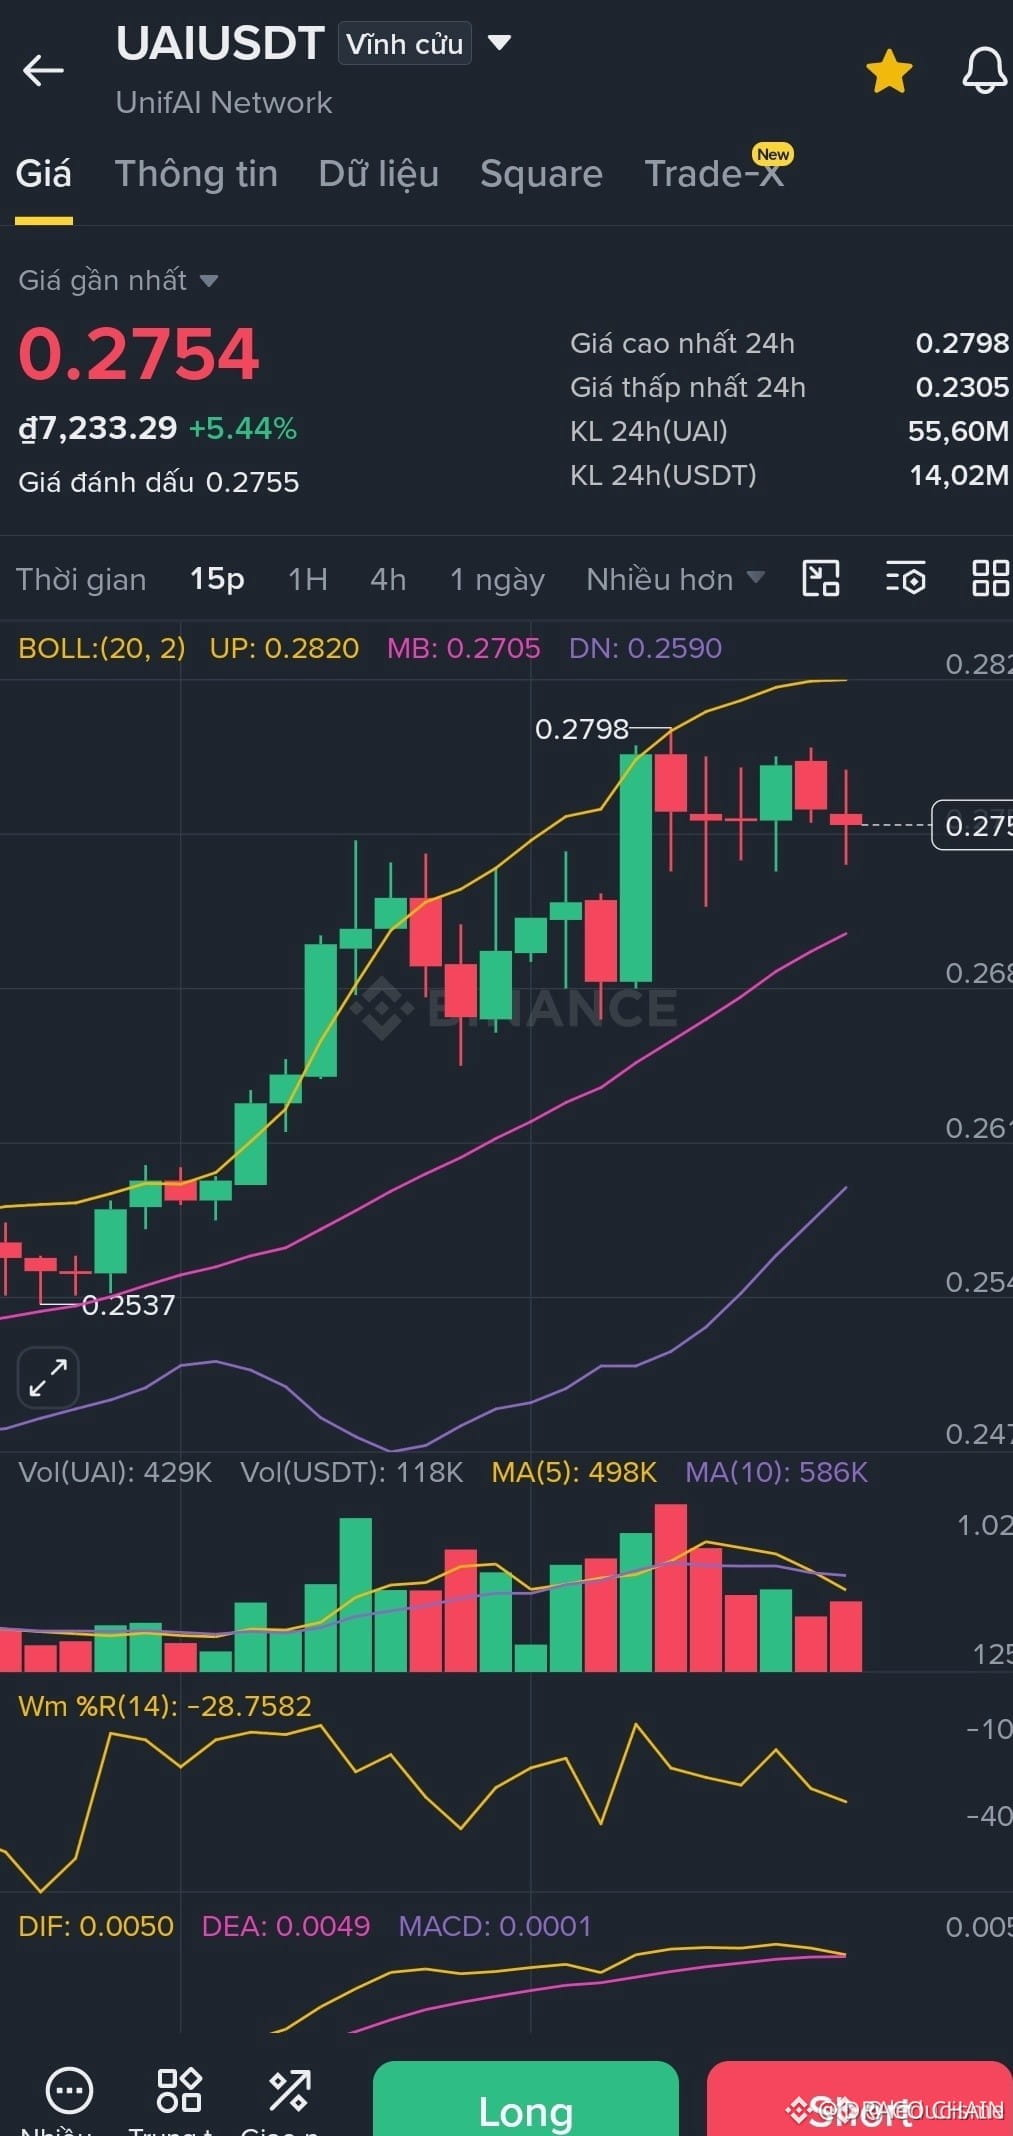
🦈 $UAI WEEKLY ORDER FLOW REVERSES AT $0.27 — BIG TARGET IN THE MIRROR 📈
Entry: $0.27 ⚡
Target: $0.50+ 🚀
The bid structure under $0.27 is refusing to loosen—weekly demand has defended the $0.23–$0.25 shelf with repeated aggression, and every pullback is being absorbed quickly. 📊 The liquidity landscape above $0.32–$0.35 looks thin, meaning a decisive weekly break could trigger an inefficiency fill straight toward the next major pool near $0.50+. 💡
This isn't a random bounce; the footprint reveals buyers repositioning on the weekly frame ahead of continuation. Entering at $0.27 keeps risk neatly defined below the demand shelf, while the upside window remains aggressive if resistance flips. Does your plan favor a direct rally from here, or are you waiting for one final shakeout to load the same zone? 👇
⚠️ Not financial advice. Always manage your risk. 🛡️
🏷️ #UAI #WeeklyStructure #LongSetup #Crypto
🎯 🦈
🦈 $UAI WEEKLY ORDER FLOW REVERSES AT $0.27 — BIG TARGET IN THE MIRROR 📈
Entry: $0.27 ⚡
Target: $0.50+ 🚀
The bid structure under $0.27 is refusing to loosen—weekly demand has defended the $0.23–$0.25 shelf with repeated aggression, and every pullback is being absorbed quickly. 📊 The liquidity landscape above $0.32–$0.35 looks thin, meaning a decisive weekly break could trigger an inefficiency fill straight toward the next major pool near $0.50+. 💡
This isn't a random bounce; the footprint reveals buyers repositioning on the weekly frame ahead of continuation. Entering at $0.27 keeps risk neatly defined below the demand shelf, while the upside window remains aggressive if resistance flips. Does your plan favor a direct rally from here, or are you waiting for one final shakeout to load the same zone? 👇
⚠️ Not financial advice. Always manage your risk. 🛡️
🏷️ #UAI #WeeklyStructure #LongSetup #Crypto
🎯 🦈
Entry: $0.27 ⚡
Target: $0.50+ 🚀
The bid structure under $0.27 is refusing to loosen—weekly demand has defended the $0.23–$0.25 shelf with repeated aggression, and every pullback is being absorbed quickly. 📊 The liquidity landscape above $0.32–$0.35 looks thin, meaning a decisive weekly break could trigger an inefficiency fill straight toward the next major pool near $0.50+. 💡
This isn't a random bounce; the footprint reveals buyers repositioning on the weekly frame ahead of continuation. Entering at $0.27 keeps risk neatly defined below the demand shelf, while the upside window remains aggressive if resistance flips. Does your plan favor a direct rally from here, or are you waiting for one final shakeout to load the same zone? 👇
⚠️ Not financial advice. Always manage your risk. 🛡️
🏷️ #UAI #WeeklyStructure #LongSetup #Crypto
🎯 🦈
127

·
--
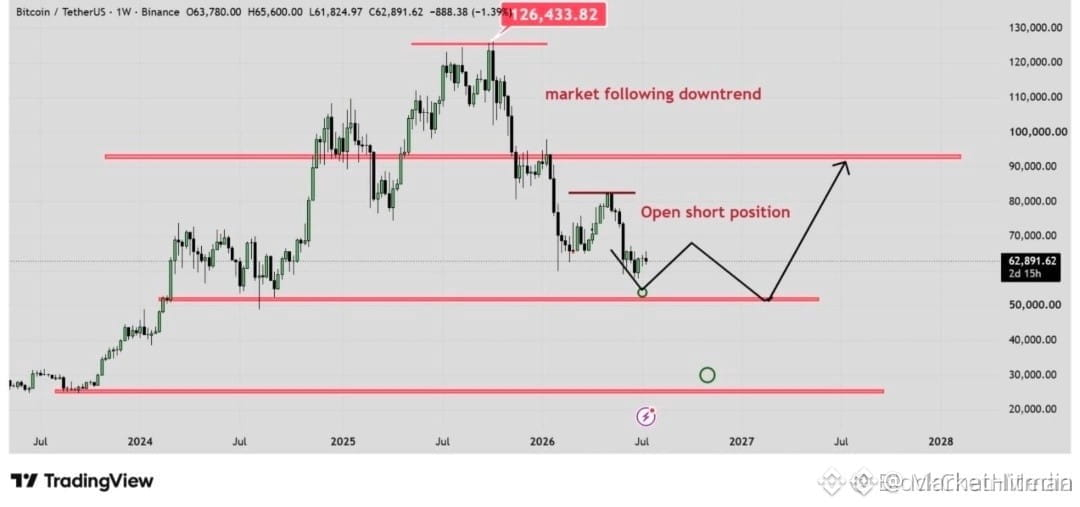
WEEKLY STRUCTURE SHOWS $BTC AT A CRITICAL SUPPORT DECISION ZONE 💎
The weekly trend remains bearish after failing at major resistance, but price is now approaching a support zone that has historically drawn buyer interest. Volume on the daily timeframe is contracting — often a precursor to an impulsive move.
If the zone holds with volume, a relief rally toward the next resistance becomes likely. A breakdown with strong volume, however, would confirm continued downside pressure before a more substantial recovery. The best traders let the chart confirm first.
Are you waiting for that confirmation or positioning ahead of the move?
Not financial advice. Always manage your risk.
#BTC #WeeklyStructure #SupportZone #CryptoAnalysis
💎
WEEKLY STRUCTURE SHOWS $BTC AT A CRITICAL SUPPORT DECISION ZONE 💎
The weekly trend remains bearish after failing at major resistance, but price is now approaching a support zone that has historically drawn buyer interest. Volume on the daily timeframe is contracting — often a precursor to an impulsive move.
If the zone holds with volume, a relief rally toward the next resistance becomes likely. A breakdown with strong volume, however, would confirm continued downside pressure before a more substantial recovery. The best traders let the chart confirm first.
Are you waiting for that confirmation or positioning ahead of the move?
Not financial advice. Always manage your risk.
#BTC #WeeklyStructure #SupportZone #CryptoAnalysis
💎
The weekly trend remains bearish after failing at major resistance, but price is now approaching a support zone that has historically drawn buyer interest. Volume on the daily timeframe is contracting — often a precursor to an impulsive move.
If the zone holds with volume, a relief rally toward the next resistance becomes likely. A breakdown with strong volume, however, would confirm continued downside pressure before a more substantial recovery. The best traders let the chart confirm first.
Are you waiting for that confirmation or positioning ahead of the move?
Not financial advice. Always manage your risk.
#BTC #WeeklyStructure #SupportZone #CryptoAnalysis
💎
31
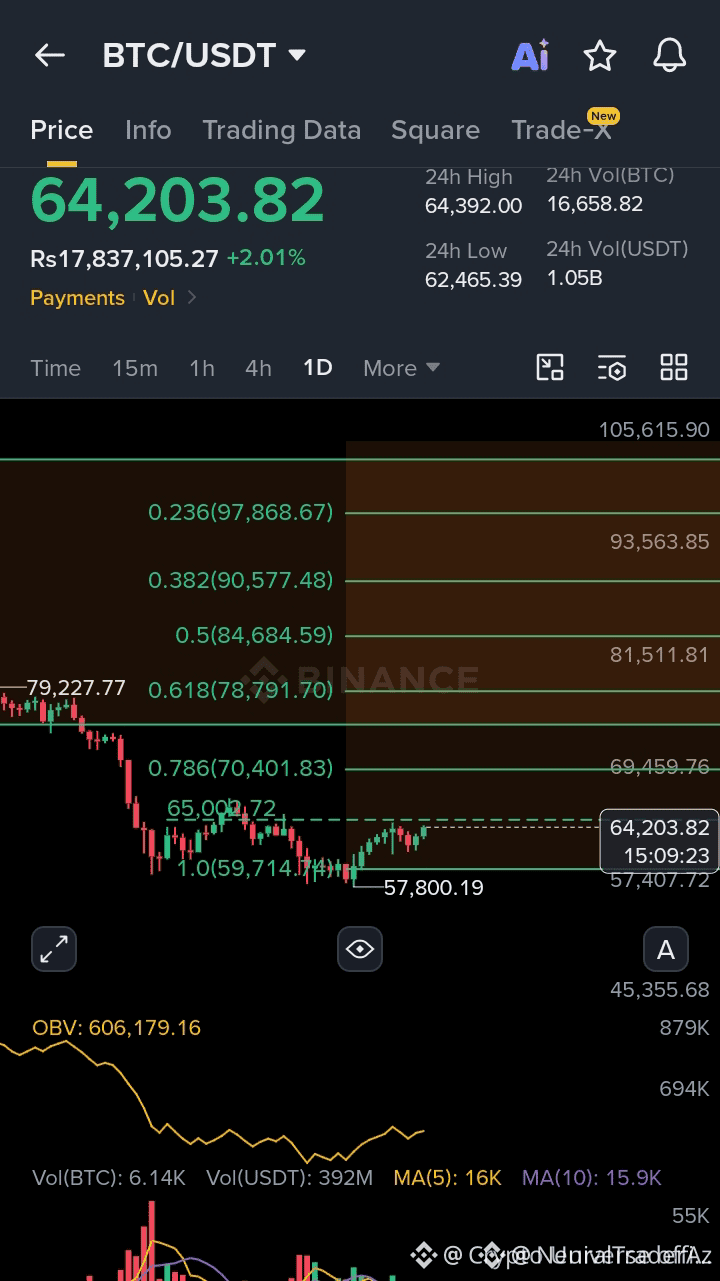
$BTC WEEKLY STRUCTURE REMAINS BULLISH ABOVE KEY SUPPORT 📈
The weekly chart continues to show Bitcoin holding above a major support zone while overall structure stays intact. Sellers have repeatedly failed to reclaim lower levels, keeping the path open for another leg higher before the next consolidation phase.
Patience remains key here. Instead of forcing shorts at support, waiting for a cleaner entry with stronger risk-to-reward is the smarter play. Do you think #BTC will rally one more time before a deeper correction, or are we closer to a top than most expect?
Not financial advice. Always manage your risk.
#BTC #Bullish #WeeklyStructure #CryptoAnalysis
🔥
$BTC WEEKLY STRUCTURE REMAINS BULLISH ABOVE KEY SUPPORT 📈
The weekly chart continues to show Bitcoin holding above a major support zone while overall structure stays intact. Sellers have repeatedly failed to reclaim lower levels, keeping the path open for another leg higher before the next consolidation phase.
Patience remains key here. Instead of forcing shorts at support, waiting for a cleaner entry with stronger risk-to-reward is the smarter play. Do you think #BTC will rally one more time before a deeper correction, or are we closer to a top than most expect?
Not financial advice. Always manage your risk.
#BTC #Bullish #WeeklyStructure #CryptoAnalysis
🔥
The weekly chart continues to show Bitcoin holding above a major support zone while overall structure stays intact. Sellers have repeatedly failed to reclaim lower levels, keeping the path open for another leg higher before the next consolidation phase.
Patience remains key here. Instead of forcing shorts at support, waiting for a cleaner entry with stronger risk-to-reward is the smarter play. Do you think #BTC will rally one more time before a deeper correction, or are we closer to a top than most expect?
Not financial advice. Always manage your risk.
#BTC #Bullish #WeeklyStructure #CryptoAnalysis
🔥
42

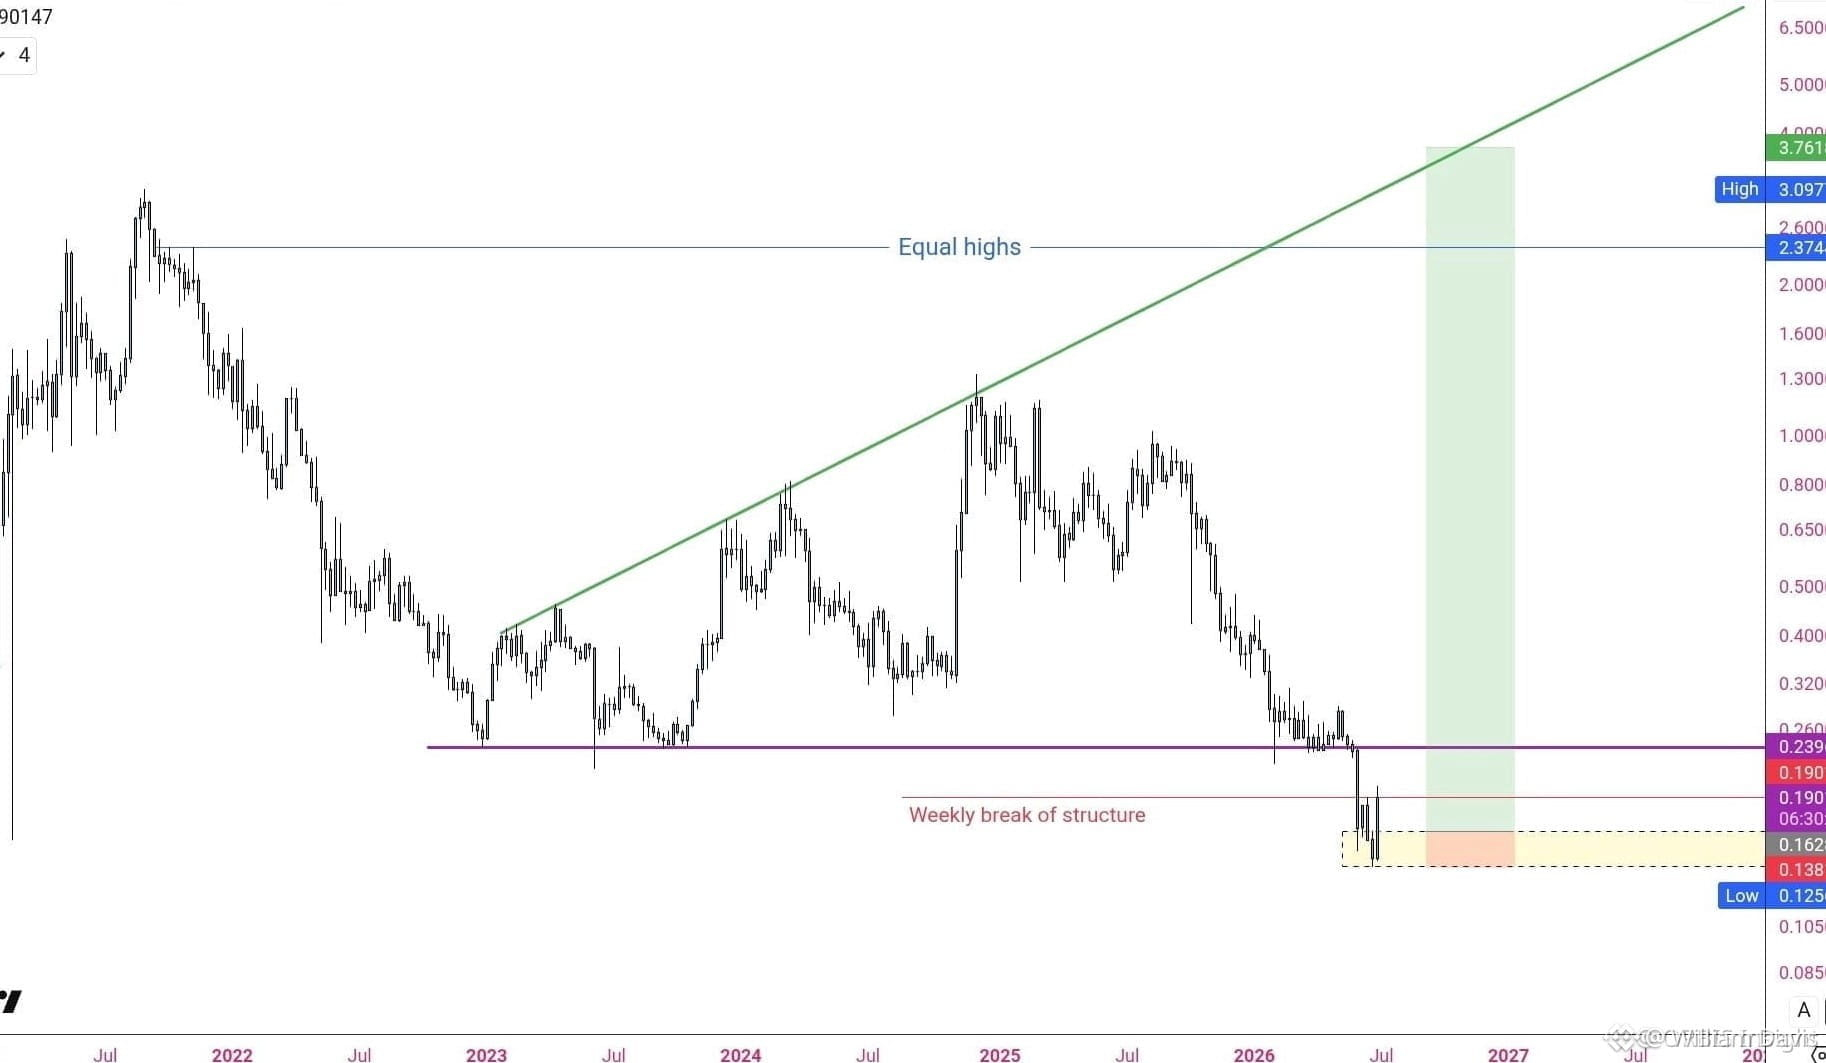
$ADA BREAKS 5-YEAR DOWNTREND STRUCTURE WITH 145X R:R 🔥
Entry: Demand zone top (weekly wick) 🔥
Target: Equal highs 🚀
Stop Loss: Below demand zone wick (weekly) ⚠️
This weekly structure break is the first significant shift in nearly half a decade. The demand zone that held for years is now acting as support, and the measured move to equal highs offers a 145x risk-to-reward ratio — an outlier even on higher timeframes.
Volume has yet to confirm, but the structural evidence is clear. Traders who respect the longer timeframe will watch the retest closely. Are you entering on the break or waiting for the retest?
Not financial advice. Always manage your risk.
#ADA #LongSetup #Breakout #Crypto #WeeklyStructure
🔥
$ADA BREAKS 5-YEAR DOWNTREND STRUCTURE WITH 145X R:R 🔥
Entry: Demand zone top (weekly wick) 🔥
Target: Equal highs 🚀
Stop Loss: Below demand zone wick (weekly) ⚠️
This weekly structure break is the first significant shift in nearly half a decade. The demand zone that held for years is now acting as support, and the measured move to equal highs offers a 145x risk-to-reward ratio — an outlier even on higher timeframes.
Volume has yet to confirm, but the structural evidence is clear. Traders who respect the longer timeframe will watch the retest closely. Are you entering on the break or waiting for the retest?
Not financial advice. Always manage your risk.
#ADA #LongSetup #Breakout #Crypto #WeeklyStructure
🔥
Entry: Demand zone top (weekly wick) 🔥
Target: Equal highs 🚀
Stop Loss: Below demand zone wick (weekly) ⚠️
This weekly structure break is the first significant shift in nearly half a decade. The demand zone that held for years is now acting as support, and the measured move to equal highs offers a 145x risk-to-reward ratio — an outlier even on higher timeframes.
Volume has yet to confirm, but the structural evidence is clear. Traders who respect the longer timeframe will watch the retest closely. Are you entering on the break or waiting for the retest?
Not financial advice. Always manage your risk.
#ADA #LongSetup #Breakout #Crypto #WeeklyStructure
🔥
77
·
--
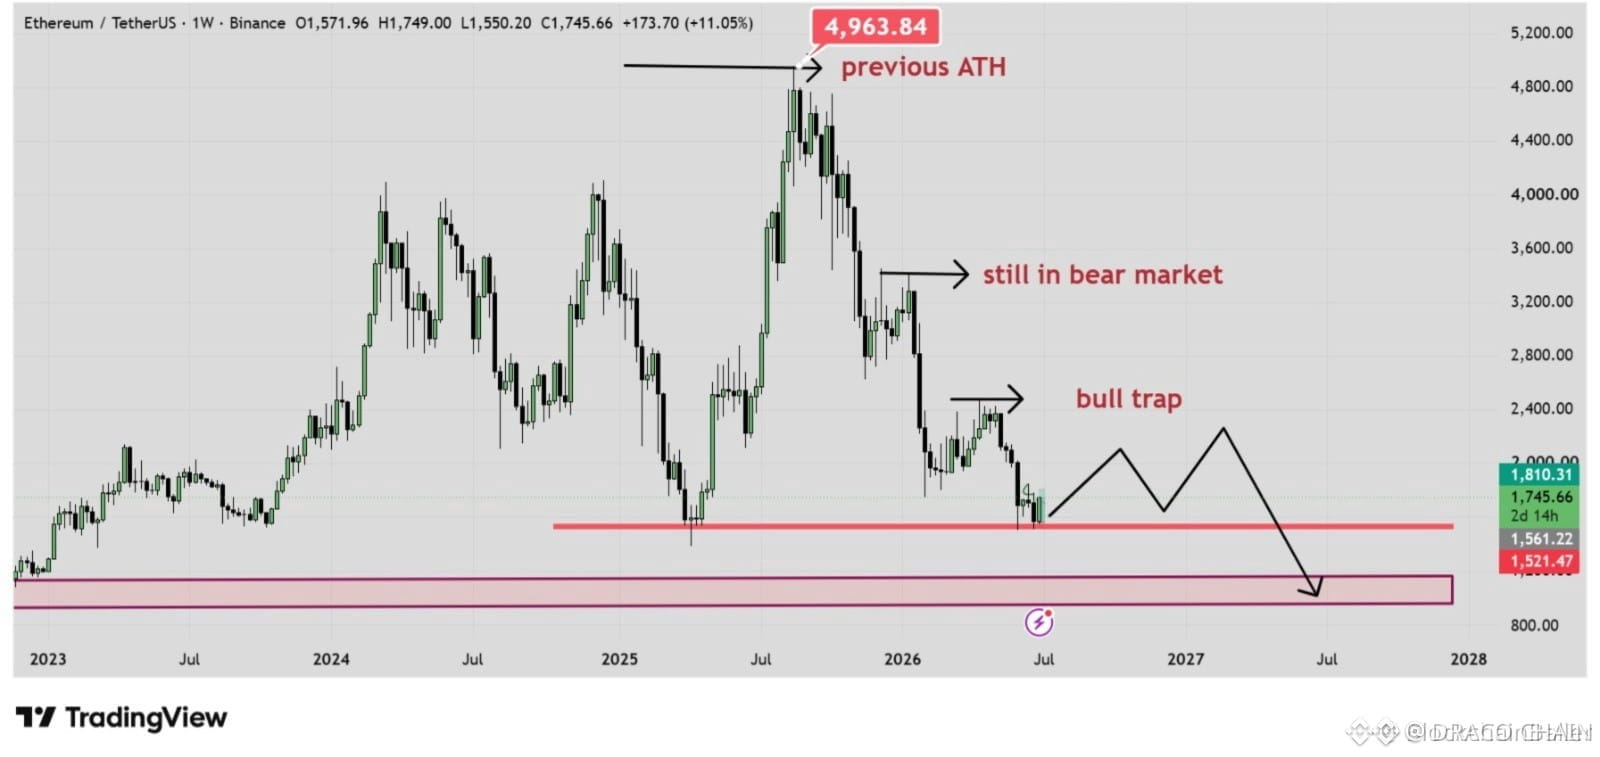
$ETH SUPPORT ZONE IS THE LAST LINE BEFORE A MAJOR LIQUIDITY SWEEP ⚡
The $1,500-$1,600 area has historically drawn strong buyers, but Ethereum’s weekly chart remains in a downtrend with lower highs and lower lows. A relief rally could trap late buyers before a deeper move toward $900-$1,100.
The weekly RSI is hovering near oversold territory—similar to past capitulation events. Momentum is fading on the daily, and volume suggests indecision. Are you bidding at support or waiting for a clean sweep below $1,500?
Not financial advice. Always manage your risk.
#ETH #Ethereum #WeeklyStructure #SupportZone #Crypto
⚡
$ETH SUPPORT ZONE IS THE LAST LINE BEFORE A MAJOR LIQUIDITY SWEEP ⚡
The $1,500-$1,600 area has historically drawn strong buyers, but Ethereum’s weekly chart remains in a downtrend with lower highs and lower lows. A relief rally could trap late buyers before a deeper move toward $900-$1,100.
The weekly RSI is hovering near oversold territory—similar to past capitulation events. Momentum is fading on the daily, and volume suggests indecision. Are you bidding at support or waiting for a clean sweep below $1,500?
Not financial advice. Always manage your risk.
#ETH #Ethereum #WeeklyStructure #SupportZone #Crypto
⚡
The $1,500-$1,600 area has historically drawn strong buyers, but Ethereum’s weekly chart remains in a downtrend with lower highs and lower lows. A relief rally could trap late buyers before a deeper move toward $900-$1,100.
The weekly RSI is hovering near oversold territory—similar to past capitulation events. Momentum is fading on the daily, and volume suggests indecision. Are you bidding at support or waiting for a clean sweep below $1,500?
Not financial advice. Always manage your risk.
#ETH #Ethereum #WeeklyStructure #SupportZone #Crypto
⚡
42

·
--
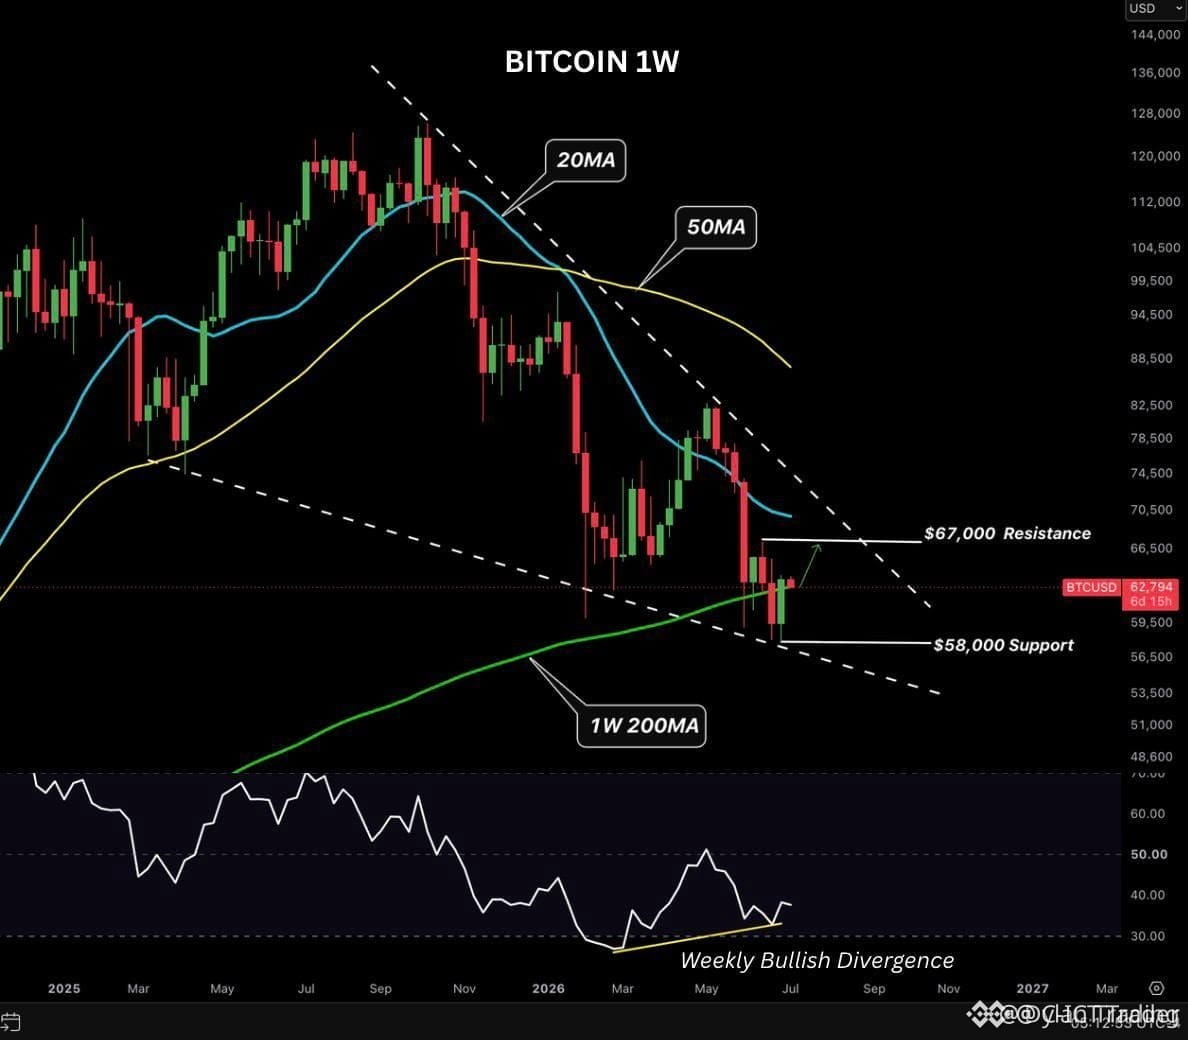
$BTC REBOUNDS 7% AND RECLAIMS 200-WEEK MA - BULLISH STRUCTURE EMERGING 🔥
Bitcoin’s bounce off the 200-week moving average is a textbook structural reclaim. Coupled with bullish RSI divergence on the weekly chart, this setup signals that sellers are losing control. The immediate support at $58K is holding, but the real test lies at $67K resistance.
Volume is picking up on the daily timeframe and the RSI is climbing from oversold territory—similar conditions preceded the move from $55K to $70K in February. Are you watching $67K as the trigger for a trend shift, or waiting for a deeper retest?
Not financial advice. Always manage your risk.
#BTC #BullishReversal #SupportResistance #WeeklyStructure #Crypto
🔥
$BTC REBOUNDS 7% AND RECLAIMS 200-WEEK MA - BULLISH STRUCTURE EMERGING 🔥
Bitcoin’s bounce off the 200-week moving average is a textbook structural reclaim. Coupled with bullish RSI divergence on the weekly chart, this setup signals that sellers are losing control. The immediate support at $58K is holding, but the real test lies at $67K resistance.
Volume is picking up on the daily timeframe and the RSI is climbing from oversold territory—similar conditions preceded the move from $55K to $70K in February. Are you watching $67K as the trigger for a trend shift, or waiting for a deeper retest?
Not financial advice. Always manage your risk.
#BTC #BullishReversal #SupportResistance #WeeklyStructure #Crypto
🔥
Bitcoin’s bounce off the 200-week moving average is a textbook structural reclaim. Coupled with bullish RSI divergence on the weekly chart, this setup signals that sellers are losing control. The immediate support at $58K is holding, but the real test lies at $67K resistance.
Volume is picking up on the daily timeframe and the RSI is climbing from oversold territory—similar conditions preceded the move from $55K to $70K in February. Are you watching $67K as the trigger for a trend shift, or waiting for a deeper retest?
Not financial advice. Always manage your risk.
#BTC #BullishReversal #SupportResistance #WeeklyStructure #Crypto
🔥
36

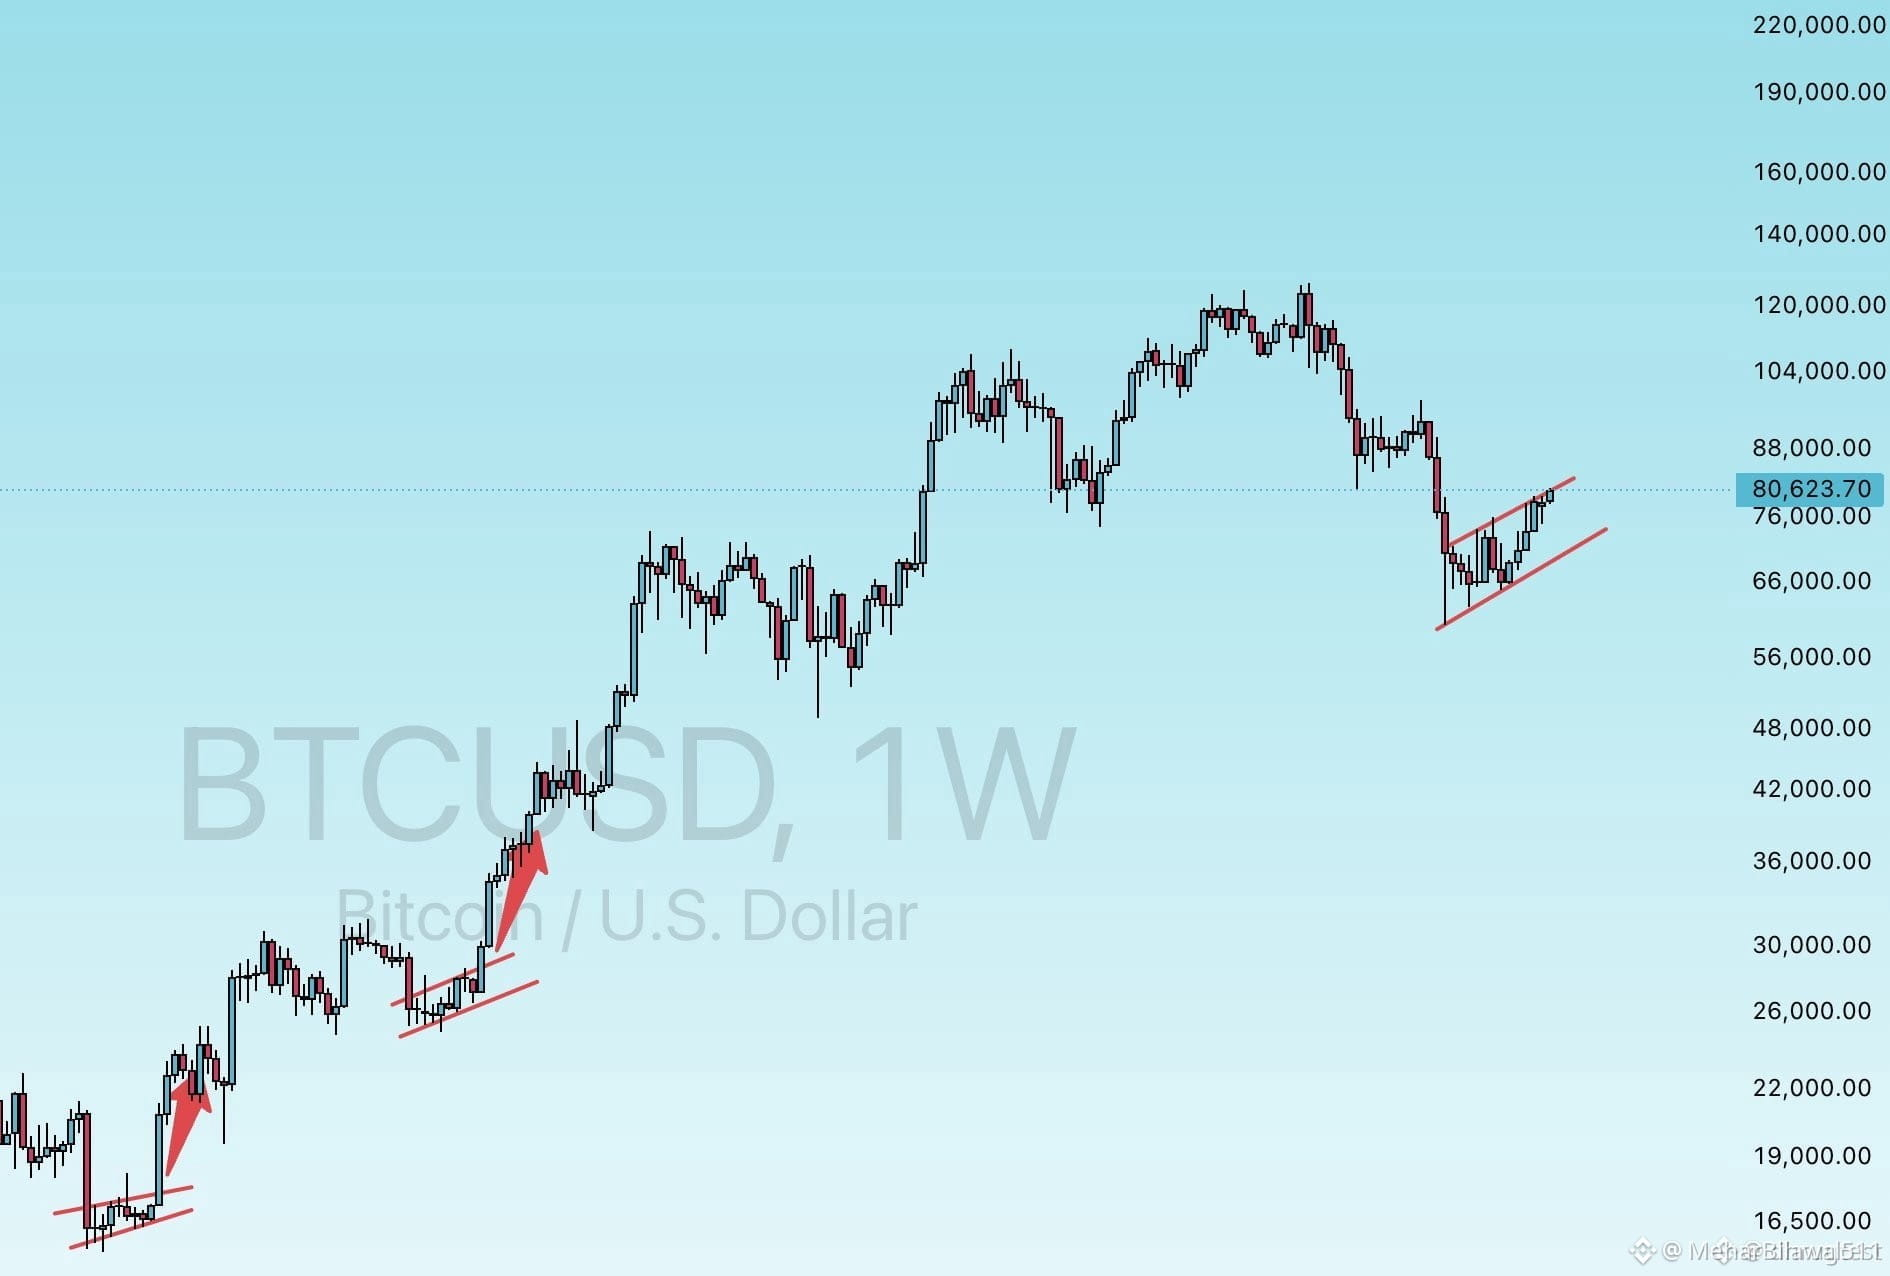
Here’s a professional, influencer-style short caption based on your weekly $BTC $USDC chart:
Patience isn’t empty — it’s accumulation.
Bitcoin holds above a key macro level, but weekly structure shows resistance overhead near 104K. Break and hold? Momentum returns. Fail here? We revisit lower demand. No chasing. Only confirmation.
Let the weekly candle close. Smart money respects time and price.
You don’t need to be early — just disciplined.
#Bitcoin #CryptoTrading #WeeklyStructure #SmartMoney #RiskManagement
Here’s a professional, influencer-style short caption based on your weekly $BTC $USDC chart:
Patience isn’t empty — it’s accumulation.
Bitcoin holds above a key macro level, but weekly structure shows resistance overhead near 104K. Break and hold? Momentum returns. Fail here? We revisit lower demand. No chasing. Only confirmation.
Let the weekly candle close. Smart money respects time and price.
You don’t need to be early — just disciplined.
#Bitcoin #CryptoTrading #WeeklyStructure #SmartMoney #RiskManagement
Patience isn’t empty — it’s accumulation.
Bitcoin holds above a key macro level, but weekly structure shows resistance overhead near 104K. Break and hold? Momentum returns. Fail here? We revisit lower demand. No chasing. Only confirmation.
Let the weekly candle close. Smart money respects time and price.
You don’t need to be early — just disciplined.
#Bitcoin #CryptoTrading #WeeklyStructure #SmartMoney #RiskManagement
37
·
--
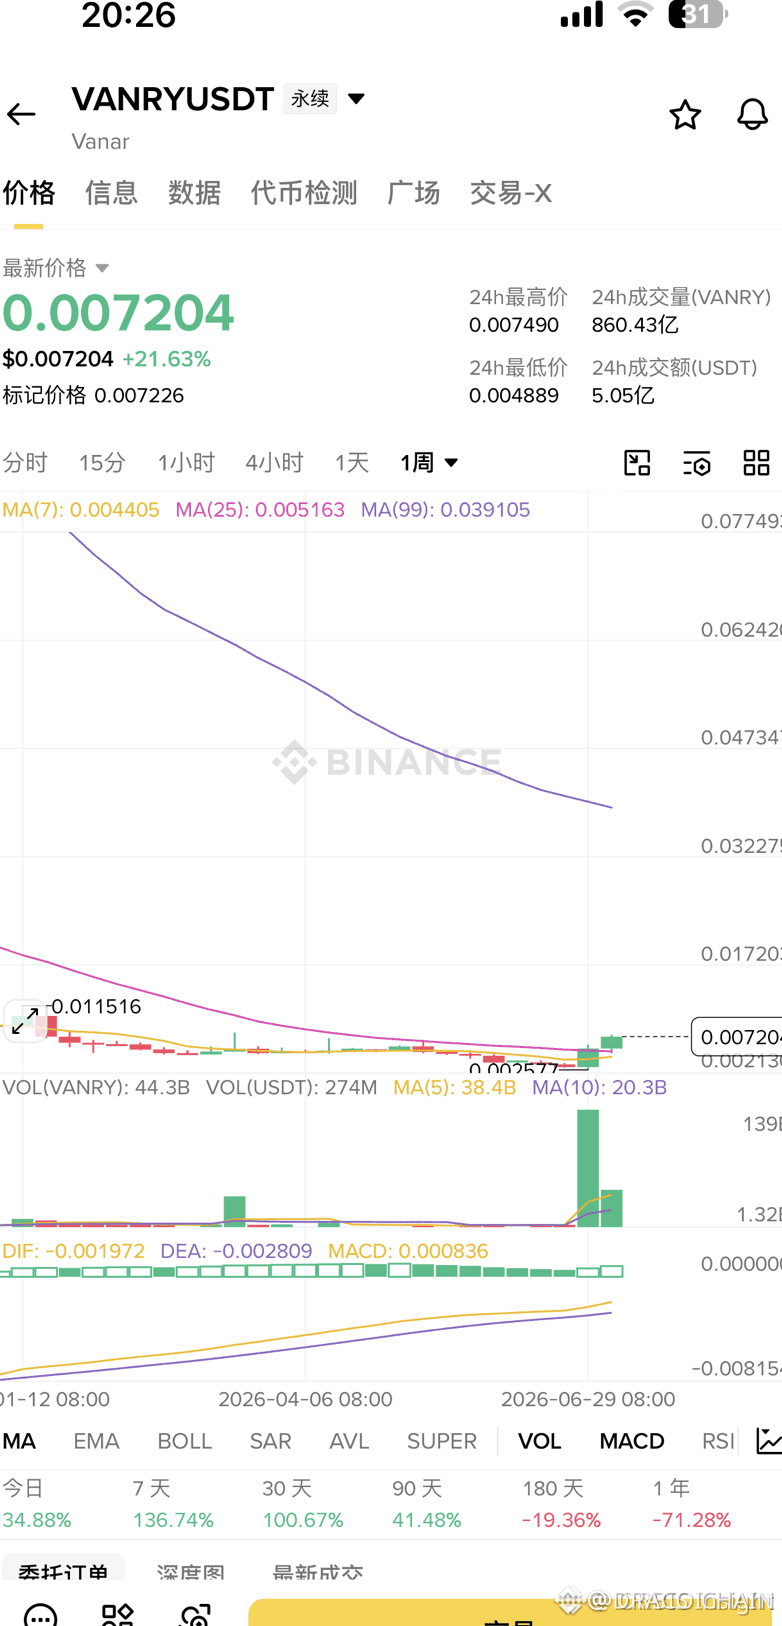
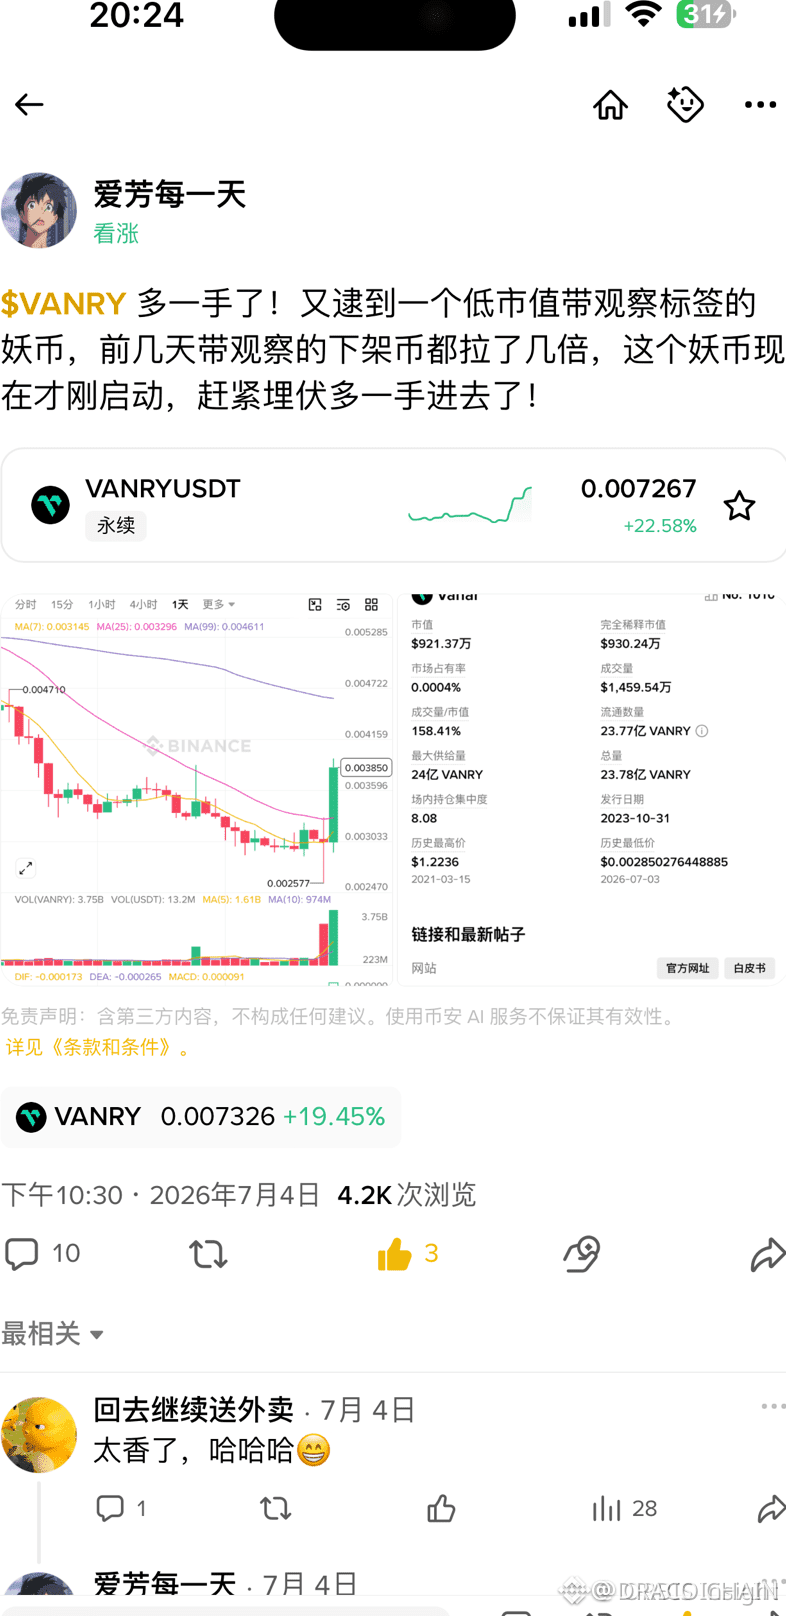
$VANRY BREAKS WEEKLY STRUCTURE WITH ROOM TO EXTEND 💎
The weekly chart shows a clean break above prior highs with increasing volume — small cap relative to sector peers leaves room for further expansion as liquidity builds overhead.
Momentum on the weekly timeframe mirrors previous expansion legs that saw 3x moves. Price is extended short-term, so a pullback to the breakout zone could offer a better risk entry.
Are you waiting for a retest or already positioned?
Not financial advice. Always manage your risk.
#VANRY #Breakout #WeeklyStructure #SmallCap #Crypto
💎
$VANRY BREAKS WEEKLY STRUCTURE WITH ROOM TO EXTEND 💎
The weekly chart shows a clean break above prior highs with increasing volume — small cap relative to sector peers leaves room for further expansion as liquidity builds overhead.
Momentum on the weekly timeframe mirrors previous expansion legs that saw 3x moves. Price is extended short-term, so a pullback to the breakout zone could offer a better risk entry.
Are you waiting for a retest or already positioned?
Not financial advice. Always manage your risk.
#VANRY #Breakout #WeeklyStructure #SmallCap #Crypto
💎
The weekly chart shows a clean break above prior highs with increasing volume — small cap relative to sector peers leaves room for further expansion as liquidity builds overhead.
Momentum on the weekly timeframe mirrors previous expansion legs that saw 3x moves. Price is extended short-term, so a pullback to the breakout zone could offer a better risk entry.
Are you waiting for a retest or already positioned?
Not financial advice. Always manage your risk.
#VANRY #Breakout #WeeklyStructure #SmallCap #Crypto
💎
115

·
--
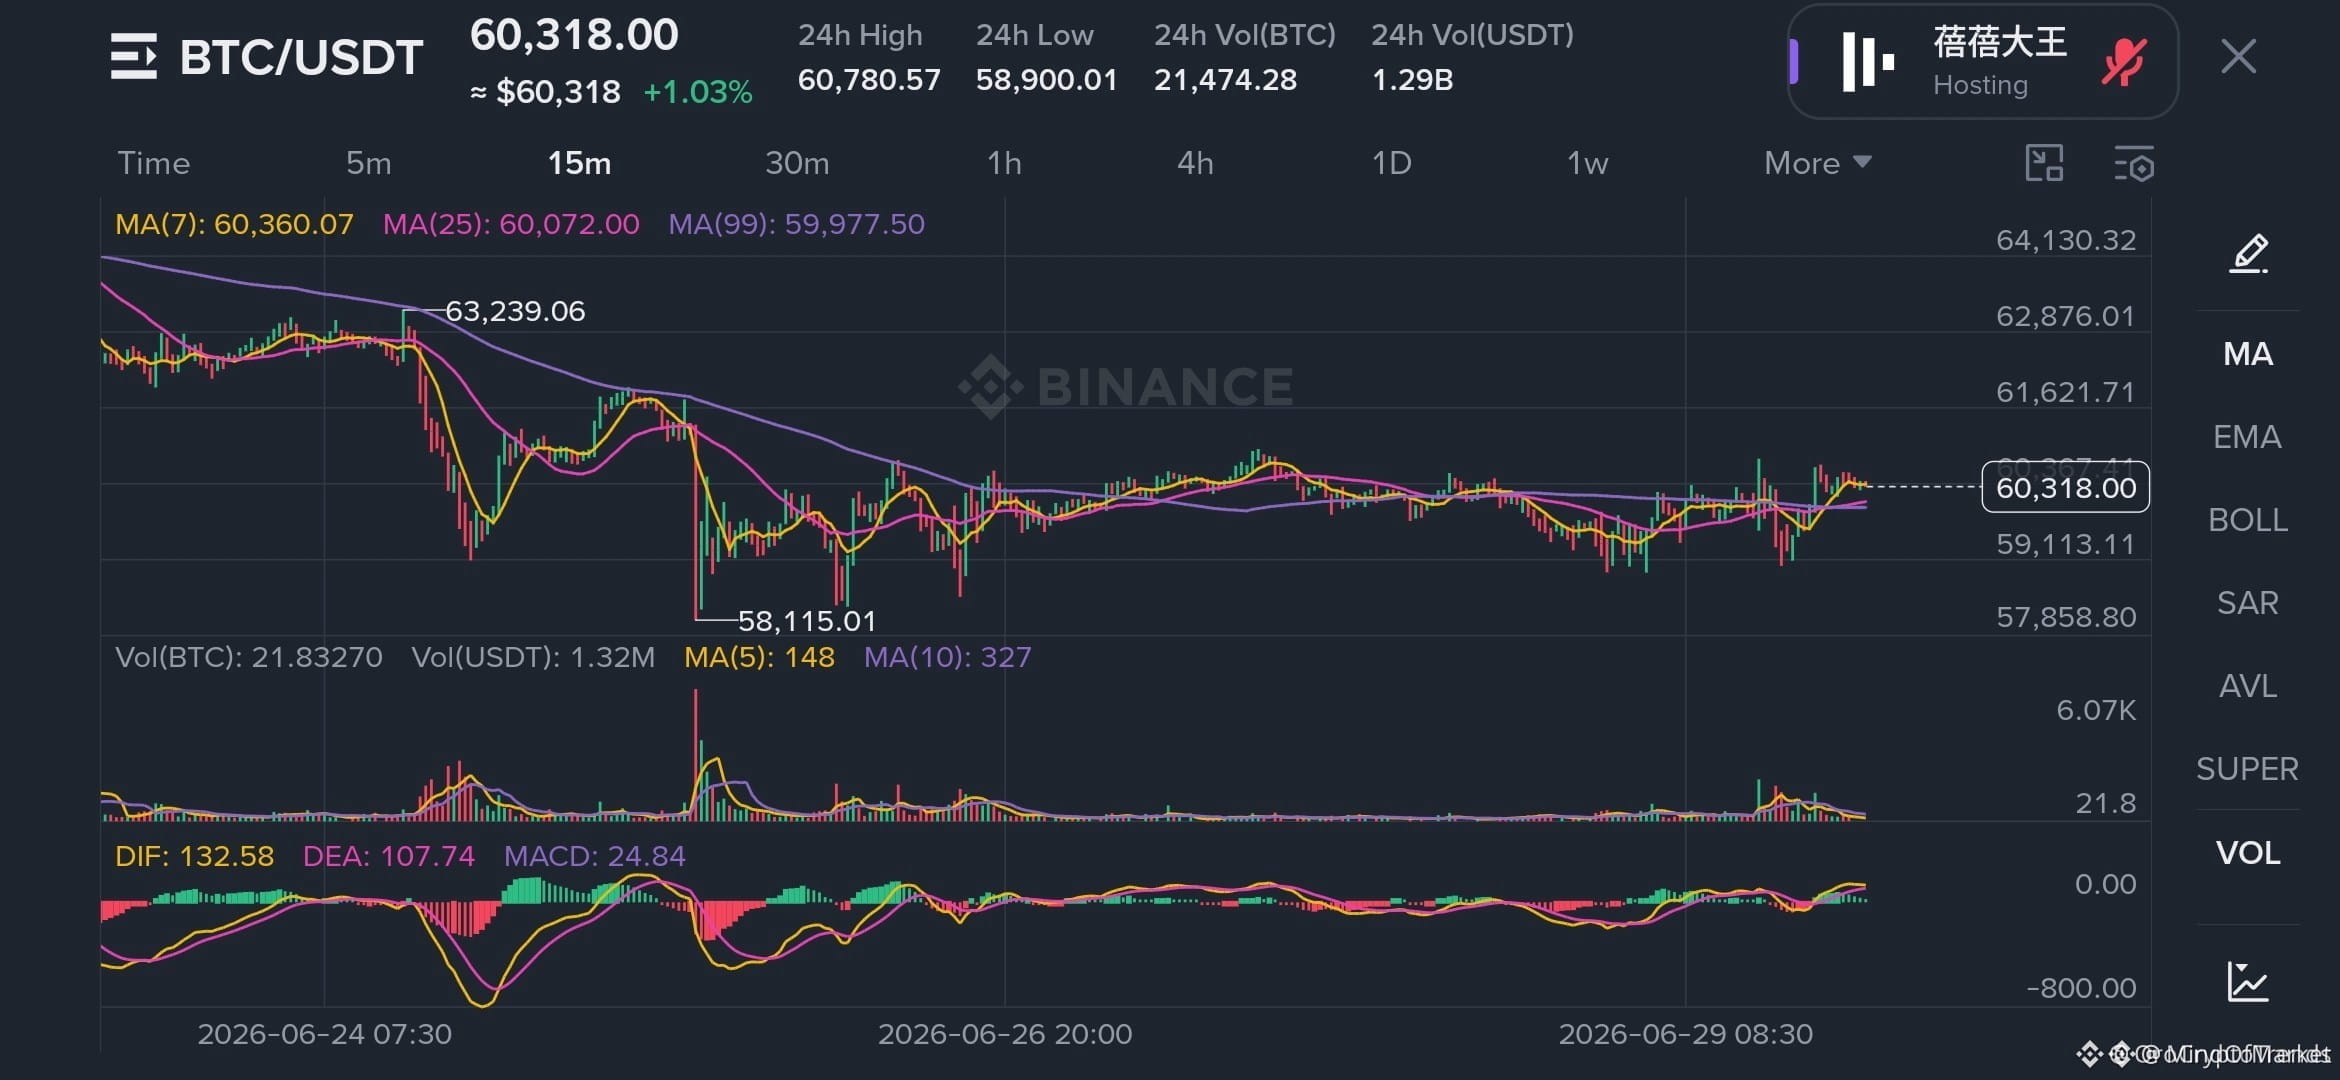
$BTC BOUNCE FROM $58K LOOKS PROMISING – BUT THE WEEKLY STRUCTURE SAYS OTHERWISE 💡
Price bounced from $58,115 twice and is now at $60,300. Short-term momentum is improving – 1H MAs are bunching, and the 4H MACD just crossed up.
But the weekly picture remains bearish. MA99 is still declining at $88,674, the weekly MACD is deeply negative, and we're well below all major weekly moving averages. This feels like a pause, not a pivot.
Is this bounce setting up a trap or a true reversal?
Not financial advice. Always manage your risk.
#BTC #Bitcoin #TechnicalAnalysis #WeeklyStructure #CryptoMarket
💡
$BTC BOUNCE FROM $58K LOOKS PROMISING – BUT THE WEEKLY STRUCTURE SAYS OTHERWISE 💡
Price bounced from $58,115 twice and is now at $60,300. Short-term momentum is improving – 1H MAs are bunching, and the 4H MACD just crossed up.
But the weekly picture remains bearish. MA99 is still declining at $88,674, the weekly MACD is deeply negative, and we're well below all major weekly moving averages. This feels like a pause, not a pivot.
Is this bounce setting up a trap or a true reversal?
Not financial advice. Always manage your risk.
#BTC #Bitcoin #TechnicalAnalysis #WeeklyStructure #CryptoMarket
💡
Price bounced from $58,115 twice and is now at $60,300. Short-term momentum is improving – 1H MAs are bunching, and the 4H MACD just crossed up.
But the weekly picture remains bearish. MA99 is still declining at $88,674, the weekly MACD is deeply negative, and we're well below all major weekly moving averages. This feels like a pause, not a pivot.
Is this bounce setting up a trap or a true reversal?
Not financial advice. Always manage your risk.
#BTC #Bitcoin #TechnicalAnalysis #WeeklyStructure #CryptoMarket
💡
28
ເຂົ້າສູ່ລະບົບເພື່ອສຳຫຼວດເນື້ອຫາເພີ່ມເຕີມ
ເຂົ້າຮ່ວມກຸ່ມຜູ້ໃຊ້ຄຣິບໂຕທົ່ວໂລກໃນ Binance Square.
⚡️ ໄດ້ຮັບຂໍ້ມູນຫຼ້າສຸດ ແລະ ທີ່ມີປະໂຫຍດກ່ຽວກັບຄຣິບໂຕ.
💬 ໄດ້ຮັບຄວາມໄວ້ວາງໃຈຈາກຕະຫຼາດແລກປ່ຽນຄຣິບໂຕທີ່ໃຫຍ່ທີ່ສຸດໃນໂລກ.
👍 ຄົ້ນຫາຂໍ້ມູນເຊີງເລິກທີ່ແທ້ຈາກນັກສ້າງທີ່ໄດ້ຮັບການຢືນຢັນ.
ອີເມວ / ເບີໂທລະສັບ
ຫົວຂໍ້ທີ່ກໍາລັງນິຍົມ
1
#BinanceReopensWithdrawalsForMoreAssets
805,115 ຄັ້ງທີ່ເບິ່ງ
4,484 ກຳລັງສົນທະນາ
2
#Binance98PercentReplenished
162,467 ຄັ້ງທີ່ເບິ່ງ
1,789 ກຳລັງສົນທະນາ
3
#USStocksSlipandCryptoMarketUnderBroadPressure
6,725 ຄັ້ງທີ່ເບິ່ງ
201 ກຳລັງສົນທະນາ
4
#StrategySTRCResumesIssuanceAfterOver170Days
18,171 ຄັ້ງທີ່ເບິ່ງ
393 ກຳລັງສົນທະນາ
5
#ADPUSPrivateEmployersAdd86000JobsInOctober
33,821 ຄັ້ງທີ່ເບິ່ງ
538 ກຳລັງສົນທະນາ
6
#KazakhstanReportedlyInvests$100MInCryptoFunds
1,868 ຄັ້ງທີ່ເບິ່ງ
51 ກຳລັງສົນທະນາ
7
#SouthKoreaSeeksCryptoTaxDelayUntil2029
20,104 ຄັ້ງທີ່ເບິ່ງ
245 ກຳລັງສົນທະນາ
8
#USMidterms-WhatAreMarketsExpecting?
605,991 ຄັ້ງທີ່ເບິ່ງ
2,893 ກຳລັງສົນທະນາ
9
#US10YearTreasuryYieldFallsTo4.845%
24,882 ຄັ້ງທີ່ເບິ່ງ
186 ກຳລັງສົນທະນາ
10
#ZcashExpectsNU7ToMake$16MSproutZECInaccessible
1,535 ຄັ້ງທີ່ເບິ່ງ
23 ກຳລັງສົນທະນາ