
#synusdc
synusdc
824 views
14 ກຳລັງສົນທະນາ
ມາແຮງ
ຫຼ້າສຸດ

·
--
ເບິ່ງການແປ
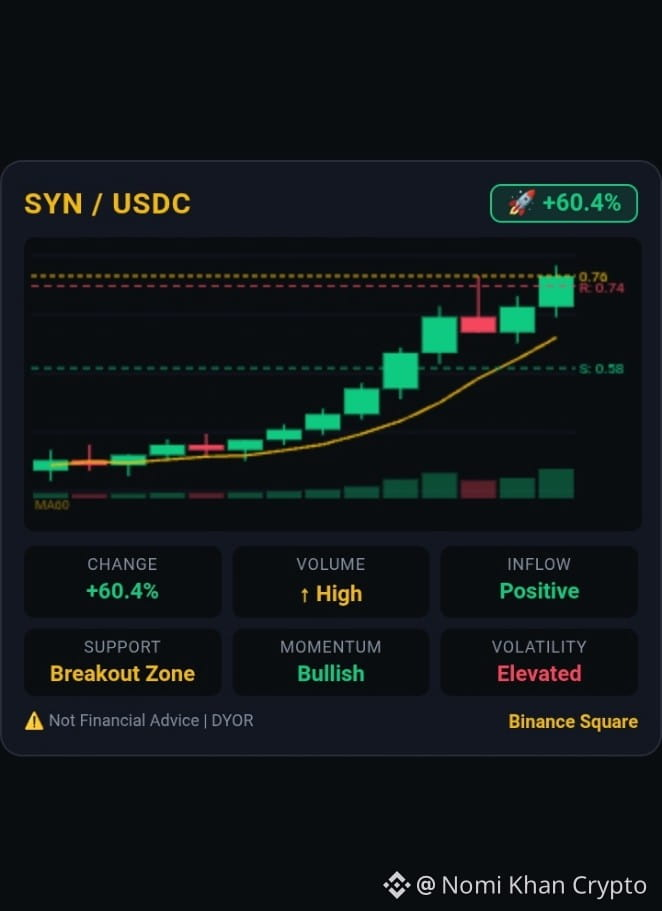
SYN/USDC — +60.4% SURGE!
💥 Strong momentum, volume expanding & capital flowing in fast!
📊 What's happening:
📈 Price: +60.4% 🔥
📦 Volume: Accelerating
💰 Capital Inflow: Positive
🎯 Watch for continuation above recent highs — pullbacks may form new support near breakout zone.
$SYN
{spot}(SYNUSDT)
⚡ Bullish momentum is strong, but volatility is elevated — manage your risk!
#SYN #SYNUSDC #SpaceXPremarketFalls4.6% #IranCutsCrudePrices
SYN/USDC — +60.4% SURGE!
💥 Strong momentum, volume expanding & capital flowing in fast!
📊 What's happening:
📈 Price: +60.4% 🔥
📦 Volume: Accelerating
💰 Capital Inflow: Positive
🎯 Watch for continuation above recent highs — pullbacks may form new support near breakout zone.
$SYN
⚡ Bullish momentum is strong, but volatility is elevated — manage your risk!
#SYN #SYNUSDC #SpaceXPremarketFalls4.6% #IranCutsCrudePrices
💥 Strong momentum, volume expanding & capital flowing in fast!
📊 What's happening:
📈 Price: +60.4% 🔥
📦 Volume: Accelerating
💰 Capital Inflow: Positive
🎯 Watch for continuation above recent highs — pullbacks may form new support near breakout zone.
$SYN
⚡ Bullish momentum is strong, but volatility is elevated — manage your risk!
#SYN #SYNUSDC #SpaceXPremarketFalls4.6% #IranCutsCrudePrices
84

·
--
ສັນຍານກະທິງ
$SYN
{future}(SYNUSDT)
#SYNUSDC Ukukusukela ngomhlaka 18 kuJulayi, 2026, intengo ye-Synapse (SYN) cishe ingu-$0.18, okubonisa ukwehla okungaphezu kuka-20% emahoreni angu-24 adlule.
Inani lemali yemakethe lamanje le-SYN cishe lingama-$41.3 million USD, kanti ivolumu yokuhweba yamahora angu-24 ingaba ngu-$23.9 million USD.
I-Synapse iyi-protocol eyenziwe ngendlela yokuqondanisa (decentralized) eyenzelwe ukusiza ukuxhumana nokudluliswa kwempahla kuwo wonke amanethiwekhi ahlukene e-blockchain.
I-Synapse (SYN/USDC) ihweba esigabeni sokuhlanganisa (consolidation), ngokumelana kwayo okuseduze $0.22 - $0.23. Uma iphumelela ukuphuka ngaphezu kwalezi zinga ngenani eliphakeme lokuhweba, ingavula indlela yokunyakaza okuqondile (bullish) kwesikhashana kuya ku-$0.26 - $0.28, kanti ukusekelwa kakhulu kuncike emugqeni wokusekela ongaphansi ($0.19 floor).
Amazinga Obuchwepheshe Okwamanje
Intengo Yamanje: ~ $0.19 - $0.225
Ukumelana Okusheshayo (Targets): $0.23 kulandele u-$0.26
Ukusekela Okubalulekile: $0.
Umkhawulo Wonyaka (2-Week Range): $0.03 - $0.71
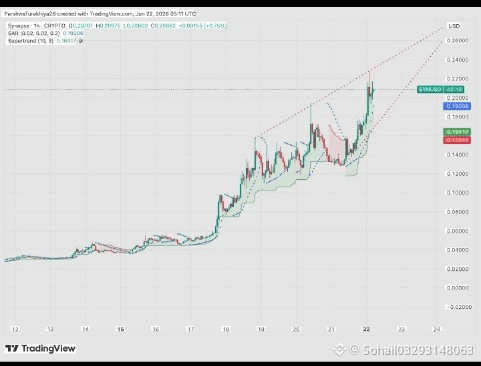
Ukuqonda ImaketheSYN/USDC kubone amandla obuchwepheshe ahlukene muva nje, abonakala ngokuguquguquka okukhulu emahoreni angu-7 edlule. Abahwebi bagxile ngokusondele kuma-moving averages kanye namaphethini e-falling wedge, bebona ukuthi uma kuqala ukuphenduka, ithokheni ngokomlando ivamise ukufuna amazinga aphezulu esikhathi esifushane.
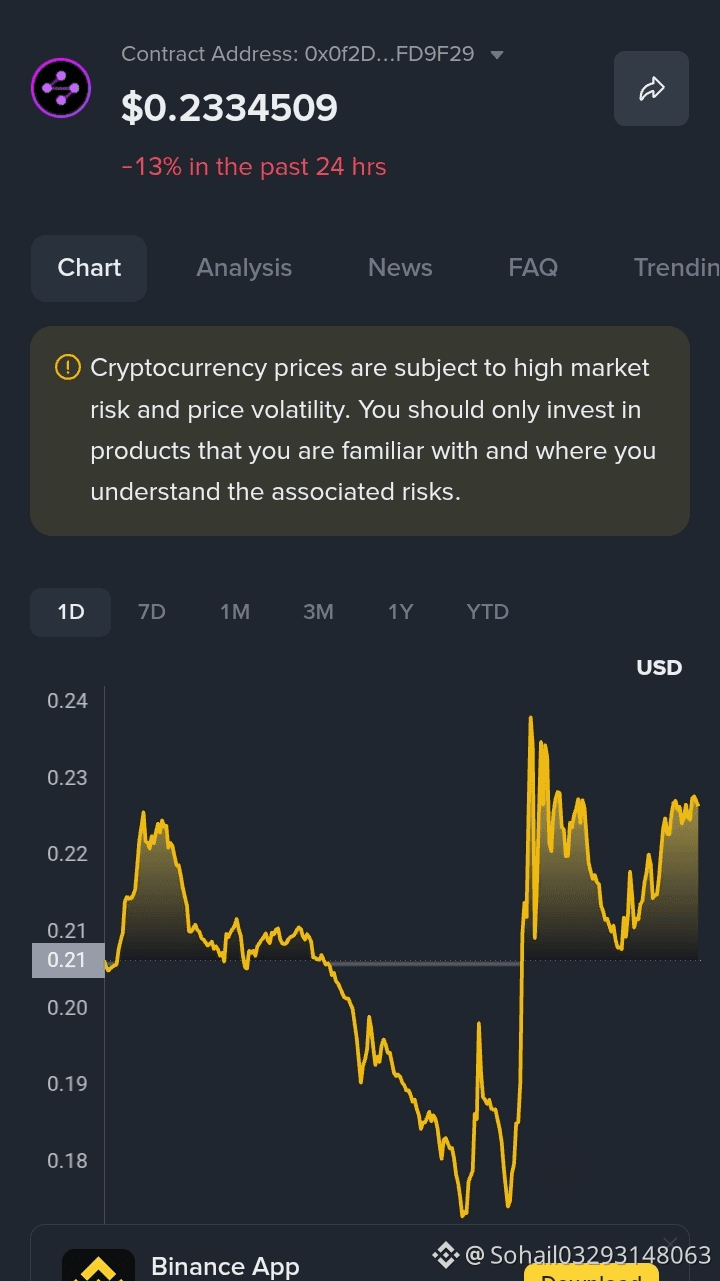
👇Isithombe sibonisa igrafu ye-1-hour hourly chart ye-Synapse (SYN/USD).Ibonisa ukuthambekela okuya phezulu okuqale cishe ngomhlaka 18 Juni, 2026, okubonakala ngesakhiwo esiyi-parabolic kanye nokunyuka ngezitebhisi ngaphakathi kwesiteshi esikhuphukayo. Izinkomba ezibalulekile zobuchwepheshe zinobudlova: i-SAR iku-$0.1910 kanti i-Supertrend iku-$0.1642, zombili zitholakala ngaphansi kwentengo yamanje. Igrafu ikhombisa amazinga okuphikisa aseduze no-$0.22 kuya ku-$0.2278 kanye namazinga okusekela aseduze no-$0.1727 no-$0.1552.
#NikkeiFalls5%WorstSinceMarch
#IraqSyriaSignPipelineDealBypassingHormuz
#SpaceXClosesBelowIPOPrice
#MoonshotKimiK3SparksChipSelloff
$SYN
#SYNUSDC Ukukusukela ngomhlaka 18 kuJulayi, 2026, intengo ye-Synapse (SYN) cishe ingu-$0.18, okubonisa ukwehla okungaphezu kuka-20% emahoreni angu-24 adlule.
Inani lemali yemakethe lamanje le-SYN cishe lingama-$41.3 million USD, kanti ivolumu yokuhweba yamahora angu-24 ingaba ngu-$23.9 million USD.
I-Synapse iyi-protocol eyenziwe ngendlela yokuqondanisa (decentralized) eyenzelwe ukusiza ukuxhumana nokudluliswa kwempahla kuwo wonke amanethiwekhi ahlukene e-blockchain.
I-Synapse (SYN/USDC) ihweba esigabeni sokuhlanganisa (consolidation), ngokumelana kwayo okuseduze $0.22 - $0.23. Uma iphumelela ukuphuka ngaphezu kwalezi zinga ngenani eliphakeme lokuhweba, ingavula indlela yokunyakaza okuqondile (bullish) kwesikhashana kuya ku-$0.26 - $0.28, kanti ukusekelwa kakhulu kuncike emugqeni wokusekela ongaphansi ($0.19 floor).
Amazinga Obuchwepheshe Okwamanje
Intengo Yamanje: ~ $0.19 - $0.225
Ukumelana Okusheshayo (Targets): $0.23 kulandele u-$0.26
Ukusekela Okubalulekile: $0.
Umkhawulo Wonyaka (2-Week Range): $0.03 - $0.71
Ukuqonda ImaketheSYN/USDC kubone amandla obuchwepheshe ahlukene muva nje, abonakala ngokuguquguquka okukhulu emahoreni angu-7 edlule. Abahwebi bagxile ngokusondele kuma-moving averages kanye namaphethini e-falling wedge, bebona ukuthi uma kuqala ukuphenduka, ithokheni ngokomlando ivamise ukufuna amazinga aphezulu esikhathi esifushane.
👇Isithombe sibonisa igrafu ye-1-hour hourly chart ye-Synapse (SYN/USD).Ibonisa ukuthambekela okuya phezulu okuqale cishe ngomhlaka 18 Juni, 2026, okubonakala ngesakhiwo esiyi-parabolic kanye nokunyuka ngezitebhisi ngaphakathi kwesiteshi esikhuphukayo. Izinkomba ezibalulekile zobuchwepheshe zinobudlova: i-SAR iku-$0.1910 kanti i-Supertrend iku-$0.1642, zombili zitholakala ngaphansi kwentengo yamanje. Igrafu ikhombisa amazinga okuphikisa aseduze no-$0.22 kuya ku-$0.2278 kanye namazinga okusekela aseduze no-$0.1727 no-$0.1552.
#NikkeiFalls5%WorstSinceMarch
#IraqSyriaSignPipelineDealBypassingHormuz
#SpaceXClosesBelowIPOPrice
#MoonshotKimiK3SparksChipSelloff
#SYNUSDC Ukukusukela ngomhlaka 18 kuJulayi, 2026, intengo ye-Synapse (SYN) cishe ingu-$0.18, okubonisa ukwehla okungaphezu kuka-20% emahoreni angu-24 adlule.
Inani lemali yemakethe lamanje le-SYN cishe lingama-$41.3 million USD, kanti ivolumu yokuhweba yamahora angu-24 ingaba ngu-$23.9 million USD.
I-Synapse iyi-protocol eyenziwe ngendlela yokuqondanisa (decentralized) eyenzelwe ukusiza ukuxhumana nokudluliswa kwempahla kuwo wonke amanethiwekhi ahlukene e-blockchain.
I-Synapse (SYN/USDC) ihweba esigabeni sokuhlanganisa (consolidation), ngokumelana kwayo okuseduze $0.22 - $0.23. Uma iphumelela ukuphuka ngaphezu kwalezi zinga ngenani eliphakeme lokuhweba, ingavula indlela yokunyakaza okuqondile (bullish) kwesikhashana kuya ku-$0.26 - $0.28, kanti ukusekelwa kakhulu kuncike emugqeni wokusekela ongaphansi ($0.19 floor).
Amazinga Obuchwepheshe Okwamanje
Intengo Yamanje: ~ $0.19 - $0.225
Ukumelana Okusheshayo (Targets): $0.23 kulandele u-$0.26
Ukusekela Okubalulekile: $0.
Umkhawulo Wonyaka (2-Week Range): $0.03 - $0.71
Ukuqonda ImaketheSYN/USDC kubone amandla obuchwepheshe ahlukene muva nje, abonakala ngokuguquguquka okukhulu emahoreni angu-7 edlule. Abahwebi bagxile ngokusondele kuma-moving averages kanye namaphethini e-falling wedge, bebona ukuthi uma kuqala ukuphenduka, ithokheni ngokomlando ivamise ukufuna amazinga aphezulu esikhathi esifushane.
👇Isithombe sibonisa igrafu ye-1-hour hourly chart ye-Synapse (SYN/USD).Ibonisa ukuthambekela okuya phezulu okuqale cishe ngomhlaka 18 Juni, 2026, okubonakala ngesakhiwo esiyi-parabolic kanye nokunyuka ngezitebhisi ngaphakathi kwesiteshi esikhuphukayo. Izinkomba ezibalulekile zobuchwepheshe zinobudlova: i-SAR iku-$0.1910 kanti i-Supertrend iku-$0.1642, zombili zitholakala ngaphansi kwentengo yamanje. Igrafu ikhombisa amazinga okuphikisa aseduze no-$0.22 kuya ku-$0.2278 kanye namazinga okusekela aseduze no-$0.1727 no-$0.1552.
#NikkeiFalls5%WorstSinceMarch
#IraqSyriaSignPipelineDealBypassingHormuz
#SpaceXClosesBelowIPOPrice
#MoonshotKimiK3SparksChipSelloff
1
119

·
--
ສັນຍານກະທິງ
ເບິ່ງການແປ
$NVDAB SYN/USDC | Market Update - 23 Jun 2026*
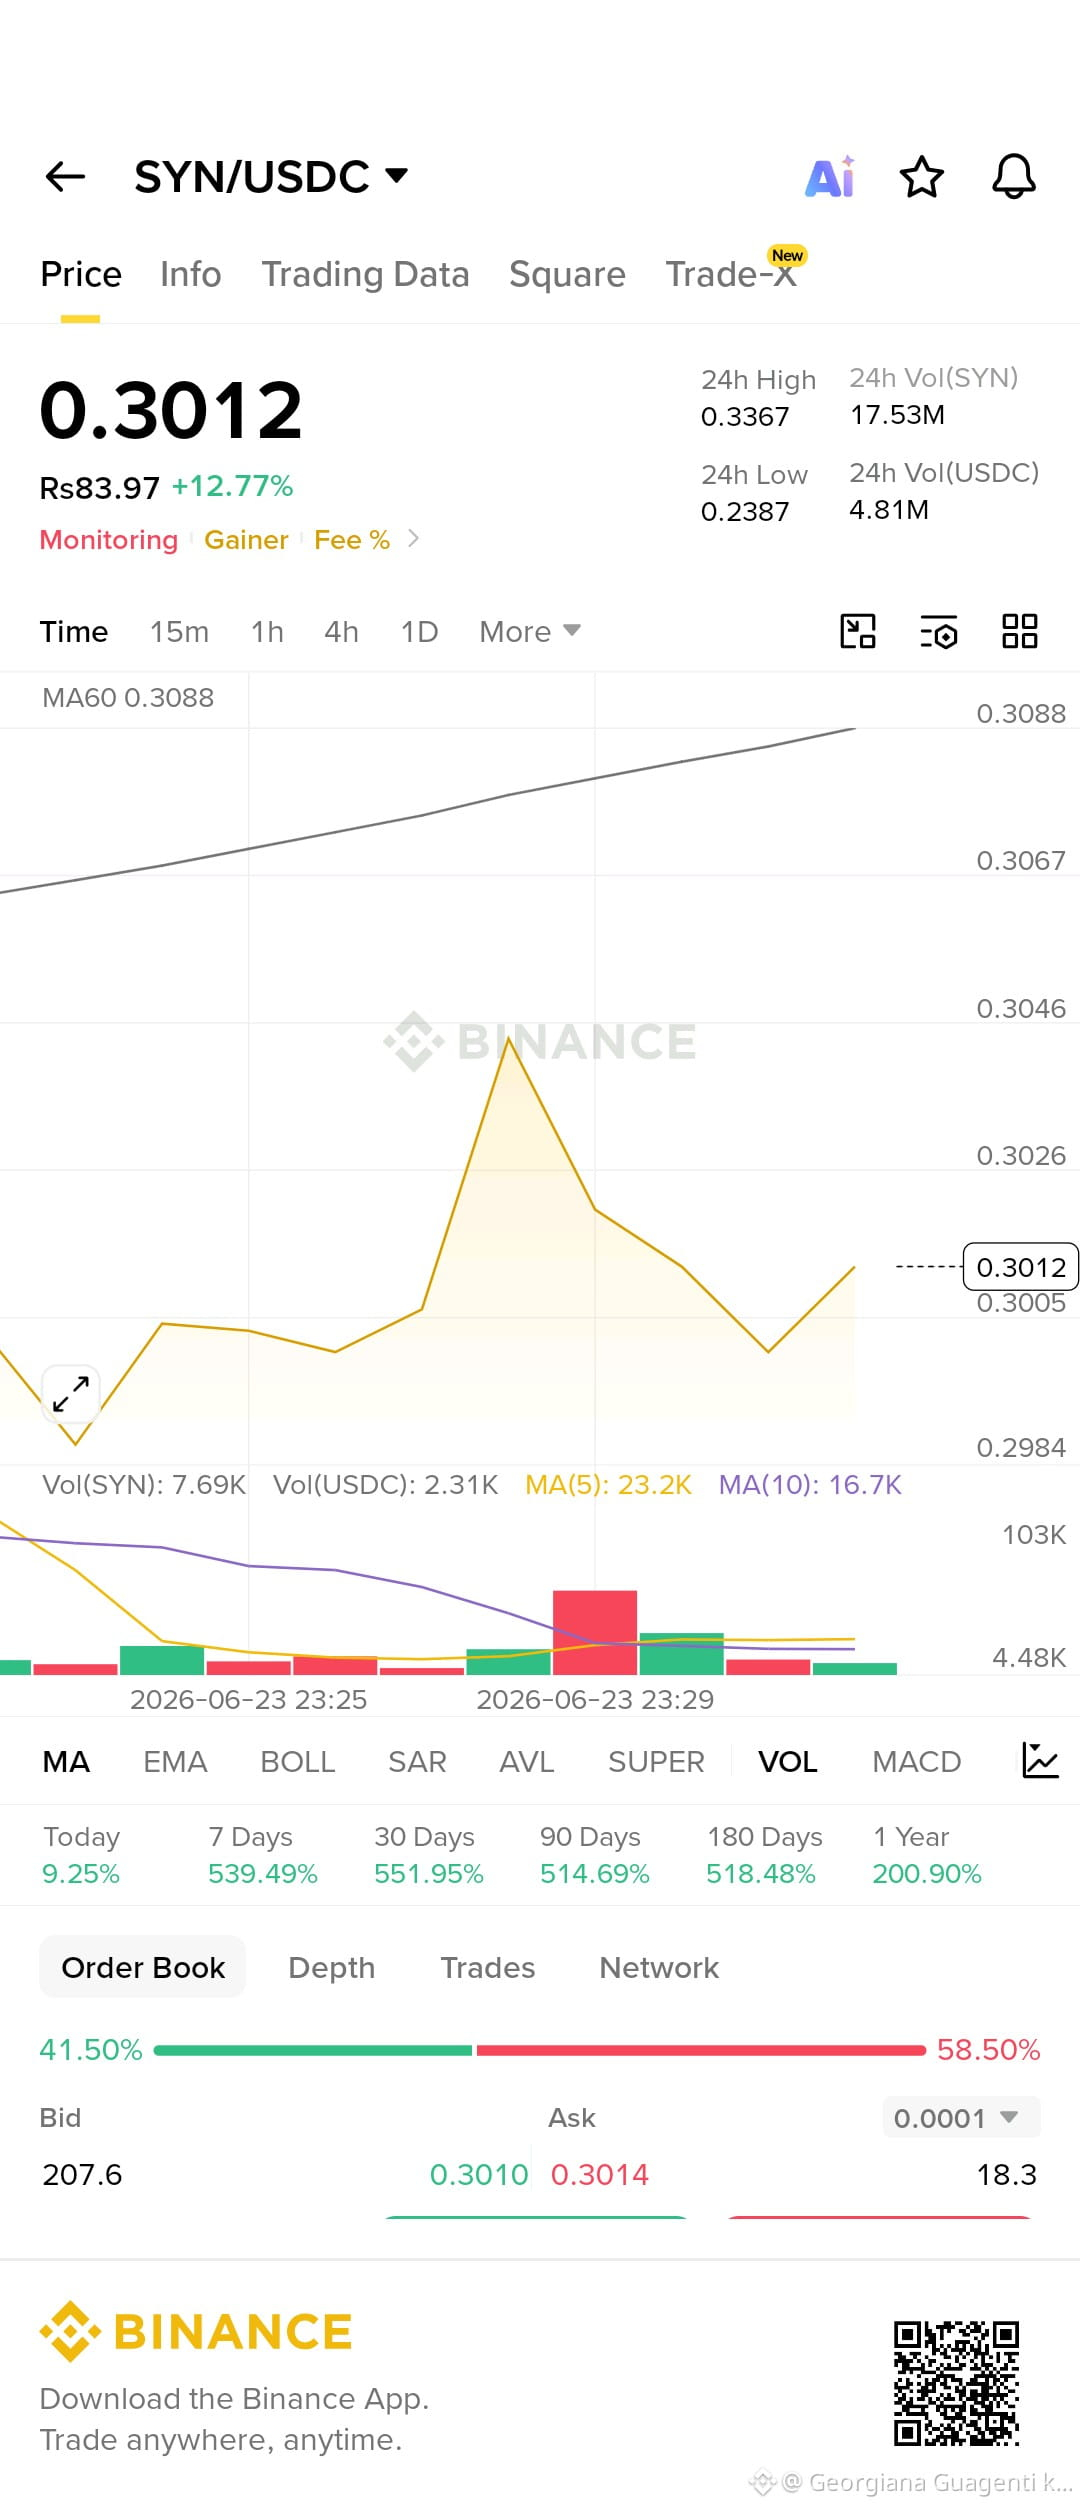
*Current Price*: $0.3012 (+12.77% 24h)
*24h Range*: $0.2387 - $0.3367
*24h Volume*: 4.81M USDC
*Market Trend*: Bullish / Below MA60 Retest
SYN rallied +12.77% from $0.2387 low but is stalling under MA60 at $0.3088. Price at $0.3012 is testing the 60MA from below after tapping $0.3367 high. Structure improves above $0.3000, but trend flips only on MA60 break.
*Key Levels*
*Support*: $0.3005 - $0.2984. Current base + demand zone. Hold this = bullish structure stays intact.
*Resistance*: $0.3088 - $0.3367. Rising MA60 + 24h high supply. Flip $0.3088 = bullish continuation toward $0.34+.
*Trader Insight*
SYN just ran "sweep → pump → MA60 test" price action. Bottomed at $0.2387 → spiked to $0.3367 → now consolidating under MA60 $0.3088. Order book shows 41.50% bids vs 58.50% asks = sellers pressing the MA. SYN needs a 4h close above $0.3088 to confirm trend flip. Reject there = pullback to $0.298. With +551% 30-day move, volatility is extreme. Trade confirmation, not anticipation.
Not financial advice. Structure > FOMO.
#SYN #SYNUSDC #Altcoins #MA60
$NVDAB SYN/USDC | Market Update - 23 Jun 2026*
*Current Price*: $0.3012 (+12.77% 24h)
*24h Range*: $0.2387 - $0.3367
*24h Volume*: 4.81M USDC
*Market Trend*: Bullish / Below MA60 Retest
SYN rallied +12.77% from $0.2387 low but is stalling under MA60 at $0.3088. Price at $0.3012 is testing the 60MA from below after tapping $0.3367 high. Structure improves above $0.3000, but trend flips only on MA60 break.
*Key Levels*
*Support*: $0.3005 - $0.2984. Current base + demand zone. Hold this = bullish structure stays intact.
*Resistance*: $0.3088 - $0.3367. Rising MA60 + 24h high supply. Flip $0.3088 = bullish continuation toward $0.34+.
*Trader Insight*
SYN just ran "sweep → pump → MA60 test" price action. Bottomed at $0.2387 → spiked to $0.3367 → now consolidating under MA60 $0.3088. Order book shows 41.50% bids vs 58.50% asks = sellers pressing the MA. SYN needs a 4h close above $0.3088 to confirm trend flip. Reject there = pullback to $0.298. With +551% 30-day move, volatility is extreme. Trade confirmation, not anticipation.
Not financial advice. Structure > FOMO.
#SYN #SYNUSDC #Altcoins #MA60
*Current Price*: $0.3012 (+12.77% 24h)
*24h Range*: $0.2387 - $0.3367
*24h Volume*: 4.81M USDC
*Market Trend*: Bullish / Below MA60 Retest
SYN rallied +12.77% from $0.2387 low but is stalling under MA60 at $0.3088. Price at $0.3012 is testing the 60MA from below after tapping $0.3367 high. Structure improves above $0.3000, but trend flips only on MA60 break.
*Key Levels*
*Support*: $0.3005 - $0.2984. Current base + demand zone. Hold this = bullish structure stays intact.
*Resistance*: $0.3088 - $0.3367. Rising MA60 + 24h high supply. Flip $0.3088 = bullish continuation toward $0.34+.
*Trader Insight*
SYN just ran "sweep → pump → MA60 test" price action. Bottomed at $0.2387 → spiked to $0.3367 → now consolidating under MA60 $0.3088. Order book shows 41.50% bids vs 58.50% asks = sellers pressing the MA. SYN needs a 4h close above $0.3088 to confirm trend flip. Reject there = pullback to $0.298. With +551% 30-day move, volatility is extreme. Trade confirmation, not anticipation.
Not financial advice. Structure > FOMO.
#SYN #SYNUSDC #Altcoins #MA60
141
ເບິ່ງການແປ
$SYN
{future}(SYNUSDT)
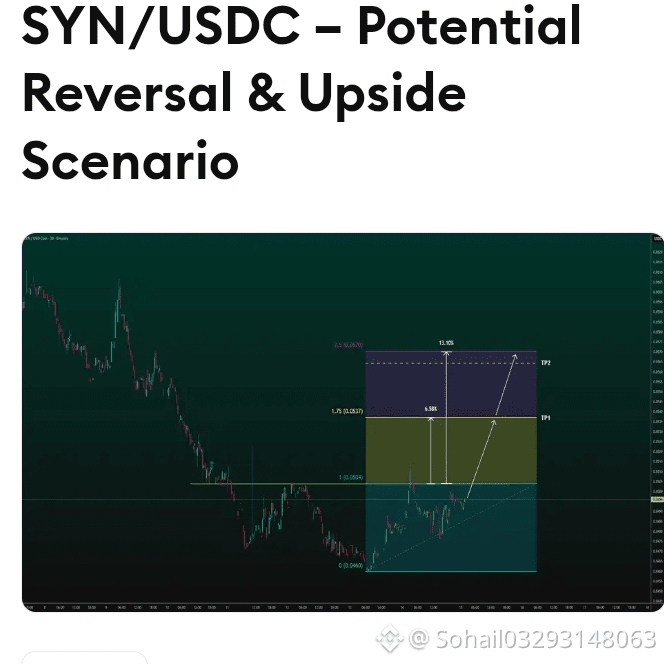
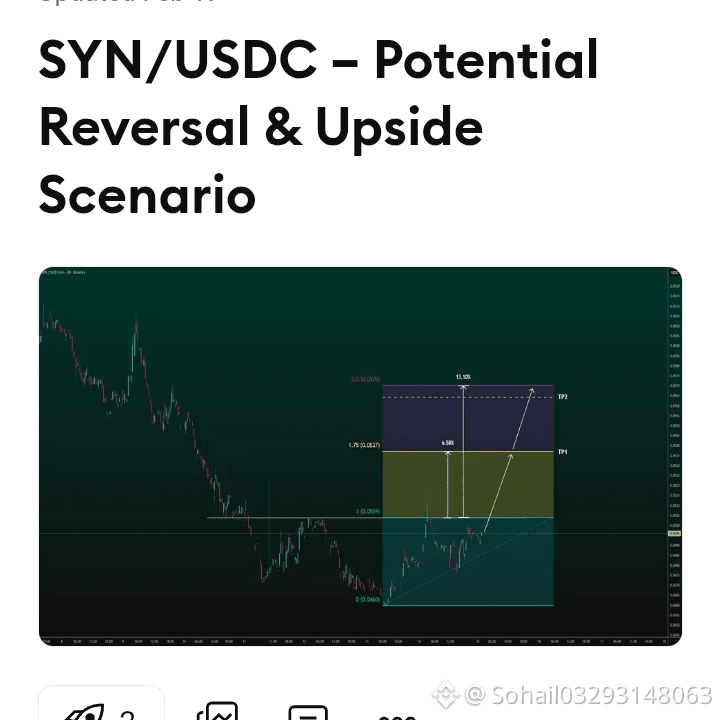
#SYNUSDC Price is forming a possible base after a downtrend, with signs of a short-term reversal. A continuation to the upside may follow if momentum holds, with projected targets at nearby resistance areas and invalidation below recent lows.
Trade active
TP1 reached at 0.0537, waiting for TP2, stop loss moved to brake even (0.0504).
#USOrdersAnthropicSuspendForeignNationalAccess
#PakistanSaysUSIranDealMayFinalize
#PakistanSaysUSIranPeaceDealTextFinalized
#SpaceXS1Discloses18712BitcoinHoldings
$SYN
#SYNUSDC Price is forming a possible base after a downtrend, with signs of a short-term reversal. A continuation to the upside may follow if momentum holds, with projected targets at nearby resistance areas and invalidation below recent lows.
Trade active
TP1 reached at 0.0537, waiting for TP2, stop loss moved to brake even (0.0504).
#USOrdersAnthropicSuspendForeignNationalAccess
#PakistanSaysUSIranDealMayFinalize
#PakistanSaysUSIranPeaceDealTextFinalized
#SpaceXS1Discloses18712BitcoinHoldings
#SYNUSDC Price is forming a possible base after a downtrend, with signs of a short-term reversal. A continuation to the upside may follow if momentum holds, with projected targets at nearby resistance areas and invalidation below recent lows.
Trade active
TP1 reached at 0.0537, waiting for TP2, stop loss moved to brake even (0.0504).
#USOrdersAnthropicSuspendForeignNationalAccess
#PakistanSaysUSIranDealMayFinalize
#PakistanSaysUSIranPeaceDealTextFinalized
#SpaceXS1Discloses18712BitcoinHoldings
1
53
ເບິ່ງການແປ
$SYN
{future}(SYNUSDT)
#SYNUSDC
Price is forming a possible base after a downtrend, with signs of a short-term reversal. A continuation to the upside may follow if momentum holds, with projected targets at nearby resistance areas and invalidation below recent lows.
Trade active
TP1 reached at 0.0537, waiting for TP2, stop loss moved to brake even (0.0504)
#MorganStanleyToLaunchEthSolETFsAt0.14%
#BankOfEnglandSoftensStablecoinRules
#BinanceToOpenXLMSpotTrading
#OilRebounds3%
$SYN
#SYNUSDC
Price is forming a possible base after a downtrend, with signs of a short-term reversal. A continuation to the upside may follow if momentum holds, with projected targets at nearby resistance areas and invalidation below recent lows.
Trade active
TP1 reached at 0.0537, waiting for TP2, stop loss moved to brake even (0.0504)
#MorganStanleyToLaunchEthSolETFsAt0.14%
#BankOfEnglandSoftensStablecoinRules
#BinanceToOpenXLMSpotTrading
#OilRebounds3%
#SYNUSDC
Price is forming a possible base after a downtrend, with signs of a short-term reversal. A continuation to the upside may follow if momentum holds, with projected targets at nearby resistance areas and invalidation below recent lows.
Trade active
TP1 reached at 0.0537, waiting for TP2, stop loss moved to brake even (0.0504)
#MorganStanleyToLaunchEthSolETFsAt0.14%
#BankOfEnglandSoftensStablecoinRules
#BinanceToOpenXLMSpotTrading
#OilRebounds3%
1
191
·
--
ສັນຍານກະທິງ
ເບິ່ງການແປ
$SYN
{future}(SYNUSDT)
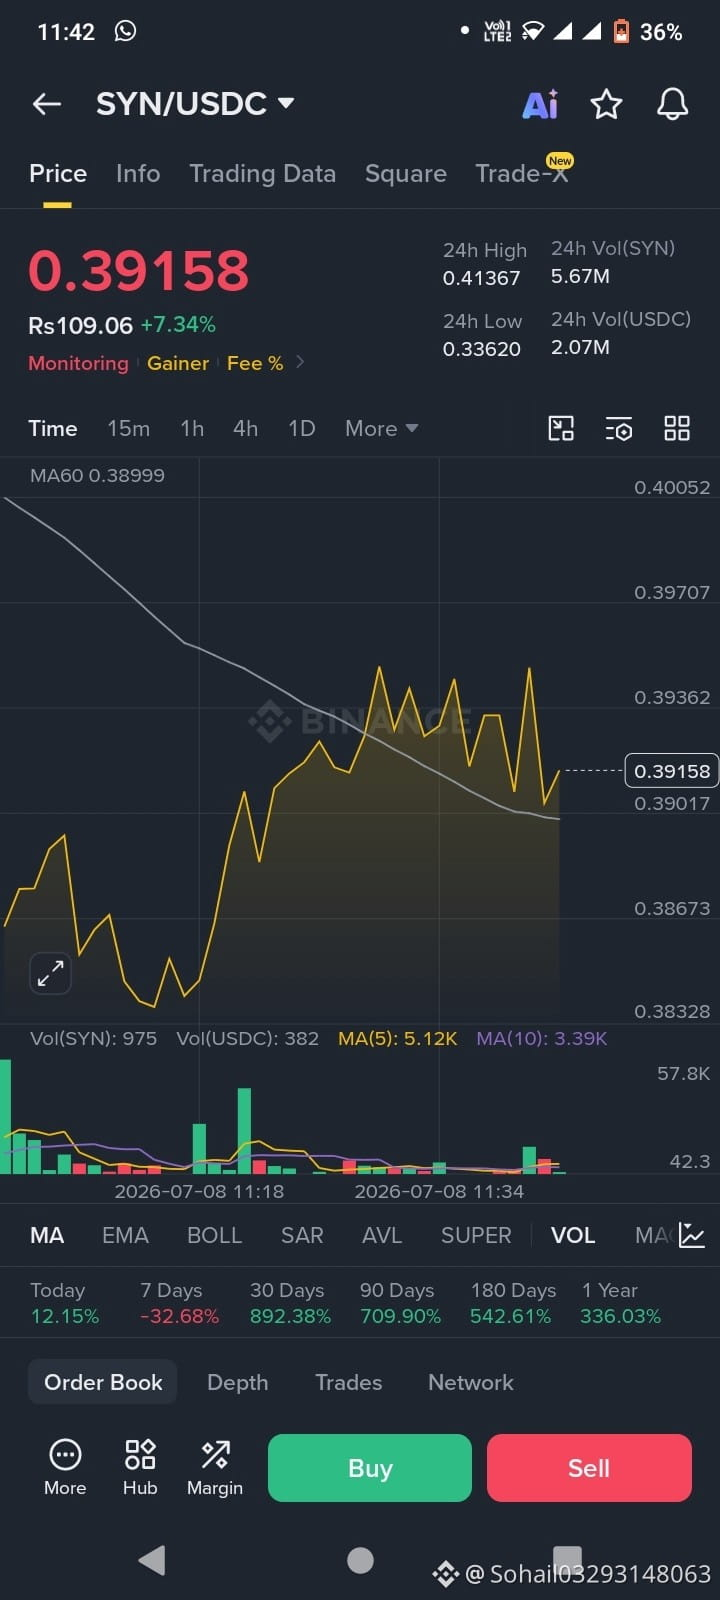
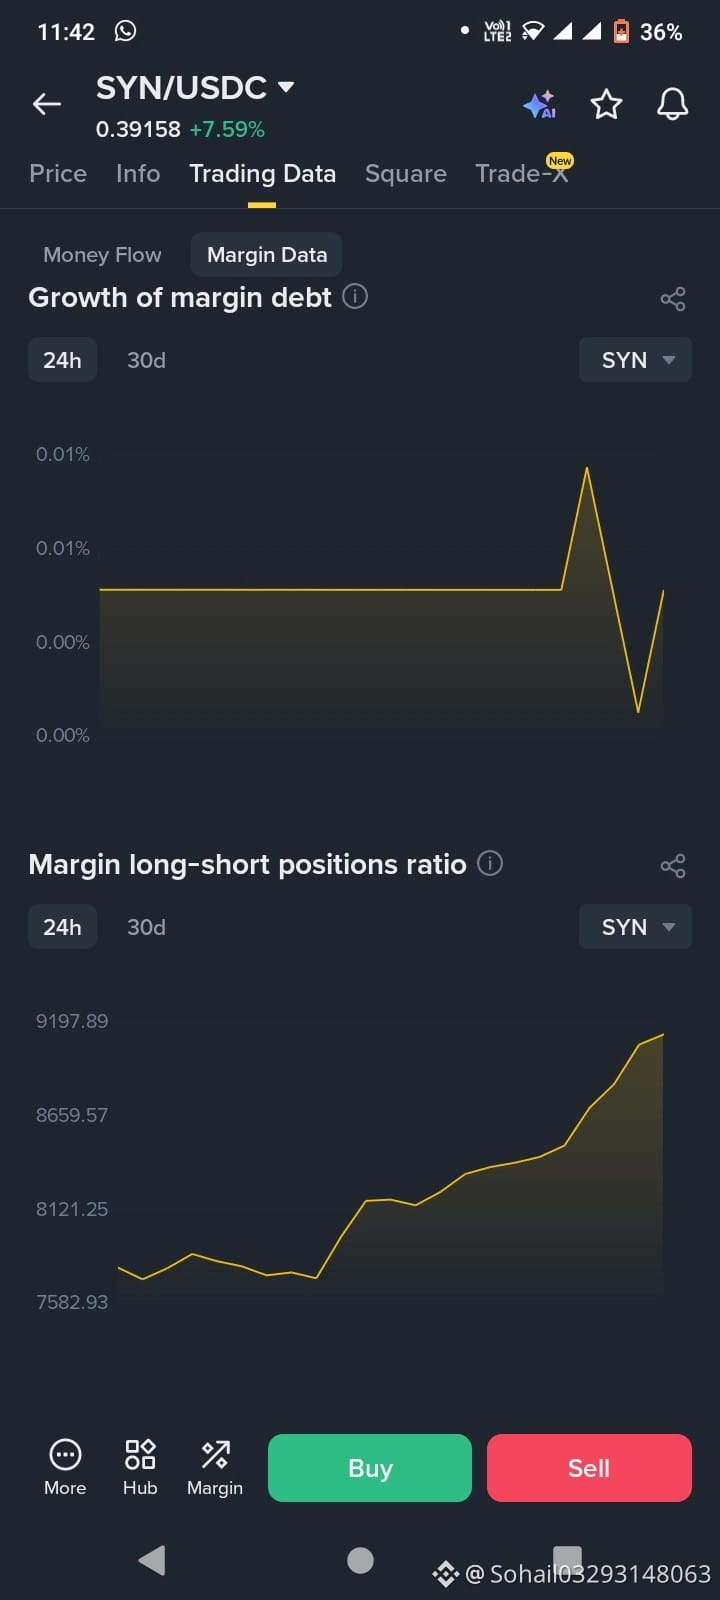
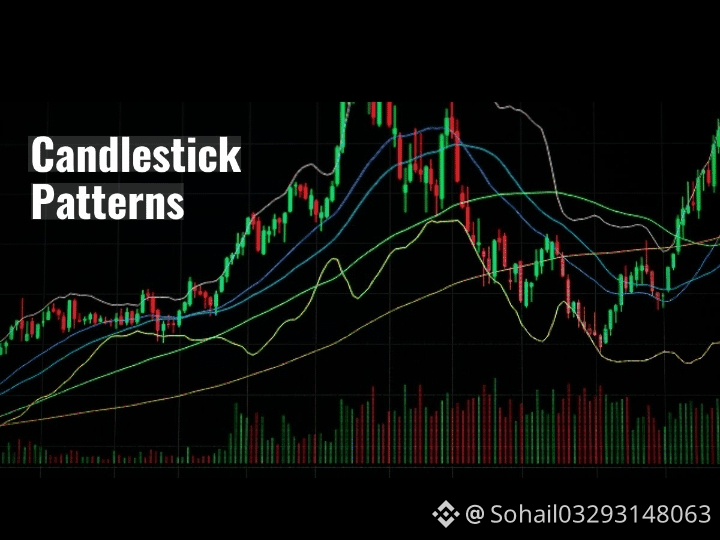
#SYNUSDC Analyzing the SYN/USDC pair involves using candlestick charts to identify market sentiment and potential price trends. Trading digital assets involves significant volatility, so understanding chart patterns is a fundamental part of technical analysis.
Key Candlestick Patterns for Analysis
Reading candlestick formations helps in understanding the historical interaction between buyers and sellers.
Bullish Engulfing: A small red candle followed by a larger green candle that completely "engulfs" the previous day's range. This often indicates a shift where buyers have gained momentum over sellers.
⭐ Morning Star: A three-candle pattern found at the bottom of a downtrend. It consists of a large red candle, a small-bodied candle (indecision), and a large green candle that closes well into the body of the first red candle.
🔨 Hammer: A candle with a small body at the top and a long lower wick. This suggests that while sellers initially pushed prices lower, strong buying pressure emerged to drive the price back up toward the open.
🧠Concepts in Market AnalysisSupport and Resistance: Traders often identify "Support," which is a historical price level where a downtrend tends to pause due to a concentration of buying demand. "Resistance" is the opposite— a level where an uptrend may pause as selling interest increases
💡Trend Confirmation: Instead of focusing on specific price targets, many analysts look for a breakout above resistance or a bounce off support accompanied by high trading volume to confirm a trend.
💵Risk Management: Using stop-loss orders is a common method to manage potential downside by automatically selling an asset if it reaches a certain price. It is generally suggested to determine a maximum percentage of capital to risk on any single position to maintain long-term portfolio stability.
#SKHynixUSListingOversubscribed
#VanguardOpensDigitalAssetsHeadSearch
#RussiaToRecognizeCryptoAsLegalProperty
#JapanBondYieldsRise
$SYN
#SYNUSDC Analyzing the SYN/USDC pair involves using candlestick charts to identify market sentiment and potential price trends. Trading digital assets involves significant volatility, so understanding chart patterns is a fundamental part of technical analysis.
Key Candlestick Patterns for Analysis
Reading candlestick formations helps in understanding the historical interaction between buyers and sellers.
Bullish Engulfing: A small red candle followed by a larger green candle that completely "engulfs" the previous day's range. This often indicates a shift where buyers have gained momentum over sellers.
⭐ Morning Star: A three-candle pattern found at the bottom of a downtrend. It consists of a large red candle, a small-bodied candle (indecision), and a large green candle that closes well into the body of the first red candle.
🔨 Hammer: A candle with a small body at the top and a long lower wick. This suggests that while sellers initially pushed prices lower, strong buying pressure emerged to drive the price back up toward the open.
🧠Concepts in Market AnalysisSupport and Resistance: Traders often identify "Support," which is a historical price level where a downtrend tends to pause due to a concentration of buying demand. "Resistance" is the opposite— a level where an uptrend may pause as selling interest increases
💡Trend Confirmation: Instead of focusing on specific price targets, many analysts look for a breakout above resistance or a bounce off support accompanied by high trading volume to confirm a trend.
💵Risk Management: Using stop-loss orders is a common method to manage potential downside by automatically selling an asset if it reaches a certain price. It is generally suggested to determine a maximum percentage of capital to risk on any single position to maintain long-term portfolio stability.
#SKHynixUSListingOversubscribed
#VanguardOpensDigitalAssetsHeadSearch
#RussiaToRecognizeCryptoAsLegalProperty
#JapanBondYieldsRise
#SYNUSDC Analyzing the SYN/USDC pair involves using candlestick charts to identify market sentiment and potential price trends. Trading digital assets involves significant volatility, so understanding chart patterns is a fundamental part of technical analysis.
Key Candlestick Patterns for Analysis
Reading candlestick formations helps in understanding the historical interaction between buyers and sellers.
Bullish Engulfing: A small red candle followed by a larger green candle that completely "engulfs" the previous day's range. This often indicates a shift where buyers have gained momentum over sellers.
⭐ Morning Star: A three-candle pattern found at the bottom of a downtrend. It consists of a large red candle, a small-bodied candle (indecision), and a large green candle that closes well into the body of the first red candle.
🔨 Hammer: A candle with a small body at the top and a long lower wick. This suggests that while sellers initially pushed prices lower, strong buying pressure emerged to drive the price back up toward the open.
🧠Concepts in Market AnalysisSupport and Resistance: Traders often identify "Support," which is a historical price level where a downtrend tends to pause due to a concentration of buying demand. "Resistance" is the opposite— a level where an uptrend may pause as selling interest increases
💡Trend Confirmation: Instead of focusing on specific price targets, many analysts look for a breakout above resistance or a bounce off support accompanied by high trading volume to confirm a trend.
💵Risk Management: Using stop-loss orders is a common method to manage potential downside by automatically selling an asset if it reaches a certain price. It is generally suggested to determine a maximum percentage of capital to risk on any single position to maintain long-term portfolio stability.
#SKHynixUSListingOversubscribed
#VanguardOpensDigitalAssetsHeadSearch
#RussiaToRecognizeCryptoAsLegalProperty
#JapanBondYieldsRise
1
121
·
--
ສັນຍານກະທິງ
ເບິ່ງການແປ
$SYN
{future}(SYNUSDT)
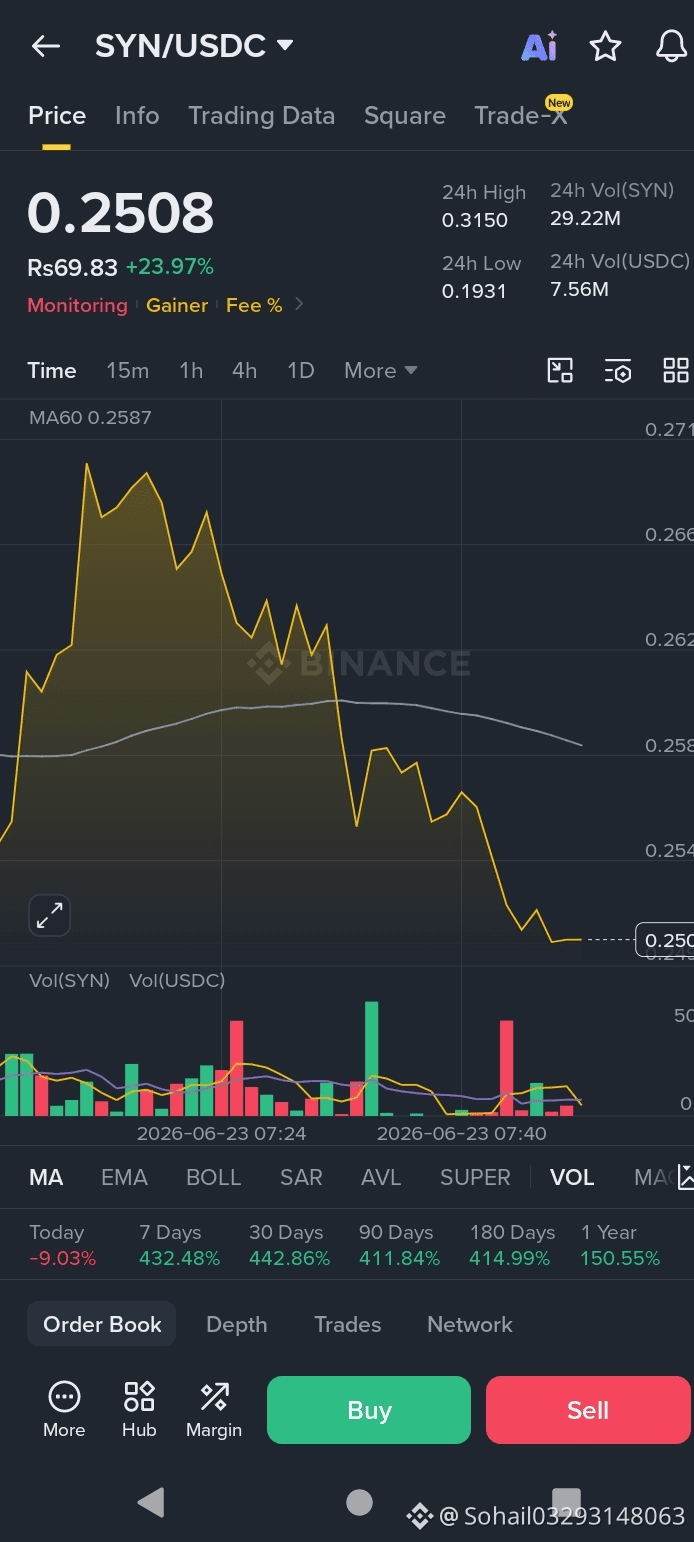
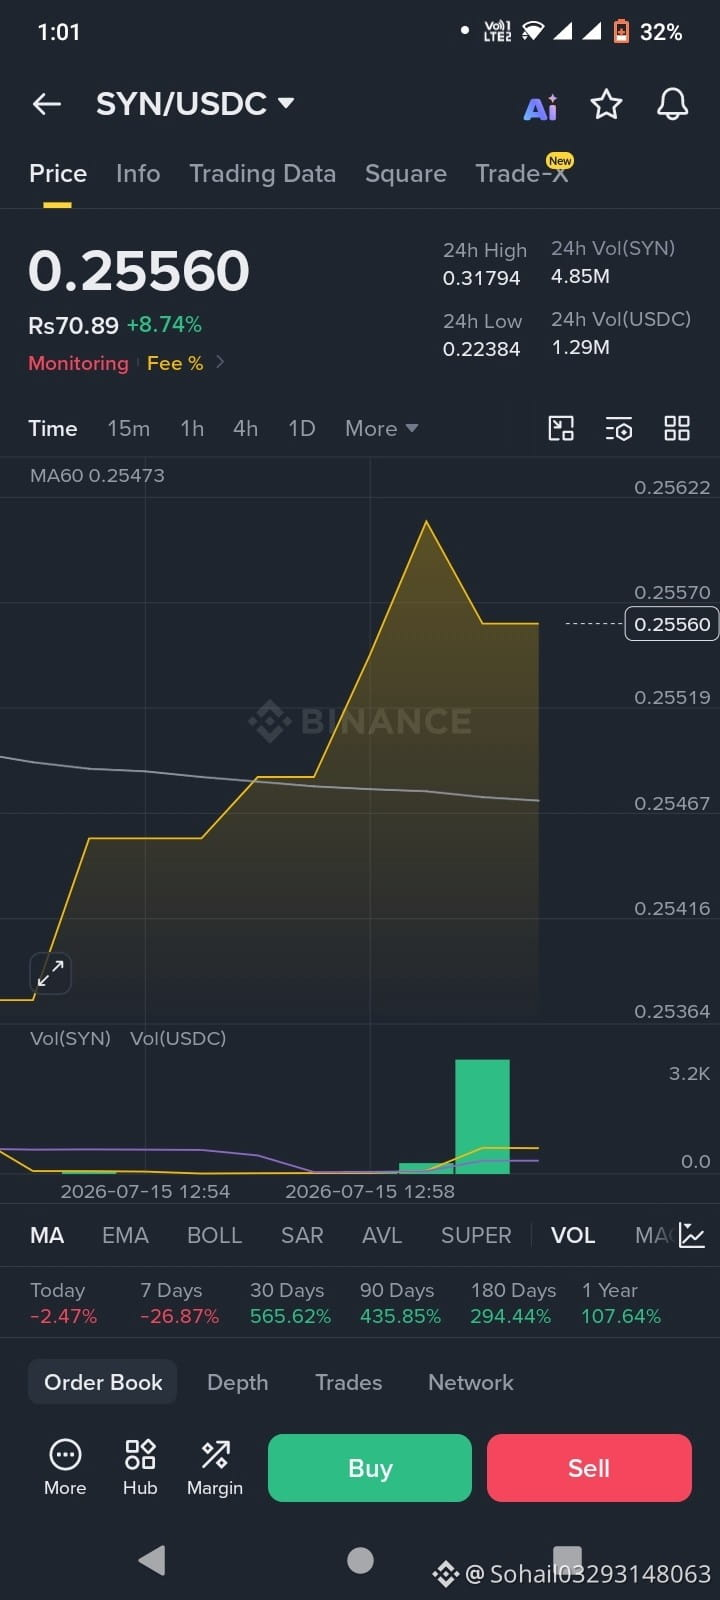
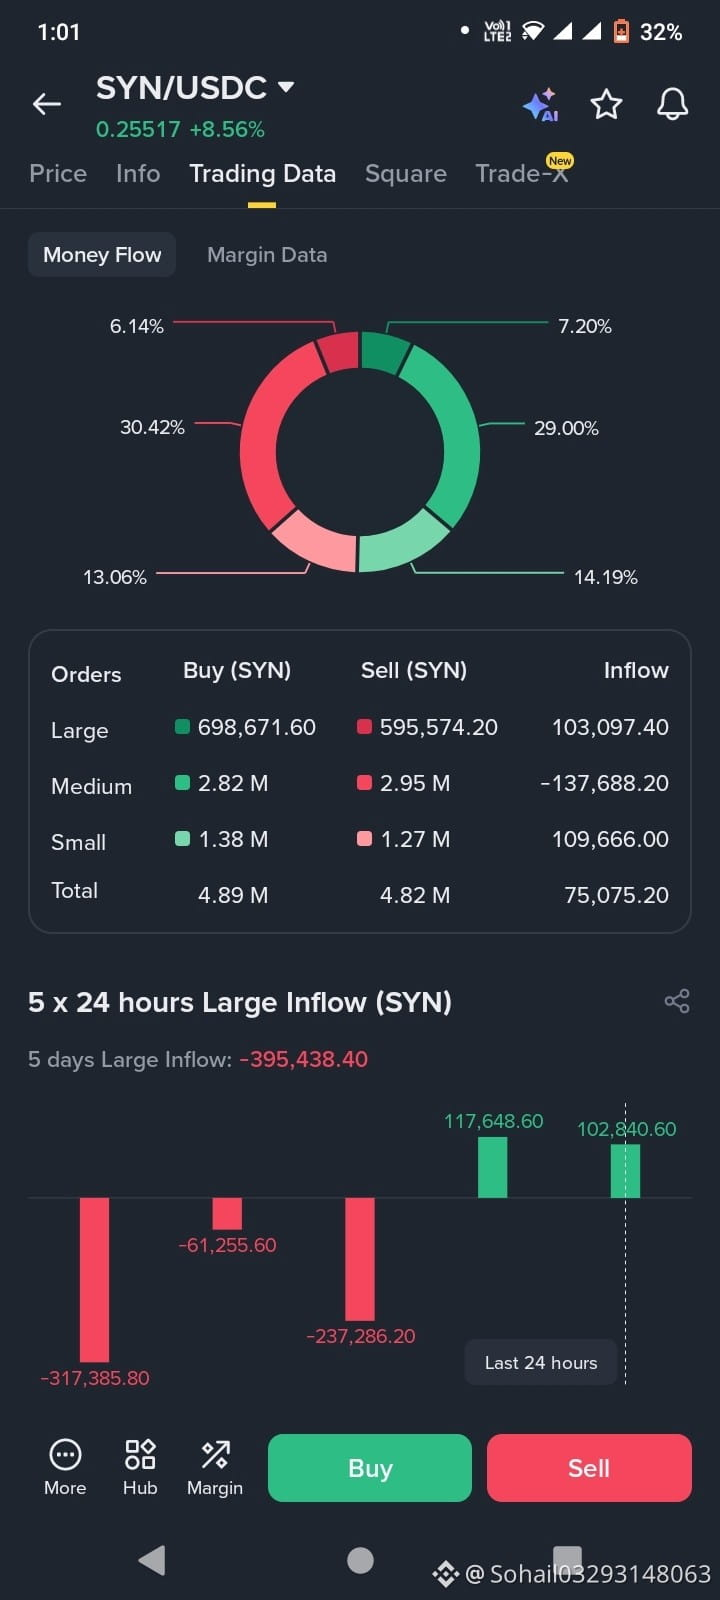
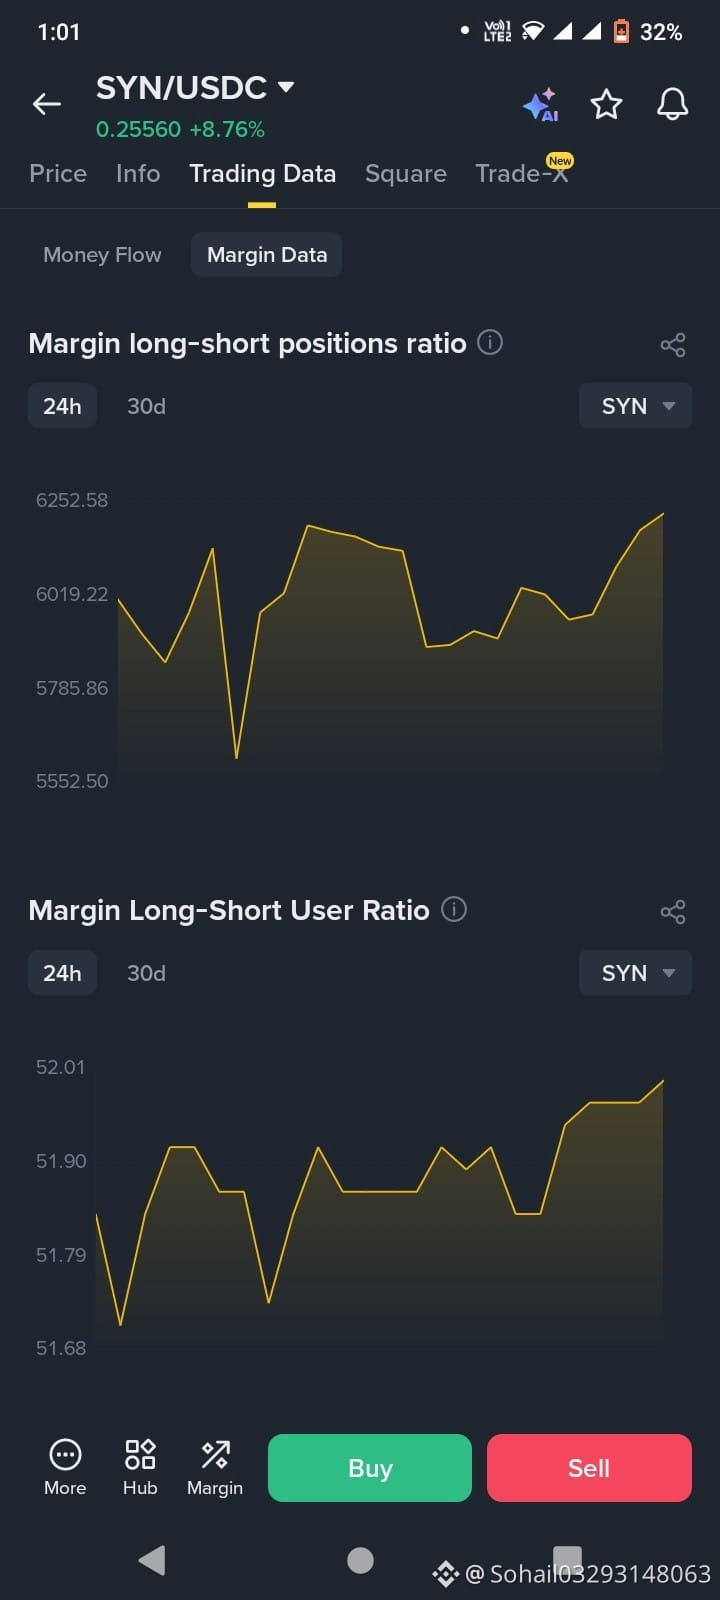
#SYNUSDC (Synapse) is currently trading in a highly volatile phase around the $0.30 - $0.32 mark. Traders are heavily watching the price action as it attempts to reverse a prolonged downtrend and clear immediate resistance zones, which would allow the asset to push toward higher targets.
🗝️ 🔐Key Technical Levels to WatchSupport Zone: $0.27 - $0.29. The price has historically shown bounces from this range, making it the primary defensive floor for bulls.Immediate Resistance: $0.36. This is the first hurdle. Breaking through this with volume will determine short-term bullish continuation.Major Breakout Target: $0.62 - $0.65. If macro bullish momentum breaks the descending trendline, this is the primary recovery zone.
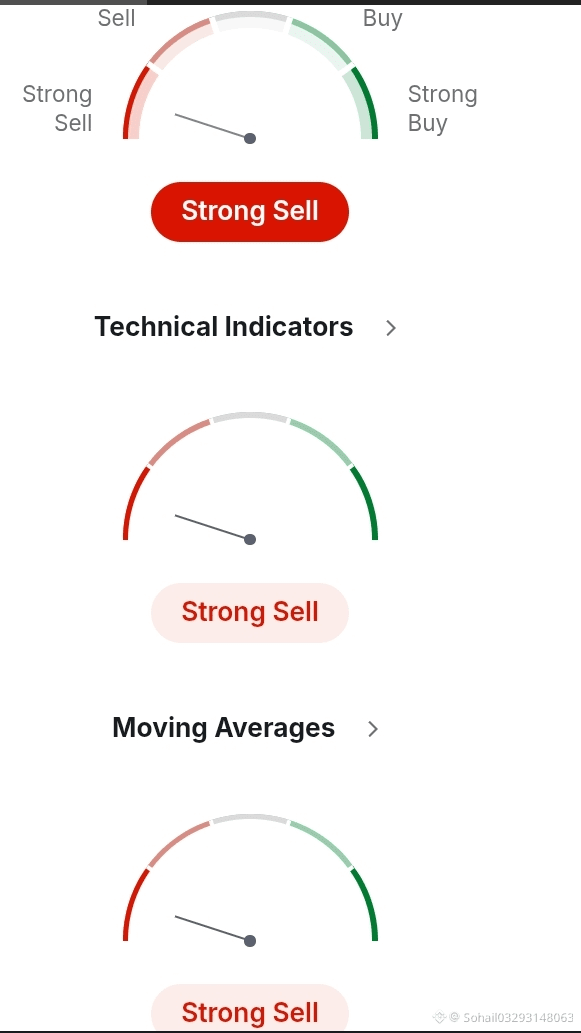
Trading Setup AnalysisThe Opportunity: SYN often displays "spring and expansion" accumulation patterns before initiating impulsive rally waves. Traders looking to enter should wait for the price to comfortably establish itself above the major moving averages (e.g., EMA 8/13/21) to confirm momentum shift.
Stop Loss (SL): A strict stop loss is critical given the asset's volatility. Many traders set SL just below the primary support (e.g., $0.25) to invalidate false breakouts
#AsianChipStocksRallyAfterUSSemiRebound
#IBMSharesFall25%
#TrumpScrapsHormuzShippingFeeAfterGulfPressure
#ChangxinTechSetsIPOPriceAtCNY8.66
$SYN
#SYNUSDC (Synapse) is currently trading in a highly volatile phase around the $0.30 - $0.32 mark. Traders are heavily watching the price action as it attempts to reverse a prolonged downtrend and clear immediate resistance zones, which would allow the asset to push toward higher targets.
🗝️ 🔐Key Technical Levels to WatchSupport Zone: $0.27 - $0.29. The price has historically shown bounces from this range, making it the primary defensive floor for bulls.Immediate Resistance: $0.36. This is the first hurdle. Breaking through this with volume will determine short-term bullish continuation.Major Breakout Target: $0.62 - $0.65. If macro bullish momentum breaks the descending trendline, this is the primary recovery zone.
Trading Setup AnalysisThe Opportunity: SYN often displays "spring and expansion" accumulation patterns before initiating impulsive rally waves. Traders looking to enter should wait for the price to comfortably establish itself above the major moving averages (e.g., EMA 8/13/21) to confirm momentum shift.
Stop Loss (SL): A strict stop loss is critical given the asset's volatility. Many traders set SL just below the primary support (e.g., $0.25) to invalidate false breakouts
#AsianChipStocksRallyAfterUSSemiRebound
#IBMSharesFall25%
#TrumpScrapsHormuzShippingFeeAfterGulfPressure
#ChangxinTechSetsIPOPriceAtCNY8.66
#SYNUSDC (Synapse) is currently trading in a highly volatile phase around the $0.30 - $0.32 mark. Traders are heavily watching the price action as it attempts to reverse a prolonged downtrend and clear immediate resistance zones, which would allow the asset to push toward higher targets.
🗝️ 🔐Key Technical Levels to WatchSupport Zone: $0.27 - $0.29. The price has historically shown bounces from this range, making it the primary defensive floor for bulls.Immediate Resistance: $0.36. This is the first hurdle. Breaking through this with volume will determine short-term bullish continuation.Major Breakout Target: $0.62 - $0.65. If macro bullish momentum breaks the descending trendline, this is the primary recovery zone.
Trading Setup AnalysisThe Opportunity: SYN often displays "spring and expansion" accumulation patterns before initiating impulsive rally waves. Traders looking to enter should wait for the price to comfortably establish itself above the major moving averages (e.g., EMA 8/13/21) to confirm momentum shift.
Stop Loss (SL): A strict stop loss is critical given the asset's volatility. Many traders set SL just below the primary support (e.g., $0.25) to invalidate false breakouts
#AsianChipStocksRallyAfterUSSemiRebound
#IBMSharesFall25%
#TrumpScrapsHormuzShippingFeeAfterGulfPressure
#ChangxinTechSetsIPOPriceAtCNY8.66
1
106

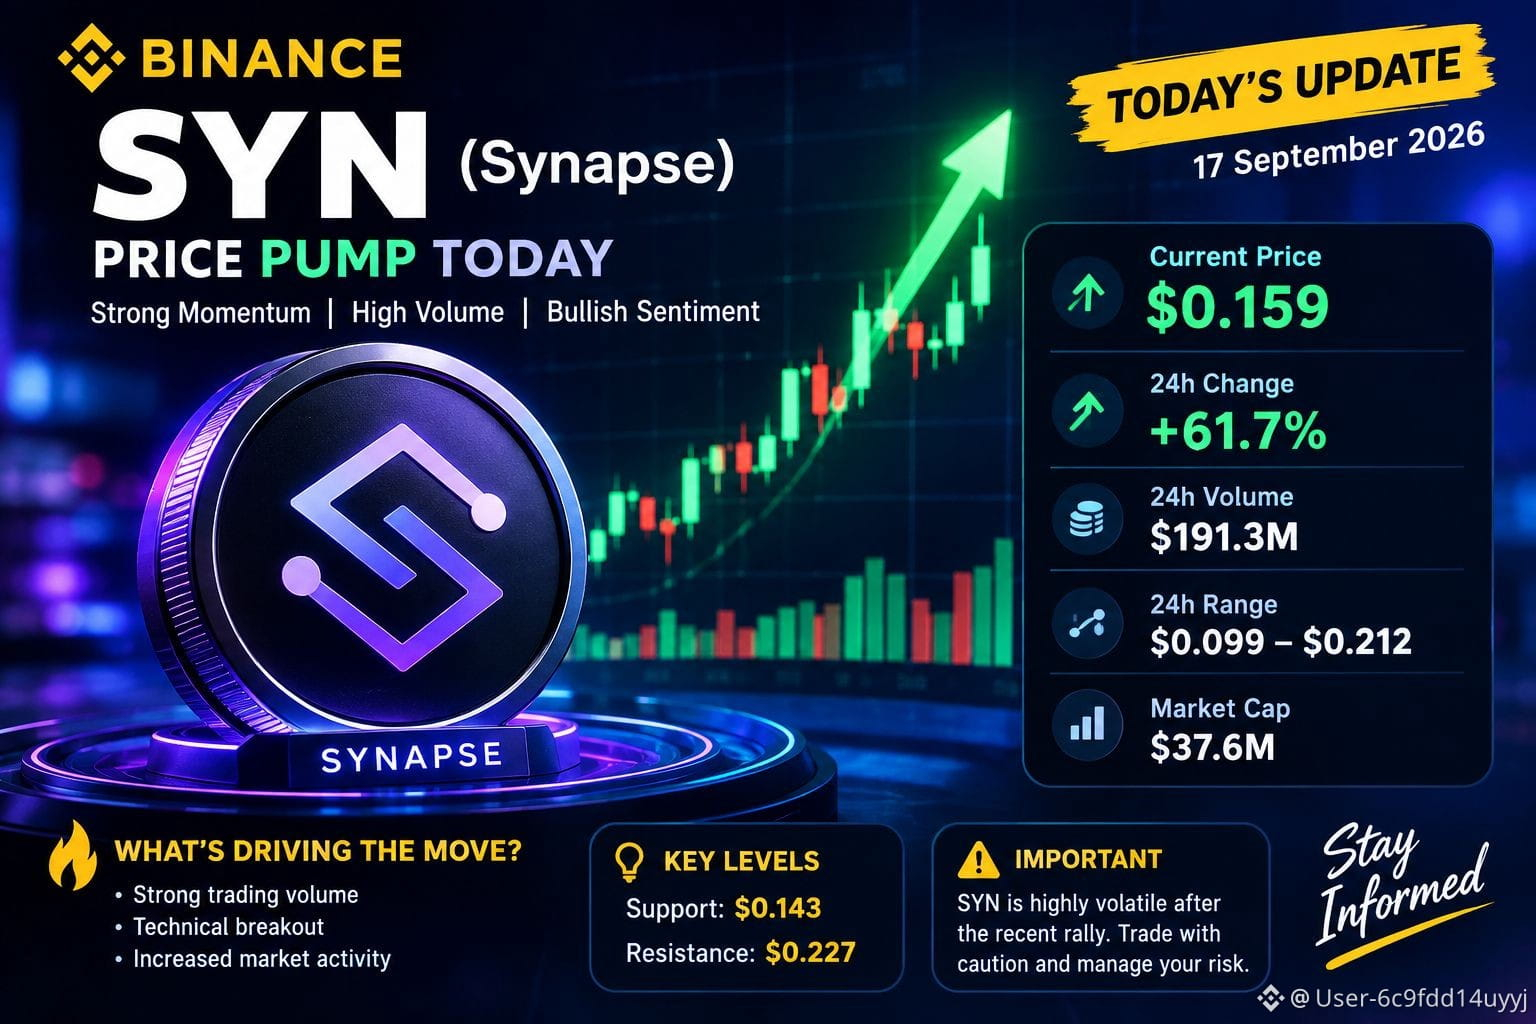
Oo, ginawa ko ang pagsusuri sa pinakabagong market data noong 17 September 2026.
🔥 $SYN (Synapse) — Update Ngayon
Presyo: humigit-kumulang $0.159
24h change: humigit-kumulang +61.7%
24h volume: humigit-kumulang $191.3M
24h range: humigit-kumulang $0.099–$0.212
Market cap: humigit-kumulang $37.6M
Ngayon, nagkaroon ng sobrang bilis na momentum ang $SYN . Ayon sa historical data ng CoinGecko, ang close noong 16 September ay nasa humigit-kumulang $0.1761, habang ang close noong 15 September ay $0.1002 lang—ibig sabihin, naging mabilis ang paggalaw sa mga nakalipas na ilang sessions.
Sa mga report ngayon, ang SYN ay naka-trade din sa itaas ng $0.20 sa intraday, at ang volume ay umabot sa humigit-kumulang $180–190M+ . Sa ngayon, wala pa ring malinaw na malaking $SYN -specific fundamental na anunsyo na siyang nakitang dahilan ng rally na ito.
Mga importanteng level: may short-term support na malapit sa $0.143 at nakikitang resistance sa paligid ng $0.227.
Pagkatapos ng napakabilis na pag-akyat na ito, mataas na ang volatility, kaya maaaring maging delikado ang pagpasok na base lang sa price pump.#SYN #SynapseTrend #SYNUSDC #CryptoNews
Oo, ginawa ko ang pagsusuri sa pinakabagong market data noong 17 September 2026.
🔥 $SYN (Synapse) — Update Ngayon
Presyo: humigit-kumulang $0.159
24h change: humigit-kumulang +61.7%
24h volume: humigit-kumulang $191.3M
24h range: humigit-kumulang $0.099–$0.212
Market cap: humigit-kumulang $37.6M
Ngayon, nagkaroon ng sobrang bilis na momentum ang $SYN . Ayon sa historical data ng CoinGecko, ang close noong 16 September ay nasa humigit-kumulang $0.1761, habang ang close noong 15 September ay $0.1002 lang—ibig sabihin, naging mabilis ang paggalaw sa mga nakalipas na ilang sessions.
Sa mga report ngayon, ang SYN ay naka-trade din sa itaas ng $0.20 sa intraday, at ang volume ay umabot sa humigit-kumulang $180–190M+ . Sa ngayon, wala pa ring malinaw na malaking $SYN -specific fundamental na anunsyo na siyang nakitang dahilan ng rally na ito.
Mga importanteng level: may short-term support na malapit sa $0.143 at nakikitang resistance sa paligid ng $0.227.
Pagkatapos ng napakabilis na pag-akyat na ito, mataas na ang volatility, kaya maaaring maging delikado ang pagpasok na base lang sa price pump.#SYN #SynapseTrend #SYNUSDC #CryptoNews
🔥 $SYN (Synapse) — Update Ngayon
Presyo: humigit-kumulang $0.159
24h change: humigit-kumulang +61.7%
24h volume: humigit-kumulang $191.3M
24h range: humigit-kumulang $0.099–$0.212
Market cap: humigit-kumulang $37.6M
Ngayon, nagkaroon ng sobrang bilis na momentum ang $SYN . Ayon sa historical data ng CoinGecko, ang close noong 16 September ay nasa humigit-kumulang $0.1761, habang ang close noong 15 September ay $0.1002 lang—ibig sabihin, naging mabilis ang paggalaw sa mga nakalipas na ilang sessions.
Sa mga report ngayon, ang SYN ay naka-trade din sa itaas ng $0.20 sa intraday, at ang volume ay umabot sa humigit-kumulang $180–190M+ . Sa ngayon, wala pa ring malinaw na malaking $SYN -specific fundamental na anunsyo na siyang nakitang dahilan ng rally na ito.
Mga importanteng level: may short-term support na malapit sa $0.143 at nakikitang resistance sa paligid ng $0.227.
Pagkatapos ng napakabilis na pag-akyat na ito, mataas na ang volatility, kaya maaaring maging delikado ang pagpasok na base lang sa price pump.#SYN #SynapseTrend #SYNUSDC #CryptoNews
43
ເຂົ້າສູ່ລະບົບເພື່ອສຳຫຼວດເນື້ອຫາເພີ່ມເຕີມ
ເຂົ້າຮ່ວມກຸ່ມຜູ້ໃຊ້ຄຣິບໂຕທົ່ວໂລກໃນ Binance Square.
⚡️ ໄດ້ຮັບຂໍ້ມູນຫຼ້າສຸດ ແລະ ທີ່ມີປະໂຫຍດກ່ຽວກັບຄຣິບໂຕ.
💬 ໄດ້ຮັບຄວາມໄວ້ວາງໃຈຈາກຕະຫຼາດແລກປ່ຽນຄຣິບໂຕທີ່ໃຫຍ່ທີ່ສຸດໃນໂລກ.
👍 ຄົ້ນຫາຂໍ້ມູນເຊີງເລິກທີ່ແທ້ຈາກນັກສ້າງທີ່ໄດ້ຮັບການຢືນຢັນ.
ອີເມວ / ເບີໂທລະສັບ
ຫົວຂໍ້ທີ່ກໍາລັງນິຍົມ
1
#BOJHikesRatesTo31YearHigh
945 views
71 ກຳລັງສົນທະນາ
2
#ChainlinkPowersBottomlinePaymentPlatform
4,909 views
162 ກຳລັງສົນທະນາ
3
#DtcpayCompletes$25MSeriesA
0 views
2 ກຳລັງສົນທະນາ
4
#StellarActivatesProtocol28At211TPS
14,248 views
349 ກຳລັງສົນທະນາ
5
#SECGrantsInnovationExemptionForTokenizedStocks
11,349 views
283 ກຳລັງສົນທະນາ
6
#XRPGains3%AsRippleAddsMPPSupport
8,881 views
213 ກຳລັງສົນທະນາ
7
#SPGlobalToAcquireOpenZeppelin
5,256 views
148 ກຳລັງສົນທະນາ
8
#WorldLaunchesSelfCustodyAppIn150Countries
2,526 views
73 ກຳລັງສົນທະນາ
9
#BitcoinSurpasses$77000
21,997 views
251 ກຳລັງສົນທະນາ
10
#ParadigmDisclosesZECHolding
99,570 views
1,313 ກຳລັງສົນທະນາ