

#pennant
pennant
1,758 views
12 ກຳລັງສົນທະນາ
ມາແຮງ
ຫຼ້າສຸດ

·
--
ບົດຄວາມ
Pennant Pattern: Explained Simply📘 What is a Pennant?
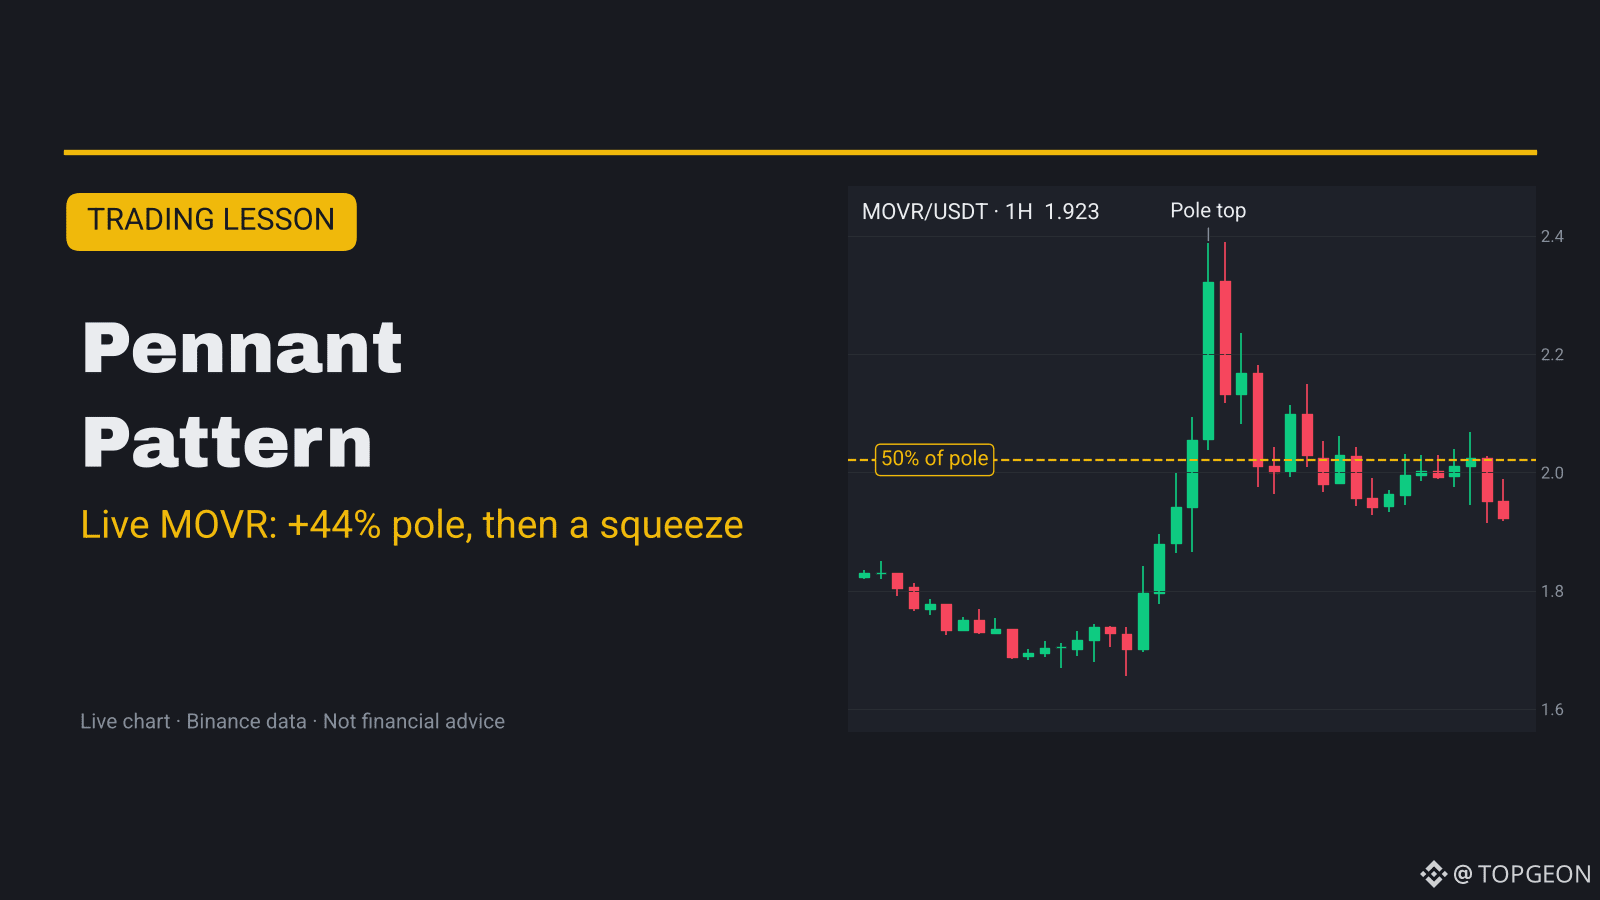
$MOVR jumped 44% in 5 hours yesterday, then started to squeeze into a small triangle. That is exactly how a pennant begins, and it is a great live lesson.
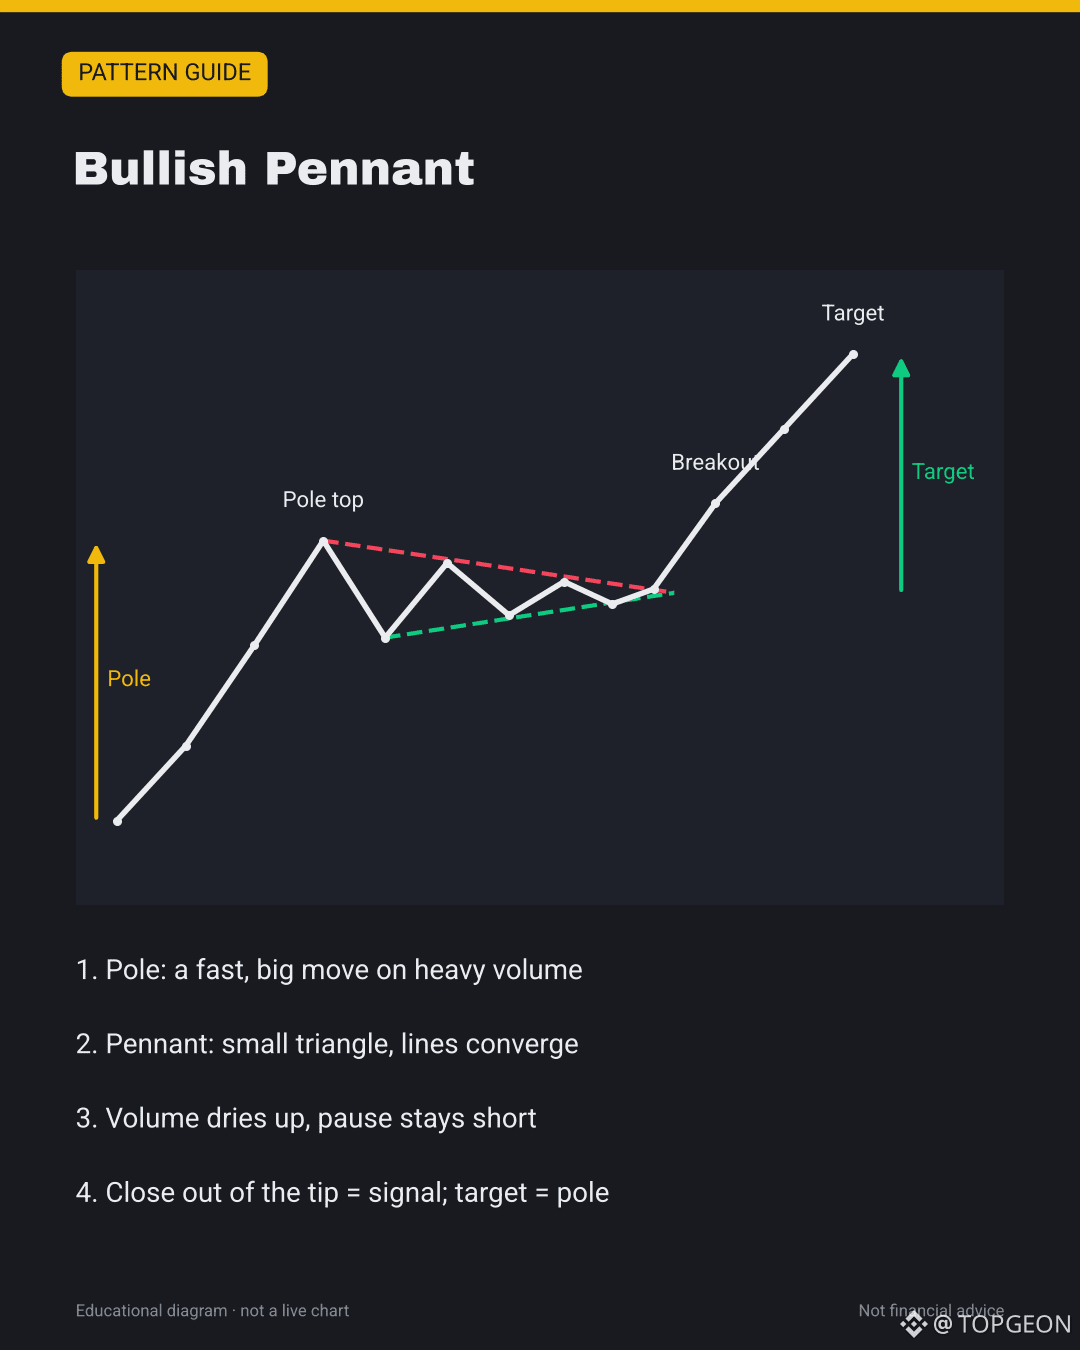
A pennant is a short pause after a very fast move. First comes the "pole": a big, quick candle run on heavy volume. Then price trades in a small triangle where the highs go down and the lows go up. The lines meet at a point, like a little flag on a pole.
• Bullish pennant: fast move up, then a small converging triangle
• Bearish pennant: fast move down, then the same small triangle
• Flag vs pennant: a flag is a tilted channel (parallel lines), a pennant has lines that meet
📊 Live chart in the cover and in the image post below.
🔍 How to spot a pennant
• Find the pole first: a sharp move, much bigger than normal candles
• Draw a line over the falling highs and a line under the rising lows
• The 2 lines should converge into a small, tight triangle
• Volume should fade during the pause
• The pause is short: usually 1–3 weeks on daily charts, hours to a day on 1H
• The pullback should stay shallow, ideally under 50% of the pole
📈 How traders use it
• Entry: on a candle CLOSE out of the triangle in the pole's direction
• Stop-loss: just beyond the other side of the pennant
• Target: measure the pole height and add it to the breakout point
🧪 Live example: MOVR 1H, October 5–6, 2026
The pole:
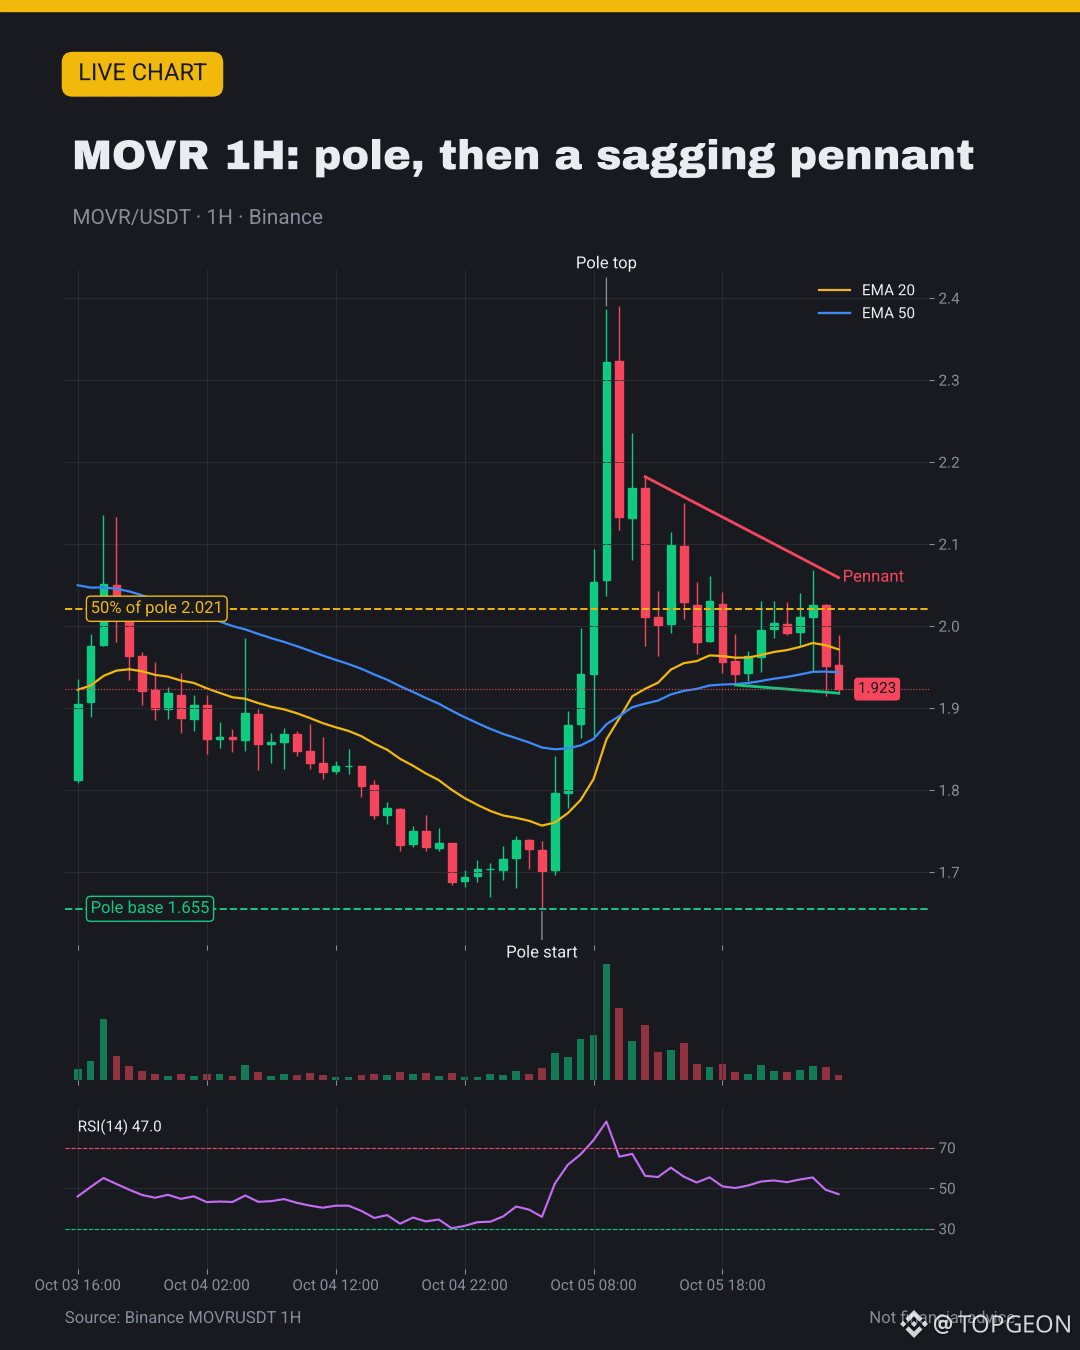
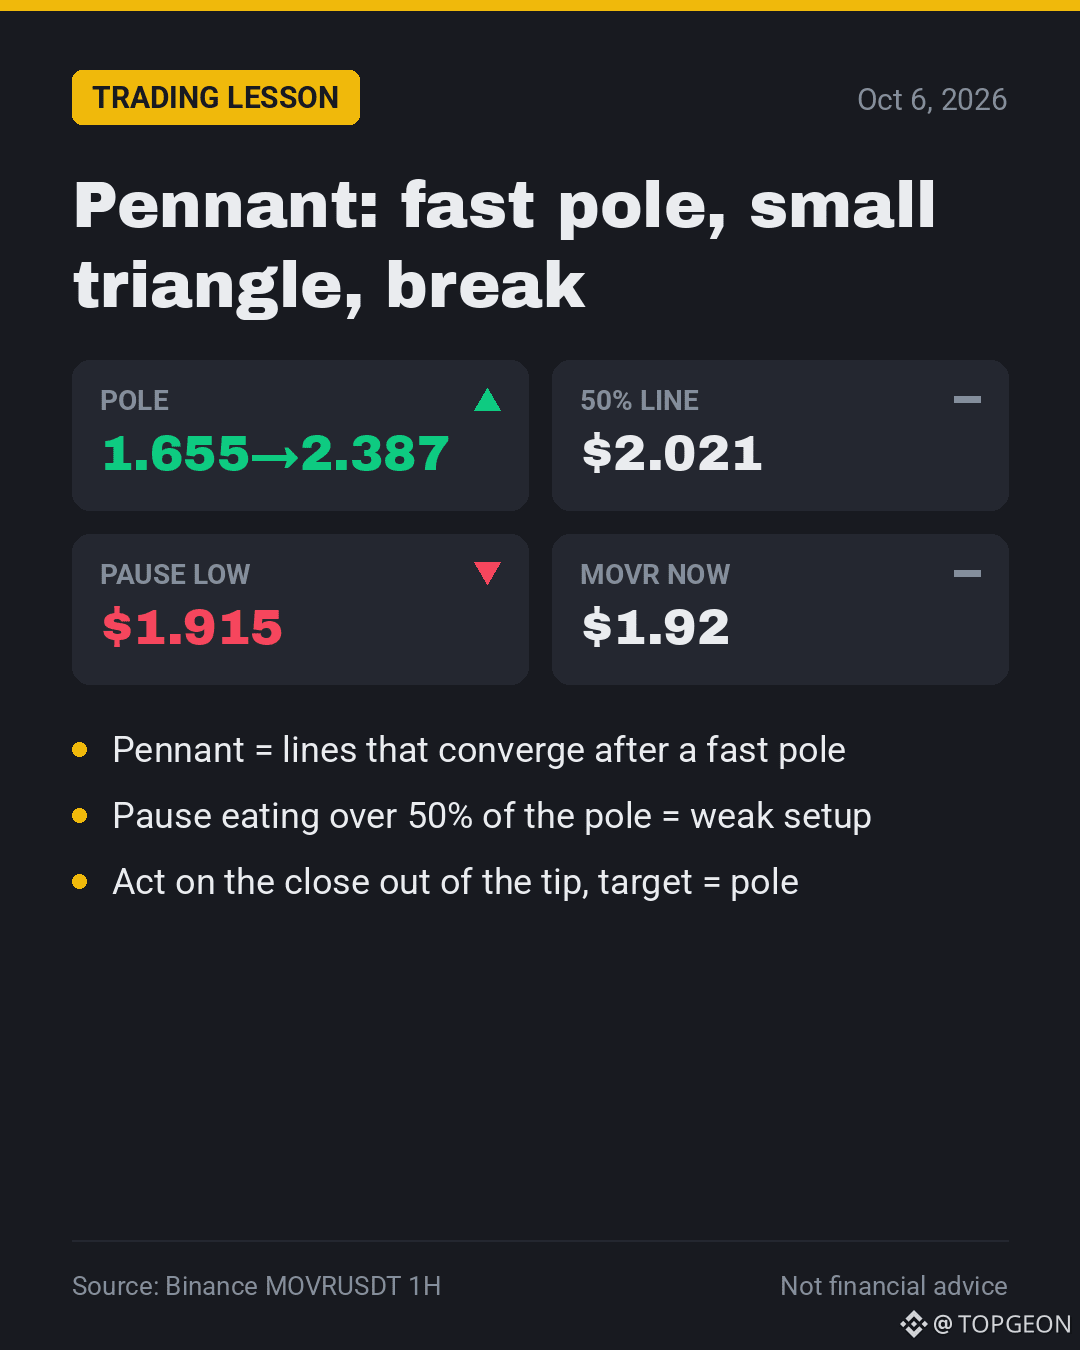
• Oct 5, 04:00 UTC: low at $1.655
• Oct 5, 09:00 UTC: high at $2.387
• About +44% in 5 hours, on the biggest hourly volume on the chart
The pause:
• Highs stepped down: $2.235, $2.182, $2.150, then near $2.06
• Range narrowed from about $0.31 to about $0.15
• Volume faded hour by hour
The problem: the lows did not rise. They slid from $1.963 to $1.915. Price now trades near $1.92, so the pause has given back about 63% of the pole. The 50% line is $2.021, and price is below it.
Right now RSI(14) on 1H is 47, with price just under the 20 EMA ($1.97) and near the 50 EMA ($1.94). That is a weak, sagging pennant, not a clean one.
What would need to happen: a 1H close above the upper line (around $2.06) on rising volume. A close under $1.915 would break the structure.
For comparison, $BTC shows no pennant now. Its last push (Oct 5, $84,972 to $86,130) was too slow to count as a pole.
⚠️ Common mistakes
• Calling any small triangle a pennant. No fast pole = just a triangle
• Ignoring depth. A pause that eats more than 50% of the pole is a warning
• Buying inside the pennant before the close out of it
• Waiting too long. If the pause drags on, the pattern loses its power
✅ Quick checklist
• Is there a clear, fast pole on high volume?
• Do the lines converge into a small triangle?
• Did volume fade and the pullback stay under 50%?
• Did a candle close out of the tip, with volume?
• Stop on the other side, target = pole height?
💬 Flag or pennant: which pattern has worked better for you? 👇
Not financial advice. DYOR.
#TradingTips #ChartPatterns #Pennant
Pennant Pattern: Explained Simply
📘 What is a Pennant?
$MOVR jumped 44% in 5 hours yesterday, then started to squeeze into a small triangle. That is exactly how a pennant begins, and it is a great live lesson.
A pennant is a short pause after a very fast move. First comes the "pole": a big, quick candle run on heavy volume. Then price trades in a small triangle where the highs go down and the lows go up. The lines meet at a point, like a little flag on a pole.
• Bullish pennant: fast move up, then a small converging triangle
• Bearish pennant: fast move down, then the same small triangle
• Flag vs pennant: a flag is a tilted channel (parallel lines), a pennant has lines that meet
📊 Live chart in the cover and in the image post below.
🔍 How to spot a pennant
• Find the pole first: a sharp move, much bigger than normal candles
• Draw a line over the falling highs and a line under the rising lows
• The 2 lines should converge into a small, tight triangle
• Volume should fade during the pause
• The pause is short: usually 1–3 weeks on daily charts, hours to a day on 1H
• The pullback should stay shallow, ideally under 50% of the pole
📈 How traders use it
• Entry: on a candle CLOSE out of the triangle in the pole's direction
• Stop-loss: just beyond the other side of the pennant
• Target: measure the pole height and add it to the breakout point
🧪 Live example: MOVR 1H, October 5–6, 2026
The pole:
• Oct 5, 04:00 UTC: low at $1.655
• Oct 5, 09:00 UTC: high at $2.387
• About +44% in 5 hours, on the biggest hourly volume on the chart
The pause:
• Highs stepped down: $2.235, $2.182, $2.150, then near $2.06
• Range narrowed from about $0.31 to about $0.15
• Volume faded hour by hour
The problem: the lows did not rise. They slid from $1.963 to $1.915. Price now trades near $1.92, so the pause has given back about 63% of the pole. The 50% line is $2.021, and price is below it.
Right now RSI(14) on 1H is 47, with price just under the 20 EMA ($1.97) and near the 50 EMA ($1.94). That is a weak, sagging pennant, not a clean one.
What would need to happen: a 1H close above the upper line (around $2.06) on rising volume. A close under $1.915 would break the structure.
For comparison, $BTC shows no pennant now. Its last push (Oct 5, $84,972 to $86,130) was too slow to count as a pole.
⚠️ Common mistakes
• Calling any small triangle a pennant. No fast pole = just a triangle
• Ignoring depth. A pause that eats more than 50% of the pole is a warning
• Buying inside the pennant before the close out of it
• Waiting too long. If the pause drags on, the pattern loses its power
✅ Quick checklist
• Is there a clear, fast pole on high volume?
• Do the lines converge into a small triangle?
• Did volume fade and the pullback stay under 50%?
• Did a candle close out of the tip, with volume?
• Stop on the other side, target = pole height?
💬 Flag or pennant: which pattern has worked better for you? 👇
Not financial advice. DYOR.
#TradingTips #ChartPatterns #Pennant
$MOVR jumped 44% in 5 hours yesterday, then started to squeeze into a small triangle. That is exactly how a pennant begins, and it is a great live lesson.
A pennant is a short pause after a very fast move. First comes the "pole": a big, quick candle run on heavy volume. Then price trades in a small triangle where the highs go down and the lows go up. The lines meet at a point, like a little flag on a pole.
• Bullish pennant: fast move up, then a small converging triangle
• Bearish pennant: fast move down, then the same small triangle
• Flag vs pennant: a flag is a tilted channel (parallel lines), a pennant has lines that meet
📊 Live chart in the cover and in the image post below.
🔍 How to spot a pennant
• Find the pole first: a sharp move, much bigger than normal candles
• Draw a line over the falling highs and a line under the rising lows
• The 2 lines should converge into a small, tight triangle
• Volume should fade during the pause
• The pause is short: usually 1–3 weeks on daily charts, hours to a day on 1H
• The pullback should stay shallow, ideally under 50% of the pole
📈 How traders use it
• Entry: on a candle CLOSE out of the triangle in the pole's direction
• Stop-loss: just beyond the other side of the pennant
• Target: measure the pole height and add it to the breakout point
🧪 Live example: MOVR 1H, October 5–6, 2026
The pole:
• Oct 5, 04:00 UTC: low at $1.655
• Oct 5, 09:00 UTC: high at $2.387
• About +44% in 5 hours, on the biggest hourly volume on the chart
The pause:
• Highs stepped down: $2.235, $2.182, $2.150, then near $2.06
• Range narrowed from about $0.31 to about $0.15
• Volume faded hour by hour
The problem: the lows did not rise. They slid from $1.963 to $1.915. Price now trades near $1.92, so the pause has given back about 63% of the pole. The 50% line is $2.021, and price is below it.
Right now RSI(14) on 1H is 47, with price just under the 20 EMA ($1.97) and near the 50 EMA ($1.94). That is a weak, sagging pennant, not a clean one.
What would need to happen: a 1H close above the upper line (around $2.06) on rising volume. A close under $1.915 would break the structure.
For comparison, $BTC shows no pennant now. Its last push (Oct 5, $84,972 to $86,130) was too slow to count as a pole.
⚠️ Common mistakes
• Calling any small triangle a pennant. No fast pole = just a triangle
• Ignoring depth. A pause that eats more than 50% of the pole is a warning
• Buying inside the pennant before the close out of it
• Waiting too long. If the pause drags on, the pattern loses its power
✅ Quick checklist
• Is there a clear, fast pole on high volume?
• Do the lines converge into a small triangle?
• Did volume fade and the pullback stay under 50%?
• Did a candle close out of the tip, with volume?
• Stop on the other side, target = pole height?
💬 Flag or pennant: which pattern has worked better for you? 👇
Not financial advice. DYOR.
#TradingTips #ChartPatterns #Pennant
289
·
--
🔺 Is $MOVR building a pennant after its +44% pole?
✅ Pole: $1.655 → $2.387 in 5 hours, on huge volume
✅ Highs stepping down, range cut in half, volume fading
⚠️ Lows slid to $1.915: about 63% of the pole given back
⚠️ Below the 50% line ($2.021), so this pennant is weak
🧭 Watch: 1H close above ~$2.06 vs a break under $1.915
💬 Do you trade pennants, or wait for the breakout retest? 👇
📖 Full lesson: https://app.binance.com/uni-qr/cart/374241952463850
#ChartPatterns #Pennant #TradingTips
🔺 Is $MOVR building a pennant after its +44% pole?
✅ Pole: $1.655 → $2.387 in 5 hours, on huge volume
✅ Highs stepping down, range cut in half, volume fading
⚠️ Lows slid to $1.915: about 63% of the pole given back
⚠️ Below the 50% line ($2.021), so this pennant is weak
🧭 Watch: 1H close above ~$2.06 vs a break under $1.915
💬 Do you trade pennants, or wait for the breakout retest? 👇
📖 Full lesson: https://app.binance.com/uni-qr/cart/374241952463850
#ChartPatterns #Pennant #TradingTips
✅ Pole: $1.655 → $2.387 in 5 hours, on huge volume
✅ Highs stepping down, range cut in half, volume fading
⚠️ Lows slid to $1.915: about 63% of the pole given back
⚠️ Below the 50% line ($2.021), so this pennant is weak
🧭 Watch: 1H close above ~$2.06 vs a break under $1.915
💬 Do you trade pennants, or wait for the breakout retest? 👇
📖 Full lesson: https://app.binance.com/uni-qr/cart/374241952463850
#ChartPatterns #Pennant #TradingTips
374

$XRP DEMANDS DISCIPLINE — THE STRUCTURE IS CLEAR 🔥
Patient positioning distinguishes the professional from the crowd. $XRP is compressing into a tight pennant on the 4H chart, with declining volume signaling the end of consolidation. The structure points to an imminent expansion. Liquidity sits stacked above recent highs, and the algorithms will likely hunt for it.
Are you holding through the noise or waiting for confirmation?
Not financial advice. Always manage your risk.
#XRP #Accumulation #Pennant #Crypto
💎
$XRP DEMANDS DISCIPLINE — THE STRUCTURE IS CLEAR 🔥
Patient positioning distinguishes the professional from the crowd. $XRP is compressing into a tight pennant on the 4H chart, with declining volume signaling the end of consolidation. The structure points to an imminent expansion. Liquidity sits stacked above recent highs, and the algorithms will likely hunt for it.
Are you holding through the noise or waiting for confirmation?
Not financial advice. Always manage your risk.
#XRP #Accumulation #Pennant #Crypto
💎
Patient positioning distinguishes the professional from the crowd. $XRP is compressing into a tight pennant on the 4H chart, with declining volume signaling the end of consolidation. The structure points to an imminent expansion. Liquidity sits stacked above recent highs, and the algorithms will likely hunt for it.
Are you holding through the noise or waiting for confirmation?
Not financial advice. Always manage your risk.
#XRP #Accumulation #Pennant #Crypto
💎
40

·
--
ສັນຍານກະທິງ
🔶 $BNB /USDT | Range Breakout Watch
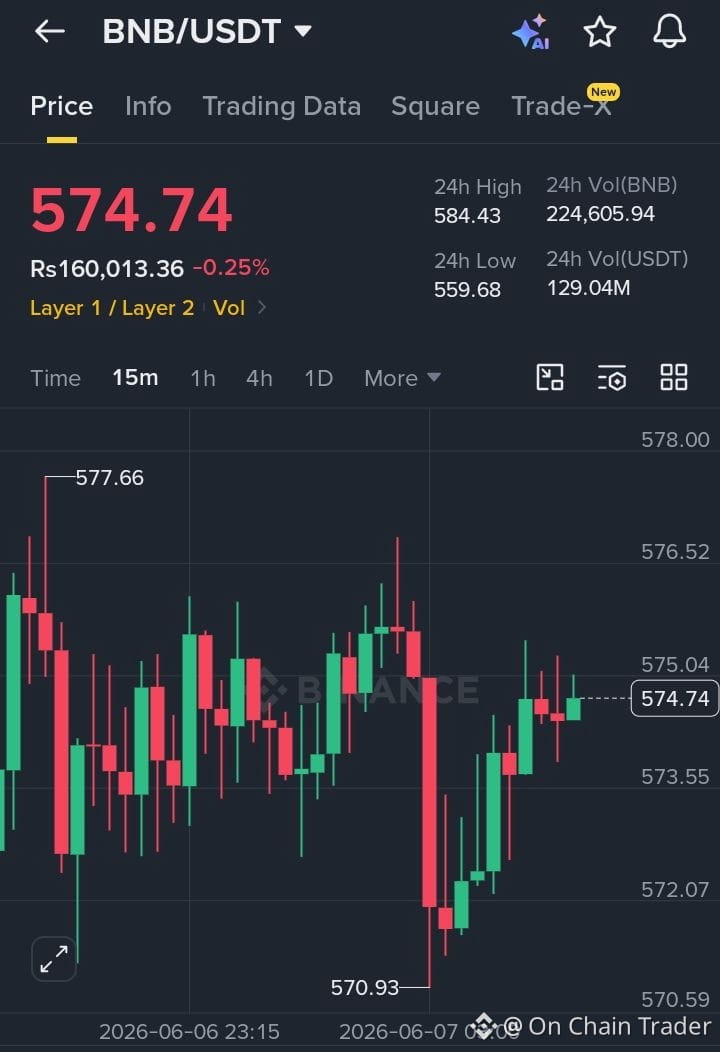
📊 Price: $574.74 | Consolidating after rejection near $584, forming a Bullish Pennant.
🟢 Entry: $572 – $575
🎯 Targets: $584 → $595 → $610
🛑 Stop Loss: $568
🔥 Market structure remains BULLISH while holding above $570 support. A breakout above $578–$584 could trigger strong upside momentum toward the $600+ zone.
#BNB #BNBUSDT #Crypto #Bullish #Pennant
🔶 $BNB /USDT | Range Breakout Watch
📊 Price: $574.74 | Consolidating after rejection near $584, forming a Bullish Pennant.
🟢 Entry: $572 – $575
🎯 Targets: $584 → $595 → $610
🛑 Stop Loss: $568
🔥 Market structure remains BULLISH while holding above $570 support. A breakout above $578–$584 could trigger strong upside momentum toward the $600+ zone.
#BNB #BNBUSDT #Crypto #Bullish #Pennant
📊 Price: $574.74 | Consolidating after rejection near $584, forming a Bullish Pennant.
🟢 Entry: $572 – $575
🎯 Targets: $584 → $595 → $610
🛑 Stop Loss: $568
🔥 Market structure remains BULLISH while holding above $570 support. A breakout above $578–$584 could trigger strong upside momentum toward the $600+ zone.
#BNB #BNBUSDT #Crypto #Bullish #Pennant
1
1
107
ເຂົ້າສູ່ລະບົບເພື່ອສຳຫຼວດເນື້ອຫາເພີ່ມເຕີມ
ເຂົ້າຮ່ວມກຸ່ມຜູ້ໃຊ້ຄຣິບໂຕທົ່ວໂລກໃນ Binance Square.
⚡️ ໄດ້ຮັບຂໍ້ມູນຫຼ້າສຸດ ແລະ ທີ່ມີປະໂຫຍດກ່ຽວກັບຄຣິບໂຕ.
💬 ໄດ້ຮັບຄວາມໄວ້ວາງໃຈຈາກຕະຫຼາດແລກປ່ຽນຄຣິບໂຕທີ່ໃຫຍ່ທີ່ສຸດໃນໂລກ.
👍 ຄົ້ນຫາຂໍ້ມູນເຊີງເລິກທີ່ແທ້ຈາກນັກສ້າງທີ່ໄດ້ຮັບການຢືນຢັນ.
ອີເມວ / ເບີໂທລະສັບ
ຫົວຂໍ້ທີ່ກໍາລັງນິຍົມ
1
#BinanceLaunchesBinanceIntelligence
492,063 views
3,344 ກຳລັງສົນທະນາ
2
#BitcoinTargets2026OpenAt$87570
3,467 views
90 ກຳລັງສົນທະນາ
3
#BitcoinRejectedAt$87KThirdTime
3,140 views
74 ກຳລັງສົນທະນາ
4
#StrategyMarketCapSurpassesRumble
20,872 views
527 ກຳລັງສົນທະນາ
5
#StriveBuys2000BTCFor$169M
15,164 views
143 ກຳລັງສົນທະນາ
6
#EvernorthXRPTreasuryCompletesSPACMerger
198,663 views
1,755 ກຳລັງສົນທະນາ
7
#ADAGains10%Above$0.27
72,065 views
262 ກຳລັງສົນທະນາ
8
#ETHUp70%InQ3ButLiquidityFalls
399,295 views
2,717 ກຳລັງສົນທະນາ
9
#EthStakingExitQueueHits2026High
170,761 views
1,771 ກຳລັງສົນທະນາ
10
#FedOctoberHoldOdds82.3%
192,079 views
1,705 ກຳລັງສົນທະນາ