
#exchangetransparency
exchangetransparency
46 ຄັ້ງທີ່ເບິ່ງ
5 ກຳລັງສົນທະນາ
ມາແຮງ
ຫຼ້າສຸດ
ບົດຄວາມ
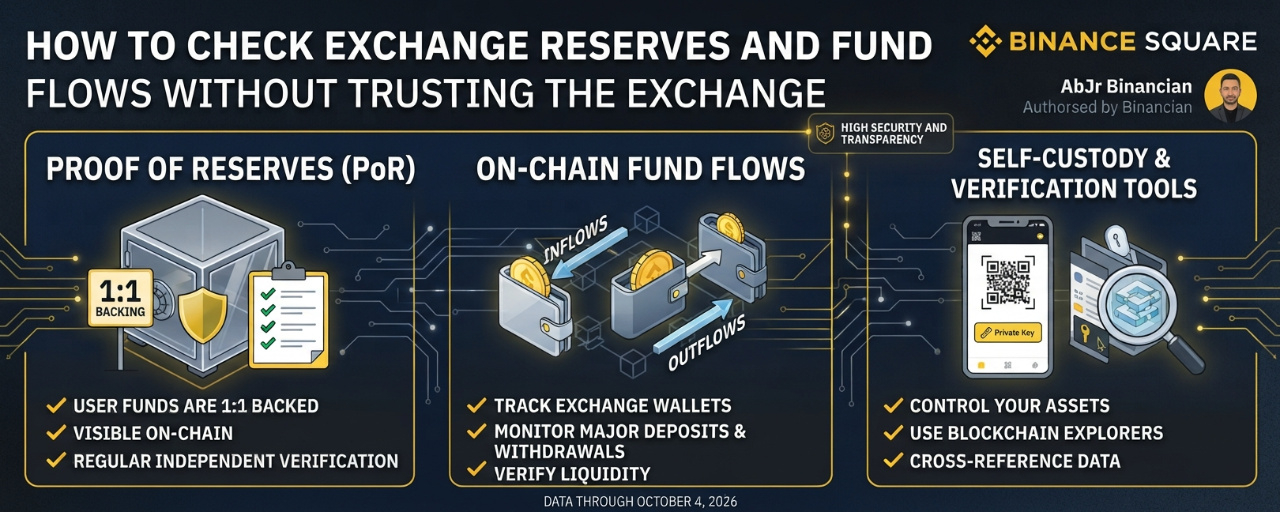
How to Check Exchange Reserves and Fund Flows Without Trusting the ExchangeIf you want to understand an exchange, don't rely on just one source of information.
Cryptocurrency exchanges publish information about their reserves, trading activity and platform performance.
But investors do not have to depend entirely on exchange announcements to understand what is happening.
Independent blockchain analytics providers, market-data platforms and research organizations offer tools that can help users examine exchange activity from different perspectives. The objective is not to find one perfect dashboard.
It is to combine independent sources and understand what each one actually measures.
Here are three useful platforms to start with.
1. CryptoQuant: Track Exchange Reserves and Netflows
<text color="secondary" size="xs">Platform: On-chain analytics</text>
CryptoQuant provides on-chain data and market indicators that help users examine cryptocurrency movements.
Two particularly useful metrics are:
Exchange Reserves
This indicator estimates the amount of cryptocurrency held in wallets attributed to exchanges.
Investors can monitor changes over time to identify whether estimated exchange-held balances are increasing or decreasing.
Exchange Netflows
Netflows help identify the difference between cryptocurrency entering and leaving exchange wallets.
This can provide useful context when evaluating market movements.
For example, a period of substantial outflows may indicate that assets are leaving exchange-associated wallets.
However, this does not automatically prove that investors are accumulating.
Transfers between exchanges, wallet reorganizations and changes in custody arrangements can also influence the figures.
How to use it:
Visit CryptoQuant.Select the cryptocurrency you want to analyze.Open the relevant exchange reserve or netflow chart.Select the exchange and time period where available.Compare the movement with price, trading volume and other market indicators.
2. Kaiko: Understand Liquidity Beyond Trading Volume
<text color="secondary" size="xs">Platform: Institutional market data</text>
Trading volume is one of the most commonly reported exchange metrics. But it does not tell the entire story.
Kaiko provides market-quality data that can help investors examine how efficiently assets can be traded.
Three indicators are particularly important.
Order-book depth
Shows how much buying and selling interest is available around the current market price.
Greater depth can help larger orders execute without significantly moving the market.
Bid-ask spread
Shows the difference between the best available buy and sell prices.
A smaller spread generally indicates better immediate trading conditions.
Slippage
Measures how much the execution price differs from the expected price.
This is especially important for larger trades and during periods of volatility.
How to use it:
Visit Kaiko's market-data resources.Select the asset and trading pair.Examine available market-depth and spread information.Compare equivalent trading pairs across exchanges.Review the same time periods to avoid misleading comparisons.
3. The Block: Monitor Derivatives and Market Structure
<text color="secondary" size="xs">Platform: Cryptocurrency research and data</text>
The Block provides cryptocurrency research, market statistics and derivatives-related data.
This can help investors understand market activity beyond spot trading.
Useful indicators include:
Futures trading volume
Shows the reported value of derivatives contracts traded during a given period.
Open interest
Measures the outstanding value of derivatives contracts that remain open.
Exchange market share
Provides context on how trading activity is distributed across different market participants and platforms, subject to the methodology and coverage of the data.
These metrics can help investors understand whether market activity is concentrated in spot markets or derivatives.
However, rising derivatives volume or open interest does not automatically indicate positive or negative market sentiment.
4. How to Combine These Three Sources
Each platform answers a different question.
The most useful approach is to examine the same asset, exchange and time period wherever possible.
For example, imagine an exchange reports a significant increase in trading activity.
Instead of immediately interpreting this as growing market confidence, examine:
Whether exchange reserves are increasing or decreasing.Whether the movement is accompanied by meaningful netflows.Whether order-book depth is improving.Whether bid-ask spreads remain competitive.Whether derivatives open interest is expanding.
This creates a more complete picture of market conditions.
5. Important Limitations to Remember
Independent data is valuable, but it is not automatically perfect.
Analytics providers use different methodologies, wallet-attribution systems and data coverage.
Some exchange wallets may not be identified correctly, while internal transfers can create movements that do not represent customer deposits or withdrawals.
Market-data coverage can also differ between providers.
Most importantly, on-chain reserves do not independently establish an exchange's complete financial position or prove that all customer liabilities are covered.
For that, users should also examine official Proof of Reserves reports, liability methodologies and available independent assurance.
Final Thoughts: Verify From More Than One Direction
Understanding an exchange requires more than reading its announcements or looking at a single reserve chart.
CryptoQuant helps examine on-chain reserves and fund movements.
Kaiko provides tools to evaluate market quality and liquidity.
The Block offers additional visibility into derivatives and market structure.
Together, these sources provide a broader analytical framework for understanding cryptocurrency exchanges.
The goal isn't to trust one dashboard more than another. It's to build your own conclusion from evidence that can be independently examined.
#Binance #CryptoQuant #Kaiko #TheBlock #ExchangeTransparency
How to Check Exchange Reserves and Fund Flows Without Trusting the Exchange
If you want to understand an exchange, don't rely on just one source of information.
Cryptocurrency exchanges publish information about their reserves, trading activity and platform performance.
But investors do not have to depend entirely on exchange announcements to understand what is happening.
Independent blockchain analytics providers, market-data platforms and research organizations offer tools that can help users examine exchange activity from different perspectives. The objective is not to find one perfect dashboard.
It is to combine independent sources and understand what each one actually measures.
Here are three useful platforms to start with.
1. CryptoQuant: Track Exchange Reserves and Netflows
<text color="secondary" size="xs">Platform: On-chain analytics</text>
CryptoQuant provides on-chain data and market indicators that help users examine cryptocurrency movements.
Two particularly useful metrics are:
Exchange Reserves
This indicator estimates the amount of cryptocurrency held in wallets attributed to exchanges.
Investors can monitor changes over time to identify whether estimated exchange-held balances are increasing or decreasing.
Exchange Netflows
Netflows help identify the difference between cryptocurrency entering and leaving exchange wallets.
This can provide useful context when evaluating market movements.
For example, a period of substantial outflows may indicate that assets are leaving exchange-associated wallets.
However, this does not automatically prove that investors are accumulating.
Transfers between exchanges, wallet reorganizations and changes in custody arrangements can also influence the figures.
How to use it:
Visit CryptoQuant.Select the cryptocurrency you want to analyze.Open the relevant exchange reserve or netflow chart.Select the exchange and time period where available.Compare the movement with price, trading volume and other market indicators.
2. Kaiko: Understand Liquidity Beyond Trading Volume
<text color="secondary" size="xs">Platform: Institutional market data</text>
Trading volume is one of the most commonly reported exchange metrics. But it does not tell the entire story.
Kaiko provides market-quality data that can help investors examine how efficiently assets can be traded.
Three indicators are particularly important.
Order-book depth
Shows how much buying and selling interest is available around the current market price.
Greater depth can help larger orders execute without significantly moving the market.
Bid-ask spread
Shows the difference between the best available buy and sell prices.
A smaller spread generally indicates better immediate trading conditions.
Slippage
Measures how much the execution price differs from the expected price.
This is especially important for larger trades and during periods of volatility.
How to use it:
Visit Kaiko's market-data resources.Select the asset and trading pair.Examine available market-depth and spread information.Compare equivalent trading pairs across exchanges.Review the same time periods to avoid misleading comparisons.
3. The Block: Monitor Derivatives and Market Structure
<text color="secondary" size="xs">Platform: Cryptocurrency research and data</text>
The Block provides cryptocurrency research, market statistics and derivatives-related data.
This can help investors understand market activity beyond spot trading.
Useful indicators include:
Futures trading volume
Shows the reported value of derivatives contracts traded during a given period.
Open interest
Measures the outstanding value of derivatives contracts that remain open.
Exchange market share
Provides context on how trading activity is distributed across different market participants and platforms, subject to the methodology and coverage of the data.
These metrics can help investors understand whether market activity is concentrated in spot markets or derivatives.
However, rising derivatives volume or open interest does not automatically indicate positive or negative market sentiment.
4. How to Combine These Three Sources
Each platform answers a different question.
The most useful approach is to examine the same asset, exchange and time period wherever possible.
For example, imagine an exchange reports a significant increase in trading activity.
Instead of immediately interpreting this as growing market confidence, examine:
Whether exchange reserves are increasing or decreasing.Whether the movement is accompanied by meaningful netflows.Whether order-book depth is improving.Whether bid-ask spreads remain competitive.Whether derivatives open interest is expanding.
This creates a more complete picture of market conditions.
5. Important Limitations to Remember
Independent data is valuable, but it is not automatically perfect.
Analytics providers use different methodologies, wallet-attribution systems and data coverage.
Some exchange wallets may not be identified correctly, while internal transfers can create movements that do not represent customer deposits or withdrawals.
Market-data coverage can also differ between providers.
Most importantly, on-chain reserves do not independently establish an exchange's complete financial position or prove that all customer liabilities are covered.
For that, users should also examine official Proof of Reserves reports, liability methodologies and available independent assurance.
Final Thoughts: Verify From More Than One Direction
Understanding an exchange requires more than reading its announcements or looking at a single reserve chart.
CryptoQuant helps examine on-chain reserves and fund movements.
Kaiko provides tools to evaluate market quality and liquidity.
The Block offers additional visibility into derivatives and market structure.
Together, these sources provide a broader analytical framework for understanding cryptocurrency exchanges.
The goal isn't to trust one dashboard more than another. It's to build your own conclusion from evidence that can be independently examined.
#Binance #CryptoQuant #Kaiko #TheBlock #ExchangeTransparency
Cryptocurrency exchanges publish information about their reserves, trading activity and platform performance.
But investors do not have to depend entirely on exchange announcements to understand what is happening.
Independent blockchain analytics providers, market-data platforms and research organizations offer tools that can help users examine exchange activity from different perspectives. The objective is not to find one perfect dashboard.
It is to combine independent sources and understand what each one actually measures.
Here are three useful platforms to start with.
1. CryptoQuant: Track Exchange Reserves and Netflows
<text color="secondary" size="xs">Platform: On-chain analytics</text>
CryptoQuant provides on-chain data and market indicators that help users examine cryptocurrency movements.
Two particularly useful metrics are:
Exchange Reserves
This indicator estimates the amount of cryptocurrency held in wallets attributed to exchanges.
Investors can monitor changes over time to identify whether estimated exchange-held balances are increasing or decreasing.
Exchange Netflows
Netflows help identify the difference between cryptocurrency entering and leaving exchange wallets.
This can provide useful context when evaluating market movements.
For example, a period of substantial outflows may indicate that assets are leaving exchange-associated wallets.
However, this does not automatically prove that investors are accumulating.
Transfers between exchanges, wallet reorganizations and changes in custody arrangements can also influence the figures.
How to use it:
Visit CryptoQuant.Select the cryptocurrency you want to analyze.Open the relevant exchange reserve or netflow chart.Select the exchange and time period where available.Compare the movement with price, trading volume and other market indicators.
2. Kaiko: Understand Liquidity Beyond Trading Volume
<text color="secondary" size="xs">Platform: Institutional market data</text>
Trading volume is one of the most commonly reported exchange metrics. But it does not tell the entire story.
Kaiko provides market-quality data that can help investors examine how efficiently assets can be traded.
Three indicators are particularly important.
Order-book depth
Shows how much buying and selling interest is available around the current market price.
Greater depth can help larger orders execute without significantly moving the market.
Bid-ask spread
Shows the difference between the best available buy and sell prices.
A smaller spread generally indicates better immediate trading conditions.
Slippage
Measures how much the execution price differs from the expected price.
This is especially important for larger trades and during periods of volatility.
How to use it:
Visit Kaiko's market-data resources.Select the asset and trading pair.Examine available market-depth and spread information.Compare equivalent trading pairs across exchanges.Review the same time periods to avoid misleading comparisons.
3. The Block: Monitor Derivatives and Market Structure
<text color="secondary" size="xs">Platform: Cryptocurrency research and data</text>
The Block provides cryptocurrency research, market statistics and derivatives-related data.
This can help investors understand market activity beyond spot trading.
Useful indicators include:
Futures trading volume
Shows the reported value of derivatives contracts traded during a given period.
Open interest
Measures the outstanding value of derivatives contracts that remain open.
Exchange market share
Provides context on how trading activity is distributed across different market participants and platforms, subject to the methodology and coverage of the data.
These metrics can help investors understand whether market activity is concentrated in spot markets or derivatives.
However, rising derivatives volume or open interest does not automatically indicate positive or negative market sentiment.
4. How to Combine These Three Sources
Each platform answers a different question.
The most useful approach is to examine the same asset, exchange and time period wherever possible.
For example, imagine an exchange reports a significant increase in trading activity.
Instead of immediately interpreting this as growing market confidence, examine:
Whether exchange reserves are increasing or decreasing.Whether the movement is accompanied by meaningful netflows.Whether order-book depth is improving.Whether bid-ask spreads remain competitive.Whether derivatives open interest is expanding.
This creates a more complete picture of market conditions.
5. Important Limitations to Remember
Independent data is valuable, but it is not automatically perfect.
Analytics providers use different methodologies, wallet-attribution systems and data coverage.
Some exchange wallets may not be identified correctly, while internal transfers can create movements that do not represent customer deposits or withdrawals.
Market-data coverage can also differ between providers.
Most importantly, on-chain reserves do not independently establish an exchange's complete financial position or prove that all customer liabilities are covered.
For that, users should also examine official Proof of Reserves reports, liability methodologies and available independent assurance.
Final Thoughts: Verify From More Than One Direction
Understanding an exchange requires more than reading its announcements or looking at a single reserve chart.
CryptoQuant helps examine on-chain reserves and fund movements.
Kaiko provides tools to evaluate market quality and liquidity.
The Block offers additional visibility into derivatives and market structure.
Together, these sources provide a broader analytical framework for understanding cryptocurrency exchanges.
The goal isn't to trust one dashboard more than another. It's to build your own conclusion from evidence that can be independently examined.
#Binance #CryptoQuant #Kaiko #TheBlock #ExchangeTransparency
59
ເຂົ້າສູ່ລະບົບເພື່ອສຳຫຼວດເນື້ອຫາເພີ່ມເຕີມ
ເຂົ້າຮ່ວມກຸ່ມຜູ້ໃຊ້ຄຣິບໂຕທົ່ວໂລກໃນ Binance Square.
⚡️ ໄດ້ຮັບຂໍ້ມູນຫຼ້າສຸດ ແລະ ທີ່ມີປະໂຫຍດກ່ຽວກັບຄຣິບໂຕ.
💬 ໄດ້ຮັບຄວາມໄວ້ວາງໃຈຈາກຕະຫຼາດແລກປ່ຽນຄຣິບໂຕທີ່ໃຫຍ່ທີ່ສຸດໃນໂລກ.
👍 ຄົ້ນຫາຂໍ້ມູນເຊີງເລິກທີ່ແທ້ຈາກນັກສ້າງທີ່ໄດ້ຮັບການຢືນຢັນ.
ອີເມວ / ເບີໂທລະສັບ
ຫົວຂໍ້ທີ່ກໍາລັງນິຍົມ
1
#BTCReboundsAbove$60KAmidWhaleDipBuying
95,087 ຄັ້ງທີ່ເບິ່ງ
416 ກຳລັງສົນທະນາ
2
#SolanaSets2027RoadmapToDoubleComputeCapacity
79,255 ຄັ້ງທີ່ເບິ່ງ
1,184 ກຳລັງສົນທະນາ
3
#CaliforniaNvidiaProbeExaminesPotentialCriminalViolations
21,820 ຄັ້ງທີ່ເບິ່ງ
177 ກຳລັງສົນທະນາ
4
#BlackRockLaunchesHKDollarDigitalLiquidityFund
67,572 ຄັ້ງທີ່ເບິ່ງ
866 ກຳລັງສົນທະນາ
5
#NvidiaLoses$2.7TrillionInMonthAndAHalf
85,486 ຄັ້ງທີ່ເບິ່ງ
343 ກຳລັງສົນທະນາ
6
#GlobalStocksFaceLongestLosingStreakSince2023
603,099 ຄັ້ງທີ່ເບິ່ງ
3,596 ກຳລັງສົນທະນາ
7
#BlackRockIBITPostsRecord$541MSingleDayOutflow
102,665 ຄັ້ງທີ່ເບິ່ງ
188 ກຳລັງສົນທະນາ
8
#AnthropicPlungesTowardIPOPriceonDay2
337,481 ຄັ້ງທີ່ເບິ່ງ
2,417 ກຳລັງສົນທະນາ
9
#TwentyOneCapitalAdds172.25BTC
185,070 ຄັ້ງທີ່ເບິ່ງ
1,719 ກຳລັງສົນທະນາ
10
#HKBillWouldExcludeTokenizedDepositsFromVirtualAssets
19,428 ຄັ້ງທີ່ເບິ່ງ
110 ກຳລັງສົນທະນາ