

#cryptonewsflash
cryptonewsflash
877,177 ຄັ້ງທີ່ເບິ່ງ
1,039 ກຳລັງສົນທະນາ
ມາແຮງ
ຫຼ້າສຸດ


ບົດຄວາມ
"Crypto Price Analysis, BTC, XRP, Lighter, PEPE and Venice, October 29"Bitcoin falls below $80,000 as XRP loses ground and Lighter and Venice drop over 7%. October 29 charts track BTC, XRP, LIT, PEPE and VVV support and resistance.
Bitcoin Gives Back Its Recovery Above the Weekend Highs
Bitcoin closed Wednesday at $81,287.10, up 0.60%, after reaching $81,709.10. That confirmed a daily close above the $80,919.20–$81,101 resistance area discussed in our October 27 report. The recovery, however, stopped near the 20-day exponential moving average.
The 20-day EMA fell to $81,704.82, while the 50-day EMA rose to $80,757.63. Wednesday’s close finished between them. The faster average remained above the slower one, so there was no new daily crossover; price had recovered the longer reference without holding above the shorter one.
The latest completed four-hour candle then closed at $79,738.30, below Wednesday’s $80,281.80 low and below both four-hour EMAs, at $80,609.36 and $80,949.16. This weakens the breakout before Thursday’s daily candle has closed.
A daily recovery above $80,281.80 and the 50-day EMA would repair part of that setback. A close above $81,709.10 would provide stronger confirmation toward the October 23 high of $81,942.70.
The early four-hour low at $79,614.80 is the nearest downside reference, followed by Tuesday’s $79,378.50 low. A daily close below the weekend floor at $79,120.80 would invalidate the broader recovery attempt.
XRP Loses Short-Term Support as RSI Slips
XRP closed Wednesday at $1.32536, down 0.34%, after reaching $1.34287. The session failed to hold Tuesday’s $1.32994 close and ended back below the $1.32950–$1.32990 resistance zone. It did, however, retain $1.31383 at the daily close.
The daily 14-period RSI, calculated with Wilder smoothing, eased to 45.14 from 45.84. Momentum remained below the neutral 50 level, showing that the preceding rebound had not established sustained daily strength.
The latest completed four-hour candle closed at $1.28884, below $1.31383 and marginally beneath Tuesday’s $1.28908 low. Its RSI fell to 42.39. That confirms a short-term loss of support, although a daily close is still needed to establish whether the breakdown persists.
A recovery above $1.30627, Wednesday’s low, and then $1.31383 would begin repairing the early decline. A daily close above $1.32994 and $1.34287 would offer stronger confirmation toward $1.36865.
Failure to recover leaves the October 26 low of $1.27106 in view. Losing Saturday’s $1.25330 floor would invalidate the broader rebound structure. The latest $1.29 price was 3.73% below the $1.34 recorded in Wednesday’s report, a separate comparison from the 24-hour change.
Lighter Falls Below Its October Floor on the Four-Hour Chart
Lighter closed Wednesday at $2.942, down 3.64%, after trading between $2.904 and $3.092. Both the high and low were below Tuesday’s, extending the retreat from the October 21 peak at $4.000.
Daily Bollinger Bands, using a 20-day simple moving average and two population standard deviations, placed the midpoint at $3.2744. It fell from $3.3075, while the lower band declined to $2.7627. Wednesday’s close remained inside the envelope but well below its falling midpoint.
The latest completed four-hour candle reached $2.756 and closed at $2.814. That close was below the October 18 low at $2.829 and below the four-hour lower band at $2.8821. It confirms short-term pressure; touching the lower daily band does not by itself establish an oversold reversal.
A daily close below $2.829 would confirm loss of the earlier October floor, with $2.756 the next observed price reference. A close beneath that fresh low would extend the breakdown.
For recovery, price first needs to regain $2.904–$2.942. A daily close above $3.092 would interrupt the latest sequence of lower highs and improve the approach to $3.165. Reclaiming the daily midpoint near $3.2744 would provide a stronger trend improvement. These band levels will change with subsequent closes.
PEPE Momentum Strengthens Without a Closing Break of Last Week’s High
PEPE closed Wednesday at $0.000005020, gaining 9.13%. The session reached $0.000005231, above the October 23 high of $0.000005108 discussed in Wednesday’s report, but closed back below that older high. The intraday breakout therefore lacked daily closing confirmation.
Daily MACD, using 12- and 26-period exponential averages with a nine-period signal EMA, strengthened. Expressed in millionths of a dollar, the line rose to 0.14995 against a 0.09527 signal. The histogram widened to 0.05468 from 0.02343. The line was already above its signal on the previous candle, so this was a stronger bullish gap rather than a new crossover.
Daily exchange turnover reached approximately 1.42 trillion PEPE, or 3.14 times the preceding 20-session average. That matching per-candle volume supports the significance of the advance, although it does not guarantee continuation.
The latest completed four-hour close was $0.000004953, below Wednesday’s close but with MACD still above its signal. A daily close above $0.000005108 and then $0.000005231 would strengthen the approach to September’s $0.000005353 high.
A close below $0.000004790 would weaken the recovery. Wednesday’s $0.000004563 low is the next support reference; losing Monday’s $0.000004206 low would invalidate the immediate rebound base.
Venice Token Breaks Its Weekend Low in Early Trading
Venice Token closed Wednesday at $24.197, falling 7.08% after a $23.630–$26.056 session. The candle had a lower high and lower low than Tuesday and erased most of that day’s recovery.
The daily 14-period Average True Range, using Wilder smoothing, edged up to $2.3627 from $2.3578. That equals approximately 9.76% of Wednesday’s closing price. Recent daily ranges remain large relative to price; ATR measures volatility and does not forecast the direction of the next move.
The latest completed four-hour candle fell to $22.518 before closing at $23.260. Its close was below both Wednesday’s $23.630 low and Saturday’s $23.350 floor. Four-hour ATR stood at $0.9394, emphasizing the size of the shorter-term swings.
A daily close below $23.350 would confirm the loss of weekend support. The next reference is the early-session $22.518 low, followed by the October 18 low of $20.992 if selling extends.
Reclaiming $23.630 would be an initial improvement. A daily close above $24.362, Tuesday’s low, would strengthen the rebound toward $26.056–$26.282. Until those levels are recovered, the early bounce from $22.518 remains within a weakened structure.
#CryptoNewsFlash
"Crypto Price Analysis, BTC, XRP, Lighter, PEPE and Venice, October 29"
Bitcoin falls below $80,000 as XRP loses ground and Lighter and Venice drop over 7%. October 29 charts track BTC, XRP, LIT, PEPE and VVV support and resistance.
Bitcoin Gives Back Its Recovery Above the Weekend Highs
Bitcoin closed Wednesday at $81,287.10, up 0.60%, after reaching $81,709.10. That confirmed a daily close above the $80,919.20–$81,101 resistance area discussed in our October 27 report. The recovery, however, stopped near the 20-day exponential moving average.
The 20-day EMA fell to $81,704.82, while the 50-day EMA rose to $80,757.63. Wednesday’s close finished between them. The faster average remained above the slower one, so there was no new daily crossover; price had recovered the longer reference without holding above the shorter one.
The latest completed four-hour candle then closed at $79,738.30, below Wednesday’s $80,281.80 low and below both four-hour EMAs, at $80,609.36 and $80,949.16. This weakens the breakout before Thursday’s daily candle has closed.
A daily recovery above $80,281.80 and the 50-day EMA would repair part of that setback. A close above $81,709.10 would provide stronger confirmation toward the October 23 high of $81,942.70.
The early four-hour low at $79,614.80 is the nearest downside reference, followed by Tuesday’s $79,378.50 low. A daily close below the weekend floor at $79,120.80 would invalidate the broader recovery attempt.
XRP Loses Short-Term Support as RSI Slips
XRP closed Wednesday at $1.32536, down 0.34%, after reaching $1.34287. The session failed to hold Tuesday’s $1.32994 close and ended back below the $1.32950–$1.32990 resistance zone. It did, however, retain $1.31383 at the daily close.
The daily 14-period RSI, calculated with Wilder smoothing, eased to 45.14 from 45.84. Momentum remained below the neutral 50 level, showing that the preceding rebound had not established sustained daily strength.
The latest completed four-hour candle closed at $1.28884, below $1.31383 and marginally beneath Tuesday’s $1.28908 low. Its RSI fell to 42.39. That confirms a short-term loss of support, although a daily close is still needed to establish whether the breakdown persists.
A recovery above $1.30627, Wednesday’s low, and then $1.31383 would begin repairing the early decline. A daily close above $1.32994 and $1.34287 would offer stronger confirmation toward $1.36865.
Failure to recover leaves the October 26 low of $1.27106 in view. Losing Saturday’s $1.25330 floor would invalidate the broader rebound structure. The latest $1.29 price was 3.73% below the $1.34 recorded in Wednesday’s report, a separate comparison from the 24-hour change.
Lighter Falls Below Its October Floor on the Four-Hour Chart
Lighter closed Wednesday at $2.942, down 3.64%, after trading between $2.904 and $3.092. Both the high and low were below Tuesday’s, extending the retreat from the October 21 peak at $4.000.
Daily Bollinger Bands, using a 20-day simple moving average and two population standard deviations, placed the midpoint at $3.2744. It fell from $3.3075, while the lower band declined to $2.7627. Wednesday’s close remained inside the envelope but well below its falling midpoint.
The latest completed four-hour candle reached $2.756 and closed at $2.814. That close was below the October 18 low at $2.829 and below the four-hour lower band at $2.8821. It confirms short-term pressure; touching the lower daily band does not by itself establish an oversold reversal.
A daily close below $2.829 would confirm loss of the earlier October floor, with $2.756 the next observed price reference. A close beneath that fresh low would extend the breakdown.
For recovery, price first needs to regain $2.904–$2.942. A daily close above $3.092 would interrupt the latest sequence of lower highs and improve the approach to $3.165. Reclaiming the daily midpoint near $3.2744 would provide a stronger trend improvement. These band levels will change with subsequent closes.
PEPE Momentum Strengthens Without a Closing Break of Last Week’s High
PEPE closed Wednesday at $0.000005020, gaining 9.13%. The session reached $0.000005231, above the October 23 high of $0.000005108 discussed in Wednesday’s report, but closed back below that older high. The intraday breakout therefore lacked daily closing confirmation.
Daily MACD, using 12- and 26-period exponential averages with a nine-period signal EMA, strengthened. Expressed in millionths of a dollar, the line rose to 0.14995 against a 0.09527 signal. The histogram widened to 0.05468 from 0.02343. The line was already above its signal on the previous candle, so this was a stronger bullish gap rather than a new crossover.
Daily exchange turnover reached approximately 1.42 trillion PEPE, or 3.14 times the preceding 20-session average. That matching per-candle volume supports the significance of the advance, although it does not guarantee continuation.
The latest completed four-hour close was $0.000004953, below Wednesday’s close but with MACD still above its signal. A daily close above $0.000005108 and then $0.000005231 would strengthen the approach to September’s $0.000005353 high.
A close below $0.000004790 would weaken the recovery. Wednesday’s $0.000004563 low is the next support reference; losing Monday’s $0.000004206 low would invalidate the immediate rebound base.
Venice Token Breaks Its Weekend Low in Early Trading
Venice Token closed Wednesday at $24.197, falling 7.08% after a $23.630–$26.056 session. The candle had a lower high and lower low than Tuesday and erased most of that day’s recovery.
The daily 14-period Average True Range, using Wilder smoothing, edged up to $2.3627 from $2.3578. That equals approximately 9.76% of Wednesday’s closing price. Recent daily ranges remain large relative to price; ATR measures volatility and does not forecast the direction of the next move.
The latest completed four-hour candle fell to $22.518 before closing at $23.260. Its close was below both Wednesday’s $23.630 low and Saturday’s $23.350 floor. Four-hour ATR stood at $0.9394, emphasizing the size of the shorter-term swings.
A daily close below $23.350 would confirm the loss of weekend support. The next reference is the early-session $22.518 low, followed by the October 18 low of $20.992 if selling extends.
Reclaiming $23.630 would be an initial improvement. A daily close above $24.362, Tuesday’s low, would strengthen the rebound toward $26.056–$26.282. Until those levels are recovered, the early bounce from $22.518 remains within a weakened structure.
#CryptoNewsFlash
Bitcoin Gives Back Its Recovery Above the Weekend Highs
Bitcoin closed Wednesday at $81,287.10, up 0.60%, after reaching $81,709.10. That confirmed a daily close above the $80,919.20–$81,101 resistance area discussed in our October 27 report. The recovery, however, stopped near the 20-day exponential moving average.
The 20-day EMA fell to $81,704.82, while the 50-day EMA rose to $80,757.63. Wednesday’s close finished between them. The faster average remained above the slower one, so there was no new daily crossover; price had recovered the longer reference without holding above the shorter one.
The latest completed four-hour candle then closed at $79,738.30, below Wednesday’s $80,281.80 low and below both four-hour EMAs, at $80,609.36 and $80,949.16. This weakens the breakout before Thursday’s daily candle has closed.
A daily recovery above $80,281.80 and the 50-day EMA would repair part of that setback. A close above $81,709.10 would provide stronger confirmation toward the October 23 high of $81,942.70.
The early four-hour low at $79,614.80 is the nearest downside reference, followed by Tuesday’s $79,378.50 low. A daily close below the weekend floor at $79,120.80 would invalidate the broader recovery attempt.
XRP Loses Short-Term Support as RSI Slips
XRP closed Wednesday at $1.32536, down 0.34%, after reaching $1.34287. The session failed to hold Tuesday’s $1.32994 close and ended back below the $1.32950–$1.32990 resistance zone. It did, however, retain $1.31383 at the daily close.
The daily 14-period RSI, calculated with Wilder smoothing, eased to 45.14 from 45.84. Momentum remained below the neutral 50 level, showing that the preceding rebound had not established sustained daily strength.
The latest completed four-hour candle closed at $1.28884, below $1.31383 and marginally beneath Tuesday’s $1.28908 low. Its RSI fell to 42.39. That confirms a short-term loss of support, although a daily close is still needed to establish whether the breakdown persists.
A recovery above $1.30627, Wednesday’s low, and then $1.31383 would begin repairing the early decline. A daily close above $1.32994 and $1.34287 would offer stronger confirmation toward $1.36865.
Failure to recover leaves the October 26 low of $1.27106 in view. Losing Saturday’s $1.25330 floor would invalidate the broader rebound structure. The latest $1.29 price was 3.73% below the $1.34 recorded in Wednesday’s report, a separate comparison from the 24-hour change.
Lighter Falls Below Its October Floor on the Four-Hour Chart
Lighter closed Wednesday at $2.942, down 3.64%, after trading between $2.904 and $3.092. Both the high and low were below Tuesday’s, extending the retreat from the October 21 peak at $4.000.
Daily Bollinger Bands, using a 20-day simple moving average and two population standard deviations, placed the midpoint at $3.2744. It fell from $3.3075, while the lower band declined to $2.7627. Wednesday’s close remained inside the envelope but well below its falling midpoint.
The latest completed four-hour candle reached $2.756 and closed at $2.814. That close was below the October 18 low at $2.829 and below the four-hour lower band at $2.8821. It confirms short-term pressure; touching the lower daily band does not by itself establish an oversold reversal.
A daily close below $2.829 would confirm loss of the earlier October floor, with $2.756 the next observed price reference. A close beneath that fresh low would extend the breakdown.
For recovery, price first needs to regain $2.904–$2.942. A daily close above $3.092 would interrupt the latest sequence of lower highs and improve the approach to $3.165. Reclaiming the daily midpoint near $3.2744 would provide a stronger trend improvement. These band levels will change with subsequent closes.
PEPE Momentum Strengthens Without a Closing Break of Last Week’s High
PEPE closed Wednesday at $0.000005020, gaining 9.13%. The session reached $0.000005231, above the October 23 high of $0.000005108 discussed in Wednesday’s report, but closed back below that older high. The intraday breakout therefore lacked daily closing confirmation.
Daily MACD, using 12- and 26-period exponential averages with a nine-period signal EMA, strengthened. Expressed in millionths of a dollar, the line rose to 0.14995 against a 0.09527 signal. The histogram widened to 0.05468 from 0.02343. The line was already above its signal on the previous candle, so this was a stronger bullish gap rather than a new crossover.
Daily exchange turnover reached approximately 1.42 trillion PEPE, or 3.14 times the preceding 20-session average. That matching per-candle volume supports the significance of the advance, although it does not guarantee continuation.
The latest completed four-hour close was $0.000004953, below Wednesday’s close but with MACD still above its signal. A daily close above $0.000005108 and then $0.000005231 would strengthen the approach to September’s $0.000005353 high.
A close below $0.000004790 would weaken the recovery. Wednesday’s $0.000004563 low is the next support reference; losing Monday’s $0.000004206 low would invalidate the immediate rebound base.
Venice Token Breaks Its Weekend Low in Early Trading
Venice Token closed Wednesday at $24.197, falling 7.08% after a $23.630–$26.056 session. The candle had a lower high and lower low than Tuesday and erased most of that day’s recovery.
The daily 14-period Average True Range, using Wilder smoothing, edged up to $2.3627 from $2.3578. That equals approximately 9.76% of Wednesday’s closing price. Recent daily ranges remain large relative to price; ATR measures volatility and does not forecast the direction of the next move.
The latest completed four-hour candle fell to $22.518 before closing at $23.260. Its close was below both Wednesday’s $23.630 low and Saturday’s $23.350 floor. Four-hour ATR stood at $0.9394, emphasizing the size of the shorter-term swings.
A daily close below $23.350 would confirm the loss of weekend support. The next reference is the early-session $22.518 low, followed by the October 18 low of $20.992 if selling extends.
Reclaiming $23.630 would be an initial improvement. A daily close above $24.362, Tuesday’s low, would strengthen the rebound toward $26.056–$26.282. Until those levels are recovered, the early bounce from $22.518 remains within a weakened structure.
#CryptoNewsFlash
418

·
--
🚨 BITCOIN'S BIGGEST QUESTION RIGHT NOW: WHY IS THE MARKET STILL UNDER PRESSURE?
📉 While Bitcoin struggles to hold above $82,000, institutional money is sending a more complicated signal.
On October 20, reports showed that BlackRock’s IBIT Bitcoin ETF attracted approximately $665 million in inflows, its largest daily inflow since October 2025. Meanwhile, Bitcoin traded lower amid broader market uncertainty.
So, what does this mean? 🤔
🔹 Institutional demand still matters. Large inflows can signal investor interest, but one day of buying doesn't guarantee a sustained rally.
🔹 Macroeconomic conditions matter too. Rising oil prices, inflation concerns, and interest-rate expectations can influence investors’ willingness to hold risky assets.
🔹 Short-term price movements don't tell the whole story. Bitcoin can experience selling pressure even when some investors continue accumulating through ETFs.
🎯 The key question isn't simply whether Bitcoin is going up or down.
It's whether demand can remain strong enough to overcome selling pressure and broader economic uncertainty.
⚠️ Remember: ETF inflows are only one piece of the puzzle. They don't guarantee that Bitcoin will rise, and they shouldn't be treated as a standalone buy signal.
💬 What's your take? Can institutional demand support Bitcoin's next recovery, or does the market need stronger confirmation first?
#bitcoin in #btc70k TC #CryptoNewsFlash ews #BlackRock #BitcoinWarnings inETF #Binance
🚨 BITCOIN'S BIGGEST QUESTION RIGHT NOW: WHY IS THE MARKET STILL UNDER PRESSURE?
📉 While Bitcoin struggles to hold above $82,000, institutional money is sending a more complicated signal.
On October 20, reports showed that BlackRock’s IBIT Bitcoin ETF attracted approximately $665 million in inflows, its largest daily inflow since October 2025. Meanwhile, Bitcoin traded lower amid broader market uncertainty.
So, what does this mean? 🤔
🔹 Institutional demand still matters. Large inflows can signal investor interest, but one day of buying doesn't guarantee a sustained rally.
🔹 Macroeconomic conditions matter too. Rising oil prices, inflation concerns, and interest-rate expectations can influence investors’ willingness to hold risky assets.
🔹 Short-term price movements don't tell the whole story. Bitcoin can experience selling pressure even when some investors continue accumulating through ETFs.
🎯 The key question isn't simply whether Bitcoin is going up or down.
It's whether demand can remain strong enough to overcome selling pressure and broader economic uncertainty.
⚠️ Remember: ETF inflows are only one piece of the puzzle. They don't guarantee that Bitcoin will rise, and they shouldn't be treated as a standalone buy signal.
💬 What's your take? Can institutional demand support Bitcoin's next recovery, or does the market need stronger confirmation first?
#bitcoin in #btc70k TC #CryptoNewsFlash ews #BlackRock #BitcoinWarnings inETF #Binance
📉 While Bitcoin struggles to hold above $82,000, institutional money is sending a more complicated signal.
On October 20, reports showed that BlackRock’s IBIT Bitcoin ETF attracted approximately $665 million in inflows, its largest daily inflow since October 2025. Meanwhile, Bitcoin traded lower amid broader market uncertainty.
So, what does this mean? 🤔
🔹 Institutional demand still matters. Large inflows can signal investor interest, but one day of buying doesn't guarantee a sustained rally.
🔹 Macroeconomic conditions matter too. Rising oil prices, inflation concerns, and interest-rate expectations can influence investors’ willingness to hold risky assets.
🔹 Short-term price movements don't tell the whole story. Bitcoin can experience selling pressure even when some investors continue accumulating through ETFs.
🎯 The key question isn't simply whether Bitcoin is going up or down.
It's whether demand can remain strong enough to overcome selling pressure and broader economic uncertainty.
⚠️ Remember: ETF inflows are only one piece of the puzzle. They don't guarantee that Bitcoin will rise, and they shouldn't be treated as a standalone buy signal.
💬 What's your take? Can institutional demand support Bitcoin's next recovery, or does the market need stronger confirmation first?
#bitcoin in #btc70k TC #CryptoNewsFlash ews #BlackRock #BitcoinWarnings inETF #Binance
BTC+0,56%
IBITETF-4,42%
79
ບົດຄວາມ
"Crypto Price Analysis, BTC, ETH, SOL, AERO and ONDO, October 20"Bitcoin holds near $82,000 as Ethereum lags and Solana, Aerodrome and Ondo edge higher. October 20 analysis tracks key support, resistance, and daily signals.
Bitcoin’s MACD Improves Without a Bullish Crossover
Bitcoin closed October 19 at $81,843.70, down 0.19%, after reaching $83,100. The session traded above the $82,538–$82,826 resistance area identified in Monday’s report but failed to hold above it at the close. That was an intraday move through resistance, not a confirmed daily breakout.
Daily MACD, using 12- and 26-period exponential averages with a nine-period signal EMA, remained bearish. Its line fell to −10.68 against a 393.08 signal.
The histogram improved to −403.76 from −456.84, indicating a narrowing gap between the lines rather than a bullish crossover. The MACD line also crossed below zero on the completed candle.
The latest completed four-hour histogram was positive at 73.83, showing stronger short-term momentum than the daily reading.
CoinGecko’s quote was nevertheless 0.50% below Monday’s $82,428 report snapshot, a separate comparison from its rolling 24-hour change.
A daily close above $83,100 would strengthen a recovery toward $84,049–$84,250, the cluster of October 12–14 highs.
Losing $81,648 on a daily close would weaken the latest rebound and expose $80,568. A close below the October 15 low at $79,709 would invalidate that recovery structure.
Ethereum’s RSI Remains Below Neutral
Ethereum closed at $2,405.43, slipping 0.09% after a $2,382.78–$2,443.70 session. The daily chart remains below the October 16 high at $2,490.84 and the earlier $2,527–$2,535 resistance area, leaving the broader October pullback intact.
The 14-day RSI, calculated with Wilder smoothing, eased to 37.87 from 38.03. It remained below the neutral 50 line without reaching the conventional 30 oversold threshold.
This points to weak momentum, not a standalone signal that a rebound is due. Four-hour RSI was firmer at 47.54 but also below neutral.
Ethereum’s aggregate quote was 0.60% below the $2,425.66 snapshot in the October 17 edition.
The earlier downside reference at $2,313.42 remains intact, although subsequent sessions have not produced a sustained recovery.
A daily close above $2,443.70 would improve the immediate structure and bring $2,490.84 into focus. Clearing that second level would strengthen the case for a test of $2,527–$2,535.
Conversely, a close below $2,382.78 would expose $2,354.01 and $2,326.25. Losing $2,313.42 on a daily close would invalidate the developing base.
Solana Rebounds Beneath Two Falling Averages
Solana gained 0.89% on its completed daily candle to close at $104.95. That extended the recovery from Sunday’s $100.34 low, but the close remained below the 50-day exponential moving average at $106.75 and the 20-day EMA at $108.96.
Both averages declined from the previous session. The faster 20-day average remained above the 50-day average, so the chart did not produce a new bearish crossover.
The relevant signal is simpler: price remains beneath two falling trend references.
Four-hour price action was less weak. The latest completed close stood above its 20-period EMA at $104.28 but below the 50-period EMA at $106.01.
This supports a short-term rebound interpretation without overturning the daily trend.
A daily close above Monday’s $106.08 high would put the 50-day EMA in reach. A subsequent close above $108.91–$108.96, where the October 13 high meets the 20-day EMA, would materially improve the recovery toward $111.92–$113.27.
Failure to hold $103.43 would weaken that scenario and bring $101.00 into view. A daily close below $100.34 would invalidate the latest rebound.
Aerodrome Loses Support Despite Its 24-Hour Gain
Aerodrome’s positive rolling return contrasts with a weaker completed daily chart. It closed October 19 at $0.7957, down 0.39%, following Sunday’s close below $0.8300. The October 16 report had identified that level as the invalidation point for the earlier recovery.
The latest aggregate quote was 12.08% below that report’s $0.919539 snapshot. This is a multi-day comparison, not the coin’s current 24-hour performance.
Daily Bollinger Bands, using a 20-day simple moving average and two population standard deviations, placed the midpoint at $0.8516 and the lower band at $0.7481.
Price remained below the midpoint but inside the bands. The reading shows a weakened recovery, not an automatic buy signal near the lower band.
Monday’s $0.7636 low nearly matched the October 2 low at $0.7635, establishing a visible support test.
A daily close above $0.8090 would be an initial improvement; reclaiming $0.8516–$0.8574 would recover the band midpoint and Sunday’s high, strengthening a move toward $0.9045.
A close below $0.7635 would invalidate the support hold and expose the lower-band reference near $0.7481, which will change with subsequent closes.
Ondo Tests the First Retracement of Its Latest Decline
Ondo closed at $0.43493, up 0.10%, after recovering from Sunday’s $0.41049 low. The rebound remained small relative to the decline from the October 12 swing high at $0.53150.
Fibonacci levels measure an upward retracement of that specific October 12–18 downswing.
The 23.6% level is $0.43905, 38.2% is $0.45672, the 50% midpoint is $0.47100 and 61.8% is $0.48527. Monday’s completed close remained below the first level.
The live October 20 Kraken candle subsequently reached $0.44373 and last traded at $0.44139 in the captured response.
That put price above 23.6% intraday, but it did not confirm a daily close above the retracement.
A daily close above $0.44496, Sunday’s high, would strengthen the rebound toward $0.45672.
Clearing that level would improve the approach to $0.47100 and the October 16 high at $0.47649. A daily close below $0.42764 would weaken the immediate recovery, with $0.42200 and $0.41049 next.
A new low below $0.41049 would invalidate these retracement anchors and require recalculation.
#CryptoNewsFlash
"Crypto Price Analysis, BTC, ETH, SOL, AERO and ONDO, October 20"
Bitcoin holds near $82,000 as Ethereum lags and Solana, Aerodrome and Ondo edge higher. October 20 analysis tracks key support, resistance, and daily signals.
Bitcoin’s MACD Improves Without a Bullish Crossover
Bitcoin closed October 19 at $81,843.70, down 0.19%, after reaching $83,100. The session traded above the $82,538–$82,826 resistance area identified in Monday’s report but failed to hold above it at the close. That was an intraday move through resistance, not a confirmed daily breakout.
Daily MACD, using 12- and 26-period exponential averages with a nine-period signal EMA, remained bearish. Its line fell to −10.68 against a 393.08 signal.
The histogram improved to −403.76 from −456.84, indicating a narrowing gap between the lines rather than a bullish crossover. The MACD line also crossed below zero on the completed candle.
The latest completed four-hour histogram was positive at 73.83, showing stronger short-term momentum than the daily reading.
CoinGecko’s quote was nevertheless 0.50% below Monday’s $82,428 report snapshot, a separate comparison from its rolling 24-hour change.
A daily close above $83,100 would strengthen a recovery toward $84,049–$84,250, the cluster of October 12–14 highs.
Losing $81,648 on a daily close would weaken the latest rebound and expose $80,568. A close below the October 15 low at $79,709 would invalidate that recovery structure.
Ethereum’s RSI Remains Below Neutral
Ethereum closed at $2,405.43, slipping 0.09% after a $2,382.78–$2,443.70 session. The daily chart remains below the October 16 high at $2,490.84 and the earlier $2,527–$2,535 resistance area, leaving the broader October pullback intact.
The 14-day RSI, calculated with Wilder smoothing, eased to 37.87 from 38.03. It remained below the neutral 50 line without reaching the conventional 30 oversold threshold.
This points to weak momentum, not a standalone signal that a rebound is due. Four-hour RSI was firmer at 47.54 but also below neutral.
Ethereum’s aggregate quote was 0.60% below the $2,425.66 snapshot in the October 17 edition.
The earlier downside reference at $2,313.42 remains intact, although subsequent sessions have not produced a sustained recovery.
A daily close above $2,443.70 would improve the immediate structure and bring $2,490.84 into focus. Clearing that second level would strengthen the case for a test of $2,527–$2,535.
Conversely, a close below $2,382.78 would expose $2,354.01 and $2,326.25. Losing $2,313.42 on a daily close would invalidate the developing base.
Solana Rebounds Beneath Two Falling Averages
Solana gained 0.89% on its completed daily candle to close at $104.95. That extended the recovery from Sunday’s $100.34 low, but the close remained below the 50-day exponential moving average at $106.75 and the 20-day EMA at $108.96.
Both averages declined from the previous session. The faster 20-day average remained above the 50-day average, so the chart did not produce a new bearish crossover.
The relevant signal is simpler: price remains beneath two falling trend references.
Four-hour price action was less weak. The latest completed close stood above its 20-period EMA at $104.28 but below the 50-period EMA at $106.01.
This supports a short-term rebound interpretation without overturning the daily trend.
A daily close above Monday’s $106.08 high would put the 50-day EMA in reach. A subsequent close above $108.91–$108.96, where the October 13 high meets the 20-day EMA, would materially improve the recovery toward $111.92–$113.27.
Failure to hold $103.43 would weaken that scenario and bring $101.00 into view. A daily close below $100.34 would invalidate the latest rebound.
Aerodrome Loses Support Despite Its 24-Hour Gain
Aerodrome’s positive rolling return contrasts with a weaker completed daily chart. It closed October 19 at $0.7957, down 0.39%, following Sunday’s close below $0.8300. The October 16 report had identified that level as the invalidation point for the earlier recovery.
The latest aggregate quote was 12.08% below that report’s $0.919539 snapshot. This is a multi-day comparison, not the coin’s current 24-hour performance.
Daily Bollinger Bands, using a 20-day simple moving average and two population standard deviations, placed the midpoint at $0.8516 and the lower band at $0.7481.
Price remained below the midpoint but inside the bands. The reading shows a weakened recovery, not an automatic buy signal near the lower band.
Monday’s $0.7636 low nearly matched the October 2 low at $0.7635, establishing a visible support test.
A daily close above $0.8090 would be an initial improvement; reclaiming $0.8516–$0.8574 would recover the band midpoint and Sunday’s high, strengthening a move toward $0.9045.
A close below $0.7635 would invalidate the support hold and expose the lower-band reference near $0.7481, which will change with subsequent closes.
Ondo Tests the First Retracement of Its Latest Decline
Ondo closed at $0.43493, up 0.10%, after recovering from Sunday’s $0.41049 low. The rebound remained small relative to the decline from the October 12 swing high at $0.53150.
Fibonacci levels measure an upward retracement of that specific October 12–18 downswing.
The 23.6% level is $0.43905, 38.2% is $0.45672, the 50% midpoint is $0.47100 and 61.8% is $0.48527. Monday’s completed close remained below the first level.
The live October 20 Kraken candle subsequently reached $0.44373 and last traded at $0.44139 in the captured response.
That put price above 23.6% intraday, but it did not confirm a daily close above the retracement.
A daily close above $0.44496, Sunday’s high, would strengthen the rebound toward $0.45672.
Clearing that level would improve the approach to $0.47100 and the October 16 high at $0.47649. A daily close below $0.42764 would weaken the immediate recovery, with $0.42200 and $0.41049 next.
A new low below $0.41049 would invalidate these retracement anchors and require recalculation.
#CryptoNewsFlash
Bitcoin’s MACD Improves Without a Bullish Crossover
Bitcoin closed October 19 at $81,843.70, down 0.19%, after reaching $83,100. The session traded above the $82,538–$82,826 resistance area identified in Monday’s report but failed to hold above it at the close. That was an intraday move through resistance, not a confirmed daily breakout.
Daily MACD, using 12- and 26-period exponential averages with a nine-period signal EMA, remained bearish. Its line fell to −10.68 against a 393.08 signal.
The histogram improved to −403.76 from −456.84, indicating a narrowing gap between the lines rather than a bullish crossover. The MACD line also crossed below zero on the completed candle.
The latest completed four-hour histogram was positive at 73.83, showing stronger short-term momentum than the daily reading.
CoinGecko’s quote was nevertheless 0.50% below Monday’s $82,428 report snapshot, a separate comparison from its rolling 24-hour change.
A daily close above $83,100 would strengthen a recovery toward $84,049–$84,250, the cluster of October 12–14 highs.
Losing $81,648 on a daily close would weaken the latest rebound and expose $80,568. A close below the October 15 low at $79,709 would invalidate that recovery structure.
Ethereum’s RSI Remains Below Neutral
Ethereum closed at $2,405.43, slipping 0.09% after a $2,382.78–$2,443.70 session. The daily chart remains below the October 16 high at $2,490.84 and the earlier $2,527–$2,535 resistance area, leaving the broader October pullback intact.
The 14-day RSI, calculated with Wilder smoothing, eased to 37.87 from 38.03. It remained below the neutral 50 line without reaching the conventional 30 oversold threshold.
This points to weak momentum, not a standalone signal that a rebound is due. Four-hour RSI was firmer at 47.54 but also below neutral.
Ethereum’s aggregate quote was 0.60% below the $2,425.66 snapshot in the October 17 edition.
The earlier downside reference at $2,313.42 remains intact, although subsequent sessions have not produced a sustained recovery.
A daily close above $2,443.70 would improve the immediate structure and bring $2,490.84 into focus. Clearing that second level would strengthen the case for a test of $2,527–$2,535.
Conversely, a close below $2,382.78 would expose $2,354.01 and $2,326.25. Losing $2,313.42 on a daily close would invalidate the developing base.
Solana Rebounds Beneath Two Falling Averages
Solana gained 0.89% on its completed daily candle to close at $104.95. That extended the recovery from Sunday’s $100.34 low, but the close remained below the 50-day exponential moving average at $106.75 and the 20-day EMA at $108.96.
Both averages declined from the previous session. The faster 20-day average remained above the 50-day average, so the chart did not produce a new bearish crossover.
The relevant signal is simpler: price remains beneath two falling trend references.
Four-hour price action was less weak. The latest completed close stood above its 20-period EMA at $104.28 but below the 50-period EMA at $106.01.
This supports a short-term rebound interpretation without overturning the daily trend.
A daily close above Monday’s $106.08 high would put the 50-day EMA in reach. A subsequent close above $108.91–$108.96, where the October 13 high meets the 20-day EMA, would materially improve the recovery toward $111.92–$113.27.
Failure to hold $103.43 would weaken that scenario and bring $101.00 into view. A daily close below $100.34 would invalidate the latest rebound.
Aerodrome Loses Support Despite Its 24-Hour Gain
Aerodrome’s positive rolling return contrasts with a weaker completed daily chart. It closed October 19 at $0.7957, down 0.39%, following Sunday’s close below $0.8300. The October 16 report had identified that level as the invalidation point for the earlier recovery.
The latest aggregate quote was 12.08% below that report’s $0.919539 snapshot. This is a multi-day comparison, not the coin’s current 24-hour performance.
Daily Bollinger Bands, using a 20-day simple moving average and two population standard deviations, placed the midpoint at $0.8516 and the lower band at $0.7481.
Price remained below the midpoint but inside the bands. The reading shows a weakened recovery, not an automatic buy signal near the lower band.
Monday’s $0.7636 low nearly matched the October 2 low at $0.7635, establishing a visible support test.
A daily close above $0.8090 would be an initial improvement; reclaiming $0.8516–$0.8574 would recover the band midpoint and Sunday’s high, strengthening a move toward $0.9045.
A close below $0.7635 would invalidate the support hold and expose the lower-band reference near $0.7481, which will change with subsequent closes.
Ondo Tests the First Retracement of Its Latest Decline
Ondo closed at $0.43493, up 0.10%, after recovering from Sunday’s $0.41049 low. The rebound remained small relative to the decline from the October 12 swing high at $0.53150.
Fibonacci levels measure an upward retracement of that specific October 12–18 downswing.
The 23.6% level is $0.43905, 38.2% is $0.45672, the 50% midpoint is $0.47100 and 61.8% is $0.48527. Monday’s completed close remained below the first level.
The live October 20 Kraken candle subsequently reached $0.44373 and last traded at $0.44139 in the captured response.
That put price above 23.6% intraday, but it did not confirm a daily close above the retracement.
A daily close above $0.44496, Sunday’s high, would strengthen the rebound toward $0.45672.
Clearing that level would improve the approach to $0.47100 and the October 16 high at $0.47649. A daily close below $0.42764 would weaken the immediate recovery, with $0.42200 and $0.41049 next.
A new low below $0.41049 would invalidate these retracement anchors and require recalculation.
#CryptoNewsFlash
163
ບົດຄວາມ
"SEC Lawsuit No Longer Excuse for Poor XRP Price Performance"Pro-XRP lawyer Bill Morgan has argued that the SEC lawsuit can no longer serve as an excuse for XRP’s disappointing price performance.
In an X post, he noted that the coin has continued to decline despite the legal dispute’s resolution. Specifically, Morgan said XRP had fallen 45% over the past 12 months and approximately 60% since the litigation with the U.S. Securities and Exchange Commission (SEC) was resolved on August 7, 2025.
“The lawsuit cannot be an excuse all the time for XRP’s current price. That excuse is getting quite old,” Morgan wrote.
He described the legal dispute as an “overrated and exaggerated excuse,” arguing that positive developments in the case often lifted XRP’s price temporarily, but those gains were largely reversed afterward.
Morgan Questions Lasting Impact of SEC Lawsuit Resolution
Morgan acknowledged that favorable developments in the lawsuit had positively affected XRP’s price. However, he argued that these reactions were short-lived and failed to translate into sustained gains.
According to the lawyer, even the resolution of the case did not produce a lasting positive effect on XRP’s market performance. For instance, XRP traded above $3.6 in July 2025. By the time the cases ended in August 2025, the price was already reversing and has remained so since then.
Morgan also suggested that anticipation surrounding the settlement had a greater impact on the token’s price in the months leading up to the resolution. Much of that price appreciation, however, has since reversed, as XRP is trading 60% below the price at the time.
Essentially, Morgan’s comments challenge the argument that regulatory uncertainty remains the primary explanation for XRP’s underperformance.
“SEC Lawsuit Held Back by XRP”
Morgan’s remarks came in response to XRP influencer Digital Asset Investor, who argued that XRP’s legal battle with the SEC set it apart from other major cryptocurrencies.
Digital Asset Investor pointed out that XRP was the only digital asset on a referenced list to face a five-year SEC lawsuit. He claimed that XRP had previously surpassed Ethereum and was moving toward Bitcoin before the legal attacks began.
Reflecting on conversations with Ripple representatives at Evernorth’s Nasdaq listing, the influencer said he received a clear message that the obstacles facing the company had been removed.
“All roadblocks have been removed,” he wrote.
The post followed data showing XRP trading around $1.33, approximately 62.5% below its January 2018 peak. Meanwhile, Bitcoin, Ethereum, and several other top cryptocurrencies are trading far above their 2017/2018 highs.
XRP Faces Questions Post-Lawsuit
The divergent opinions in the XRP community show how much responsibility the SEC lawsuit bears for the token’s price performance.
While Digital Asset Investor maintains that the legal battle placed XRP at a disadvantage compared with other top cryptocurrencies, Morgan believes the lawsuit cannot indefinitely explain XRP’s struggles, especially since its resolution failed to deliver lasting price gains.
#CryptoNewsFlash
"SEC Lawsuit No Longer Excuse for Poor XRP Price Performance"
Pro-XRP lawyer Bill Morgan has argued that the SEC lawsuit can no longer serve as an excuse for XRP’s disappointing price performance.
In an X post, he noted that the coin has continued to decline despite the legal dispute’s resolution. Specifically, Morgan said XRP had fallen 45% over the past 12 months and approximately 60% since the litigation with the U.S. Securities and Exchange Commission (SEC) was resolved on August 7, 2025.
“The lawsuit cannot be an excuse all the time for XRP’s current price. That excuse is getting quite old,” Morgan wrote.
He described the legal dispute as an “overrated and exaggerated excuse,” arguing that positive developments in the case often lifted XRP’s price temporarily, but those gains were largely reversed afterward.
Morgan Questions Lasting Impact of SEC Lawsuit Resolution
Morgan acknowledged that favorable developments in the lawsuit had positively affected XRP’s price. However, he argued that these reactions were short-lived and failed to translate into sustained gains.
According to the lawyer, even the resolution of the case did not produce a lasting positive effect on XRP’s market performance. For instance, XRP traded above $3.6 in July 2025. By the time the cases ended in August 2025, the price was already reversing and has remained so since then.
Morgan also suggested that anticipation surrounding the settlement had a greater impact on the token’s price in the months leading up to the resolution. Much of that price appreciation, however, has since reversed, as XRP is trading 60% below the price at the time.
Essentially, Morgan’s comments challenge the argument that regulatory uncertainty remains the primary explanation for XRP’s underperformance.
“SEC Lawsuit Held Back by XRP”
Morgan’s remarks came in response to XRP influencer Digital Asset Investor, who argued that XRP’s legal battle with the SEC set it apart from other major cryptocurrencies.
Digital Asset Investor pointed out that XRP was the only digital asset on a referenced list to face a five-year SEC lawsuit. He claimed that XRP had previously surpassed Ethereum and was moving toward Bitcoin before the legal attacks began.
Reflecting on conversations with Ripple representatives at Evernorth’s Nasdaq listing, the influencer said he received a clear message that the obstacles facing the company had been removed.
“All roadblocks have been removed,” he wrote.
The post followed data showing XRP trading around $1.33, approximately 62.5% below its January 2018 peak. Meanwhile, Bitcoin, Ethereum, and several other top cryptocurrencies are trading far above their 2017/2018 highs.
XRP Faces Questions Post-Lawsuit
The divergent opinions in the XRP community show how much responsibility the SEC lawsuit bears for the token’s price performance.
While Digital Asset Investor maintains that the legal battle placed XRP at a disadvantage compared with other top cryptocurrencies, Morgan believes the lawsuit cannot indefinitely explain XRP’s struggles, especially since its resolution failed to deliver lasting price gains.
#CryptoNewsFlash
In an X post, he noted that the coin has continued to decline despite the legal dispute’s resolution. Specifically, Morgan said XRP had fallen 45% over the past 12 months and approximately 60% since the litigation with the U.S. Securities and Exchange Commission (SEC) was resolved on August 7, 2025.
“The lawsuit cannot be an excuse all the time for XRP’s current price. That excuse is getting quite old,” Morgan wrote.
He described the legal dispute as an “overrated and exaggerated excuse,” arguing that positive developments in the case often lifted XRP’s price temporarily, but those gains were largely reversed afterward.
Morgan Questions Lasting Impact of SEC Lawsuit Resolution
Morgan acknowledged that favorable developments in the lawsuit had positively affected XRP’s price. However, he argued that these reactions were short-lived and failed to translate into sustained gains.
According to the lawyer, even the resolution of the case did not produce a lasting positive effect on XRP’s market performance. For instance, XRP traded above $3.6 in July 2025. By the time the cases ended in August 2025, the price was already reversing and has remained so since then.
Morgan also suggested that anticipation surrounding the settlement had a greater impact on the token’s price in the months leading up to the resolution. Much of that price appreciation, however, has since reversed, as XRP is trading 60% below the price at the time.
Essentially, Morgan’s comments challenge the argument that regulatory uncertainty remains the primary explanation for XRP’s underperformance.
“SEC Lawsuit Held Back by XRP”
Morgan’s remarks came in response to XRP influencer Digital Asset Investor, who argued that XRP’s legal battle with the SEC set it apart from other major cryptocurrencies.
Digital Asset Investor pointed out that XRP was the only digital asset on a referenced list to face a five-year SEC lawsuit. He claimed that XRP had previously surpassed Ethereum and was moving toward Bitcoin before the legal attacks began.
Reflecting on conversations with Ripple representatives at Evernorth’s Nasdaq listing, the influencer said he received a clear message that the obstacles facing the company had been removed.
“All roadblocks have been removed,” he wrote.
The post followed data showing XRP trading around $1.33, approximately 62.5% below its January 2018 peak. Meanwhile, Bitcoin, Ethereum, and several other top cryptocurrencies are trading far above their 2017/2018 highs.
XRP Faces Questions Post-Lawsuit
The divergent opinions in the XRP community show how much responsibility the SEC lawsuit bears for the token’s price performance.
While Digital Asset Investor maintains that the legal battle placed XRP at a disadvantage compared with other top cryptocurrencies, Morgan believes the lawsuit cannot indefinitely explain XRP’s struggles, especially since its resolution failed to deliver lasting price gains.
#CryptoNewsFlash
285
ບົດຄວາມ
"Bitcoin Update: Bitcoin Drops 7%, U.S. Holdings Fall by 17,468 BTC"#Bitcoin falls 7% as U.S. government BTC transfers coincide with rising short-term holder selling, while $74.6K emerges as a key support benchmark.
Bitcoin has fallen about 7% from its recent high as large U.S. government-linked transfers arrived at a time when traders were already sitting on sizable unrealized gains.
CryptoQuant argues that the government activity acted as the trigger, while elevated profits and rising short-term holder selling left the market vulnerable to a deeper pullback.
CryptoQuant’s tracked U.S. government wallet set has declined by 17,468 BTC since Oct. 6, worth about $1.44 billion at the respective transfer values.
The movements came in three stages: 569 BTC on Oct. 6, 4,632 BTC on Oct. 7 and another 12,267 BTC on Oct. 8.
The latest 12,267 BTC movement involved Bitcoin recovered from the 2016 Bitfinex hack.
U.S. Government Holdings Drop Sharply
The first chart focuses on the latest changes in government-linked holdings. It highlights the three recent reductions, with the Oct. 8 movement by far the largest at 12,267 BTC.
The second chart puts those moves into a longer historical context. CryptoQuant’s tracked seized-Bitcoin balance rose sharply during major government seizures, peaked above 200,000 BTC, and has since declined.
Bitcoin Holders Were Already Sitting on Large Gains
The third chart helps explain why the market may have reacted strongly to the transfers.
It tracks the unrealized profit and loss of Bitcoin held for between one and three months. The cohort had moved back into positive territory, leaving many recent buyers sitting on gains before the latest decline.
That creates a different market environment from one where most traders are already underwater. When unrealized profits are elevated, a negative catalyst can encourage holders to protect those gains by selling.
In CryptoQuant’s interpretation, the government transfers were therefore more of a catalyst than the underlying weakness.
Short-Term Holders Send 45.6K BTC to Exchanges
The fourth chart shows selling pressure becoming more visible.
Short-term holders sent approximately 45,600 BTC to exchanges over 24 hours. The chart itself divides that flow into around 20,700 BTC moved at a profit and 24,900 BTC moved at a loss.
That loss-side flow is notable because it shows some newer holders are no longer simply taking profits; they are also sending coins to exchanges after falling below their acquisition prices.
This raises the risk of more forced or emotional selling if Bitcoin continues lower.
$74.6K Becomes the Bigger Structural Test
The fifth chart turns attention away from the immediate volatility and toward the broader trend.
Bitcoin’s Short-Term Holder Realized Price sits near $74,600, representing the average acquisition cost of the short-term holder cohort.
CryptoQuant treats this as an important level for the current market structure. Remaining above it would leave Bitcoin trading above the average cost basis of recent buyers.
A sustained move below it would put a much larger portion of the short-term holder base underwater and could increase selling pressure.
For now, Bitcoin remains comfortably above that level. But the combination of government-linked transfers, elevated unrealized profits and 45,600 BTC moving toward exchanges shows why the latest 7% decline has attracted attention.
The government transactions may have provided the spark. Whether the pullback develops into something larger now depends more on holder behavior—and whether Bitcoin can remain well above the $74,600 short-term cost basis.
#CryptoNewsFlash
"Bitcoin Update: Bitcoin Drops 7%, U.S. Holdings Fall by 17,468 BTC"
#Bitcoin falls 7% as U.S. government BTC transfers coincide with rising short-term holder selling, while $74.6K emerges as a key support benchmark.
Bitcoin has fallen about 7% from its recent high as large U.S. government-linked transfers arrived at a time when traders were already sitting on sizable unrealized gains.
CryptoQuant argues that the government activity acted as the trigger, while elevated profits and rising short-term holder selling left the market vulnerable to a deeper pullback.
CryptoQuant’s tracked U.S. government wallet set has declined by 17,468 BTC since Oct. 6, worth about $1.44 billion at the respective transfer values.
The movements came in three stages: 569 BTC on Oct. 6, 4,632 BTC on Oct. 7 and another 12,267 BTC on Oct. 8.
The latest 12,267 BTC movement involved Bitcoin recovered from the 2016 Bitfinex hack.
U.S. Government Holdings Drop Sharply
The first chart focuses on the latest changes in government-linked holdings. It highlights the three recent reductions, with the Oct. 8 movement by far the largest at 12,267 BTC.
The second chart puts those moves into a longer historical context. CryptoQuant’s tracked seized-Bitcoin balance rose sharply during major government seizures, peaked above 200,000 BTC, and has since declined.
Bitcoin Holders Were Already Sitting on Large Gains
The third chart helps explain why the market may have reacted strongly to the transfers.
It tracks the unrealized profit and loss of Bitcoin held for between one and three months. The cohort had moved back into positive territory, leaving many recent buyers sitting on gains before the latest decline.
That creates a different market environment from one where most traders are already underwater. When unrealized profits are elevated, a negative catalyst can encourage holders to protect those gains by selling.
In CryptoQuant’s interpretation, the government transfers were therefore more of a catalyst than the underlying weakness.
Short-Term Holders Send 45.6K BTC to Exchanges
The fourth chart shows selling pressure becoming more visible.
Short-term holders sent approximately 45,600 BTC to exchanges over 24 hours. The chart itself divides that flow into around 20,700 BTC moved at a profit and 24,900 BTC moved at a loss.
That loss-side flow is notable because it shows some newer holders are no longer simply taking profits; they are also sending coins to exchanges after falling below their acquisition prices.
This raises the risk of more forced or emotional selling if Bitcoin continues lower.
$74.6K Becomes the Bigger Structural Test
The fifth chart turns attention away from the immediate volatility and toward the broader trend.
Bitcoin’s Short-Term Holder Realized Price sits near $74,600, representing the average acquisition cost of the short-term holder cohort.
CryptoQuant treats this as an important level for the current market structure. Remaining above it would leave Bitcoin trading above the average cost basis of recent buyers.
A sustained move below it would put a much larger portion of the short-term holder base underwater and could increase selling pressure.
For now, Bitcoin remains comfortably above that level. But the combination of government-linked transfers, elevated unrealized profits and 45,600 BTC moving toward exchanges shows why the latest 7% decline has attracted attention.
The government transactions may have provided the spark. Whether the pullback develops into something larger now depends more on holder behavior—and whether Bitcoin can remain well above the $74,600 short-term cost basis.
#CryptoNewsFlash
Bitcoin has fallen about 7% from its recent high as large U.S. government-linked transfers arrived at a time when traders were already sitting on sizable unrealized gains.
CryptoQuant argues that the government activity acted as the trigger, while elevated profits and rising short-term holder selling left the market vulnerable to a deeper pullback.
CryptoQuant’s tracked U.S. government wallet set has declined by 17,468 BTC since Oct. 6, worth about $1.44 billion at the respective transfer values.
The movements came in three stages: 569 BTC on Oct. 6, 4,632 BTC on Oct. 7 and another 12,267 BTC on Oct. 8.
The latest 12,267 BTC movement involved Bitcoin recovered from the 2016 Bitfinex hack.
U.S. Government Holdings Drop Sharply
The first chart focuses on the latest changes in government-linked holdings. It highlights the three recent reductions, with the Oct. 8 movement by far the largest at 12,267 BTC.
The second chart puts those moves into a longer historical context. CryptoQuant’s tracked seized-Bitcoin balance rose sharply during major government seizures, peaked above 200,000 BTC, and has since declined.
Bitcoin Holders Were Already Sitting on Large Gains
The third chart helps explain why the market may have reacted strongly to the transfers.
It tracks the unrealized profit and loss of Bitcoin held for between one and three months. The cohort had moved back into positive territory, leaving many recent buyers sitting on gains before the latest decline.
That creates a different market environment from one where most traders are already underwater. When unrealized profits are elevated, a negative catalyst can encourage holders to protect those gains by selling.
In CryptoQuant’s interpretation, the government transfers were therefore more of a catalyst than the underlying weakness.
Short-Term Holders Send 45.6K BTC to Exchanges
The fourth chart shows selling pressure becoming more visible.
Short-term holders sent approximately 45,600 BTC to exchanges over 24 hours. The chart itself divides that flow into around 20,700 BTC moved at a profit and 24,900 BTC moved at a loss.
That loss-side flow is notable because it shows some newer holders are no longer simply taking profits; they are also sending coins to exchanges after falling below their acquisition prices.
This raises the risk of more forced or emotional selling if Bitcoin continues lower.
$74.6K Becomes the Bigger Structural Test
The fifth chart turns attention away from the immediate volatility and toward the broader trend.
Bitcoin’s Short-Term Holder Realized Price sits near $74,600, representing the average acquisition cost of the short-term holder cohort.
CryptoQuant treats this as an important level for the current market structure. Remaining above it would leave Bitcoin trading above the average cost basis of recent buyers.
A sustained move below it would put a much larger portion of the short-term holder base underwater and could increase selling pressure.
For now, Bitcoin remains comfortably above that level. But the combination of government-linked transfers, elevated unrealized profits and 45,600 BTC moving toward exchanges shows why the latest 7% decline has attracted attention.
The government transactions may have provided the spark. Whether the pullback develops into something larger now depends more on holder behavior—and whether Bitcoin can remain well above the $74,600 short-term cost basis.
#CryptoNewsFlash
1
1
499

·
--
$BTC
$ETH
$SOL
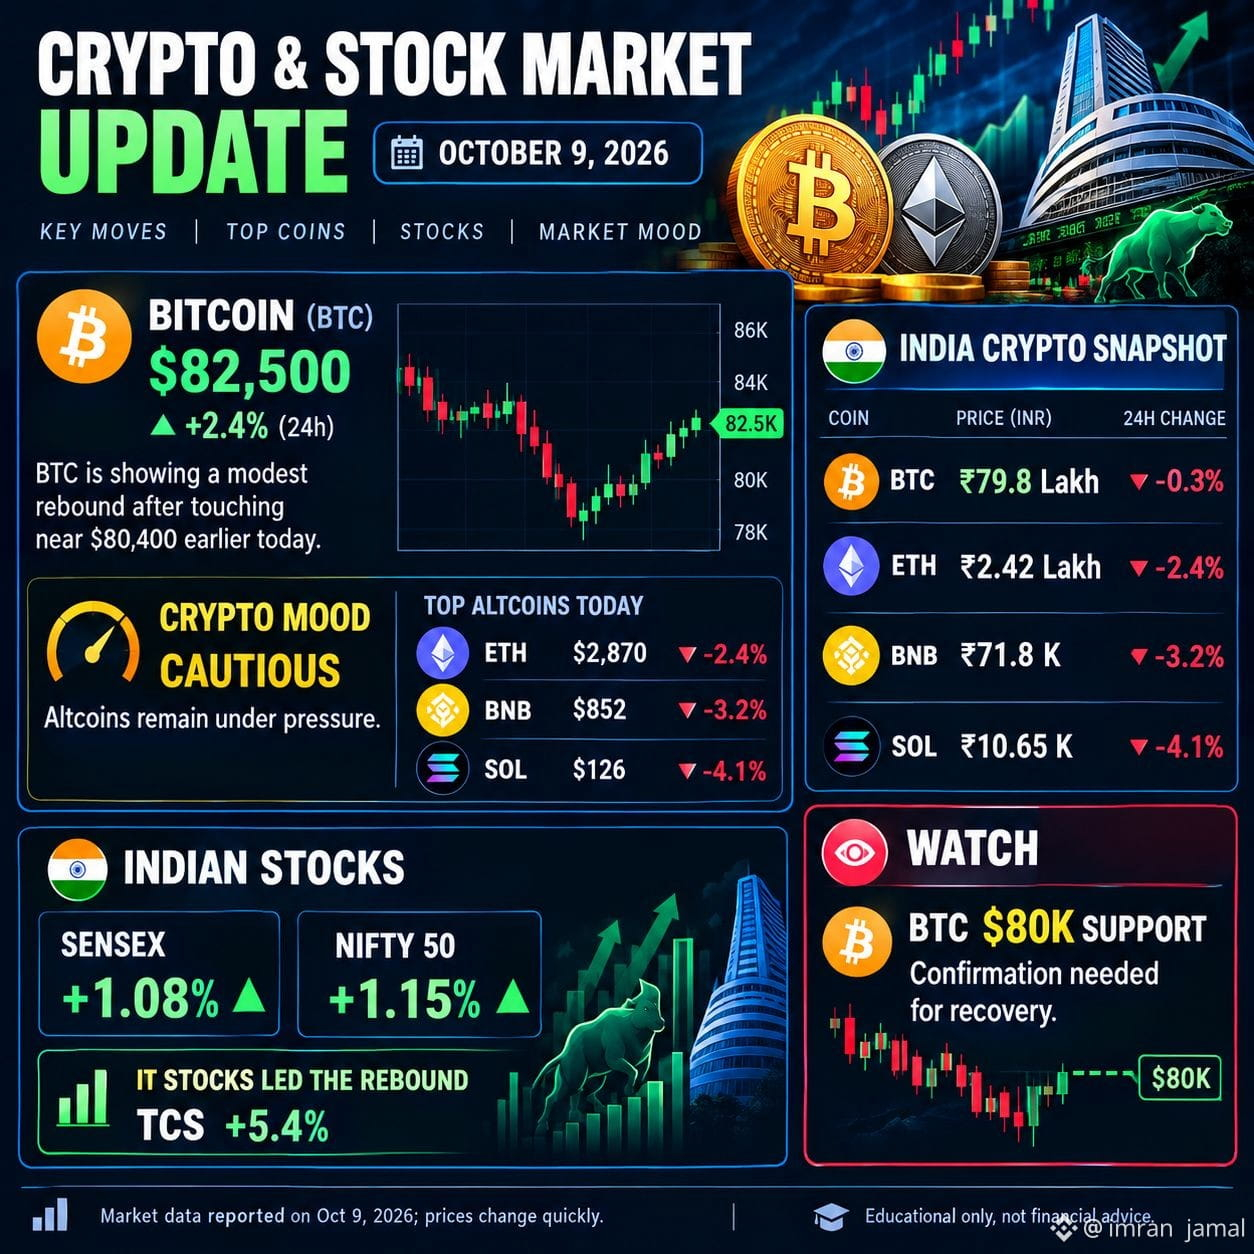
📊 Crypto & Stock Market Update — October 9, 2026
Bitcoin and major altcoins are facing selling pressure, while Indian stocks have rebounded, led by IT shares. Bitcoin has recovered slightly after testing the $80,000 area, but the broader crypto market remains cautious. �
Barron's +2
Writing
🚨 CRYPTO & STOCK MARKET UPDATE 📊 📅 October 9, 2026
🪙 CRYPTO MARKET NEWS
₿ Bitcoin (BTC): Trading under pressure after testing support near $80,000. A sustained recovery above $82,000 could improve short-term sentiment.
🔵 Ethereum (ETH): Facing selling pressure as traders remain cautious.
🟡 BNB: Under pressure alongside the broader market.
🟣 Solana (SOL): Showing weakness as altcoins experience heavier selling.
📉 Market Sentiment: CAUTIOUS — volatility remains elevated.
📈 INDIAN STOCK MARKET
🇮🇳 Nifty 50: +1.15% 🇮🇳 Sensex: +1.08% 💻 IT stocks led the recovery. 🔥 TCS gained 5.4% following strong quarterly results.
🎯 WHAT TRADERS SHOULD WATCH • BTC holding the $80,000 support area. • A confirmed BTC breakout above $82,000. • ETH price action and altcoin recovery. • Trading volume and broader market sentiment.
⚠️ Trading Reminder: Avoid chasing sudden price movements. Wait for confirmation and manage risk carefully.
📌 Follow for daily crypto, Bitcoin, altcoin and stock market updates!
#CryptoNewsFlash #bitcoin.” #BTC、 #Ethereum! #Solana #BNBToken #StockMarket #Nifty50 #Trading
$BTC
$ETH
$SOL
📊 Crypto & Stock Market Update — October 9, 2026
Bitcoin and major altcoins are facing selling pressure, while Indian stocks have rebounded, led by IT shares. Bitcoin has recovered slightly after testing the $80,000 area, but the broader crypto market remains cautious. �
Barron's +2
Writing
🚨 CRYPTO & STOCK MARKET UPDATE 📊 📅 October 9, 2026
🪙 CRYPTO MARKET NEWS
₿ Bitcoin (BTC): Trading under pressure after testing support near $80,000. A sustained recovery above $82,000 could improve short-term sentiment.
🔵 Ethereum (ETH): Facing selling pressure as traders remain cautious.
🟡 BNB: Under pressure alongside the broader market.
🟣 Solana (SOL): Showing weakness as altcoins experience heavier selling.
📉 Market Sentiment: CAUTIOUS — volatility remains elevated.
📈 INDIAN STOCK MARKET
🇮🇳 Nifty 50: +1.15% 🇮🇳 Sensex: +1.08% 💻 IT stocks led the recovery. 🔥 TCS gained 5.4% following strong quarterly results.
🎯 WHAT TRADERS SHOULD WATCH • BTC holding the $80,000 support area. • A confirmed BTC breakout above $82,000. • ETH price action and altcoin recovery. • Trading volume and broader market sentiment.
⚠️ Trading Reminder: Avoid chasing sudden price movements. Wait for confirmation and manage risk carefully.
📌 Follow for daily crypto, Bitcoin, altcoin and stock market updates!
#CryptoNewsFlash #bitcoin.” #BTC、 #Ethereum! #Solana #BNBToken #StockMarket #Nifty50 #Trading
$ETH
$SOL
📊 Crypto & Stock Market Update — October 9, 2026
Bitcoin and major altcoins are facing selling pressure, while Indian stocks have rebounded, led by IT shares. Bitcoin has recovered slightly after testing the $80,000 area, but the broader crypto market remains cautious. �
Barron's +2
Writing
🚨 CRYPTO & STOCK MARKET UPDATE 📊 📅 October 9, 2026
🪙 CRYPTO MARKET NEWS
₿ Bitcoin (BTC): Trading under pressure after testing support near $80,000. A sustained recovery above $82,000 could improve short-term sentiment.
🔵 Ethereum (ETH): Facing selling pressure as traders remain cautious.
🟡 BNB: Under pressure alongside the broader market.
🟣 Solana (SOL): Showing weakness as altcoins experience heavier selling.
📉 Market Sentiment: CAUTIOUS — volatility remains elevated.
📈 INDIAN STOCK MARKET
🇮🇳 Nifty 50: +1.15% 🇮🇳 Sensex: +1.08% 💻 IT stocks led the recovery. 🔥 TCS gained 5.4% following strong quarterly results.
🎯 WHAT TRADERS SHOULD WATCH • BTC holding the $80,000 support area. • A confirmed BTC breakout above $82,000. • ETH price action and altcoin recovery. • Trading volume and broader market sentiment.
⚠️ Trading Reminder: Avoid chasing sudden price movements. Wait for confirmation and manage risk carefully.
📌 Follow for daily crypto, Bitcoin, altcoin and stock market updates!
#CryptoNewsFlash #bitcoin.” #BTC、 #Ethereum! #Solana #BNBToken #StockMarket #Nifty50 #Trading
62
ບົດຄວາມ
"Bitcoin Analyst Says Cardano (ADA) Is Setting Tone for Another Parabolic Run"Bitcoin analyst with 1.9M X followers, Lucky Luciano, believes #Cardano (ADA) price is preparing for a major rally after breaking out of a long-term downtrend.
“In my opinion, ADA is setting its tone for another parabolic run,” Luciano wrote on October 5, sharing an ADA/USDT daily chart.
The chart shows ADA price breaking above a downward trendline that had been in place since September 2025. After months of trading around a key support area, ADA finally moved above the trendline.
At the time, ADA was trading near $0.27, up about 5% for the day. Meanwhile, Luciano’s chart points to a potential target around 60% higher.
ADA has already started showing stronger momentum. The token recently moved above $0.1387 and traded around $0.276 on October 6, opening the door to $0.30 as the rally advances.
ADA Breaks Its Long-Term Downtrend
Luciano’s chart shows ADA in a long-term downtrend that started after its highs in mid-2025 around $1.0165. The price continued falling before finding support in a demand zone at $0.1387 in June after a massive dip of 86%.
Meanwhile, ADA then broke above the downward trendline, marking a shift in the trend. Cardano moved above $0.26 in September, extending its recovery from the lower prices recorded during the summer. With ADA price hitting $0.2759 this week, the coin has recovered by over 90%.
Notably, other indicators confirm the improving momentum. As of today, Cardano’s daily chart on TradingView showed ADA trading above its 50-day and 200-day moving averages. The MACD is also bullish, while the RSI is close to 70, confirming strong upward momentum.
Can ADA Continue Rising?
Now, ADA’s next major test is the $0.28-$0.30 range, a key resistance area. A breakout above this zone opens the path toward $0.39, representing about a 40% increase from the levels cited in that analysis.
Meanwhile, a weekly chart analysis identifies $0.23–$0.27 as critical support. Holding this zone would preserve the bullish setup, while a breakout above the $0.30–$0.40 resistance area could signal further upside.
Accordingly, the next major targets would be $0.80 and $1.30. Clearing both opens the path toward $3.10, near ADA’s previous all-time high. However, a weekly close below $0.14 would invalidate the bullish setup.
Cardano is currently around $0.2733, up 1.41% in 24 hours, 9% over the past week, and 22% over the past month.
Interestingly, many analysts are becoming increasingly ambitious as ADA’s price continues to improve, with some already calling for $5 and $10 highs.
#CryptoNewsFlash
"Bitcoin Analyst Says Cardano (ADA) Is Setting Tone for Another Parabolic Run"
Bitcoin analyst with 1.9M X followers, Lucky Luciano, believes #Cardano (ADA) price is preparing for a major rally after breaking out of a long-term downtrend.
“In my opinion, ADA is setting its tone for another parabolic run,” Luciano wrote on October 5, sharing an ADA/USDT daily chart.
The chart shows ADA price breaking above a downward trendline that had been in place since September 2025. After months of trading around a key support area, ADA finally moved above the trendline.
At the time, ADA was trading near $0.27, up about 5% for the day. Meanwhile, Luciano’s chart points to a potential target around 60% higher.
ADA has already started showing stronger momentum. The token recently moved above $0.1387 and traded around $0.276 on October 6, opening the door to $0.30 as the rally advances.
ADA Breaks Its Long-Term Downtrend
Luciano’s chart shows ADA in a long-term downtrend that started after its highs in mid-2025 around $1.0165. The price continued falling before finding support in a demand zone at $0.1387 in June after a massive dip of 86%.
Meanwhile, ADA then broke above the downward trendline, marking a shift in the trend. Cardano moved above $0.26 in September, extending its recovery from the lower prices recorded during the summer. With ADA price hitting $0.2759 this week, the coin has recovered by over 90%.
Notably, other indicators confirm the improving momentum. As of today, Cardano’s daily chart on TradingView showed ADA trading above its 50-day and 200-day moving averages. The MACD is also bullish, while the RSI is close to 70, confirming strong upward momentum.
Can ADA Continue Rising?
Now, ADA’s next major test is the $0.28-$0.30 range, a key resistance area. A breakout above this zone opens the path toward $0.39, representing about a 40% increase from the levels cited in that analysis.
Meanwhile, a weekly chart analysis identifies $0.23–$0.27 as critical support. Holding this zone would preserve the bullish setup, while a breakout above the $0.30–$0.40 resistance area could signal further upside.
Accordingly, the next major targets would be $0.80 and $1.30. Clearing both opens the path toward $3.10, near ADA’s previous all-time high. However, a weekly close below $0.14 would invalidate the bullish setup.
Cardano is currently around $0.2733, up 1.41% in 24 hours, 9% over the past week, and 22% over the past month.
Interestingly, many analysts are becoming increasingly ambitious as ADA’s price continues to improve, with some already calling for $5 and $10 highs.
#CryptoNewsFlash
“In my opinion, ADA is setting its tone for another parabolic run,” Luciano wrote on October 5, sharing an ADA/USDT daily chart.
The chart shows ADA price breaking above a downward trendline that had been in place since September 2025. After months of trading around a key support area, ADA finally moved above the trendline.
At the time, ADA was trading near $0.27, up about 5% for the day. Meanwhile, Luciano’s chart points to a potential target around 60% higher.
ADA has already started showing stronger momentum. The token recently moved above $0.1387 and traded around $0.276 on October 6, opening the door to $0.30 as the rally advances.
ADA Breaks Its Long-Term Downtrend
Luciano’s chart shows ADA in a long-term downtrend that started after its highs in mid-2025 around $1.0165. The price continued falling before finding support in a demand zone at $0.1387 in June after a massive dip of 86%.
Meanwhile, ADA then broke above the downward trendline, marking a shift in the trend. Cardano moved above $0.26 in September, extending its recovery from the lower prices recorded during the summer. With ADA price hitting $0.2759 this week, the coin has recovered by over 90%.
Notably, other indicators confirm the improving momentum. As of today, Cardano’s daily chart on TradingView showed ADA trading above its 50-day and 200-day moving averages. The MACD is also bullish, while the RSI is close to 70, confirming strong upward momentum.
Can ADA Continue Rising?
Now, ADA’s next major test is the $0.28-$0.30 range, a key resistance area. A breakout above this zone opens the path toward $0.39, representing about a 40% increase from the levels cited in that analysis.
Meanwhile, a weekly chart analysis identifies $0.23–$0.27 as critical support. Holding this zone would preserve the bullish setup, while a breakout above the $0.30–$0.40 resistance area could signal further upside.
Accordingly, the next major targets would be $0.80 and $1.30. Clearing both opens the path toward $3.10, near ADA’s previous all-time high. However, a weekly close below $0.14 would invalidate the bullish setup.
Cardano is currently around $0.2733, up 1.41% in 24 hours, 9% over the past week, and 22% over the past month.
Interestingly, many analysts are becoming increasingly ambitious as ADA’s price continues to improve, with some already calling for $5 and $10 highs.
#CryptoNewsFlash
669
ບົດຄວາມ
"Citi Raises Strategy Price Target to $240 as Higher Bitcoin Forecast Lifts MSTR Outlook"Citi raises its Strategy price target to $240 from $136 as a higher Bitcoin forecast and expected mNAV expansion strengthen its MSTR outlook.
Citi has raised its price target for Strategy (MSTR) to $240 from $136 while keeping a Buy rating on the stock. The revision follows the bank’s higher Bitcoin forecast, with Citi now expecting BTC to reach about $113,400 over the next 12 months.
The new MSTR target represents a 76.5% increase from Citi’s previous $136 estimate. With Strategy closing around $160.50 on Oct. 1, a move to $240 would require roughly another 49.5% gain.
Citi’s valuation framework splits that potential upside between a higher Bitcoin price and an expansion in the premium investors are willing to pay for Strategy relative to its underlying BTC holdings.
Bitcoin Appreciation Accounts for Most of Citi’s MSTR Upside
Citi sees about 34% of MSTR’s potential upside coming from Bitcoin appreciation.
That assumption follows the bank’s decision to raise its 12-month Bitcoin target by roughly 39%, from $82,000 to approximately $113,400.
Strategy’s stock has historically moved closely with Bitcoin because BTC represents the core asset on its balance sheet. The company also uses equity, preferred securities, and debt to fund its treasury strategy, which can amplify changes in Bitcoin value at the common-stock level.
This means Citi’s higher BTC forecast directly increases the value it assigns to MSTR.
Citi Also Expects Strategy’s mNAV Premium to Expand
Another 16% of the expected upside comes from Citi’s assumption that Strategy’s mNAV multiple will increase.
mNAV compares Strategy’s market valuation with the net value of its Bitcoin holdings and other balance-sheet items. A figure above 1.0 means investors are valuing MSTR at a premium to the underlying net assets.
Citi’s updated model assumes an mNAV of about 1.24x.
The bank also increased what it calls its Bitcoin Yield Multiple to 4.0x from 2.5x, giving Strategy a higher valuation for its ability to increase Bitcoin exposure per share through capital-market activity.
The two components broadly explain Citi’s new MSTR target. A roughly 34% benefit from its Bitcoin assumption combined with about 16% from mNAV expansion produces close to the 50% upside needed to move MSTR from around $160.50 to $240.
Strategy Remains Highly Sensitive to Bitcoin
Citi’s target therefore depends heavily on Bitcoin reaching the bank’s higher forecast and MSTR maintaining a premium to its underlying BTC value.
If Bitcoin underperforms the $113,400 assumption or Strategy’s mNAV contracts instead of expanding, the valuation model would change. Conversely, stronger Bitcoin performance or a larger MSTR premium could alter the upside case.
For now, Citi’s latest update raises both sides of the equation: a higher Bitcoin forecast and a higher valuation multiple for Strategy, resulting in the jump from a $136 MSTR target to $240.
#CryptoNewsFlash
"Citi Raises Strategy Price Target to $240 as Higher Bitcoin Forecast Lifts MSTR Outlook"
Citi raises its Strategy price target to $240 from $136 as a higher Bitcoin forecast and expected mNAV expansion strengthen its MSTR outlook.
Citi has raised its price target for Strategy (MSTR) to $240 from $136 while keeping a Buy rating on the stock. The revision follows the bank’s higher Bitcoin forecast, with Citi now expecting BTC to reach about $113,400 over the next 12 months.
The new MSTR target represents a 76.5% increase from Citi’s previous $136 estimate. With Strategy closing around $160.50 on Oct. 1, a move to $240 would require roughly another 49.5% gain.
Citi’s valuation framework splits that potential upside between a higher Bitcoin price and an expansion in the premium investors are willing to pay for Strategy relative to its underlying BTC holdings.
Bitcoin Appreciation Accounts for Most of Citi’s MSTR Upside
Citi sees about 34% of MSTR’s potential upside coming from Bitcoin appreciation.
That assumption follows the bank’s decision to raise its 12-month Bitcoin target by roughly 39%, from $82,000 to approximately $113,400.
Strategy’s stock has historically moved closely with Bitcoin because BTC represents the core asset on its balance sheet. The company also uses equity, preferred securities, and debt to fund its treasury strategy, which can amplify changes in Bitcoin value at the common-stock level.
This means Citi’s higher BTC forecast directly increases the value it assigns to MSTR.
Citi Also Expects Strategy’s mNAV Premium to Expand
Another 16% of the expected upside comes from Citi’s assumption that Strategy’s mNAV multiple will increase.
mNAV compares Strategy’s market valuation with the net value of its Bitcoin holdings and other balance-sheet items. A figure above 1.0 means investors are valuing MSTR at a premium to the underlying net assets.
Citi’s updated model assumes an mNAV of about 1.24x.
The bank also increased what it calls its Bitcoin Yield Multiple to 4.0x from 2.5x, giving Strategy a higher valuation for its ability to increase Bitcoin exposure per share through capital-market activity.
The two components broadly explain Citi’s new MSTR target. A roughly 34% benefit from its Bitcoin assumption combined with about 16% from mNAV expansion produces close to the 50% upside needed to move MSTR from around $160.50 to $240.
Strategy Remains Highly Sensitive to Bitcoin
Citi’s target therefore depends heavily on Bitcoin reaching the bank’s higher forecast and MSTR maintaining a premium to its underlying BTC value.
If Bitcoin underperforms the $113,400 assumption or Strategy’s mNAV contracts instead of expanding, the valuation model would change. Conversely, stronger Bitcoin performance or a larger MSTR premium could alter the upside case.
For now, Citi’s latest update raises both sides of the equation: a higher Bitcoin forecast and a higher valuation multiple for Strategy, resulting in the jump from a $136 MSTR target to $240.
#CryptoNewsFlash
Citi has raised its price target for Strategy (MSTR) to $240 from $136 while keeping a Buy rating on the stock. The revision follows the bank’s higher Bitcoin forecast, with Citi now expecting BTC to reach about $113,400 over the next 12 months.
The new MSTR target represents a 76.5% increase from Citi’s previous $136 estimate. With Strategy closing around $160.50 on Oct. 1, a move to $240 would require roughly another 49.5% gain.
Citi’s valuation framework splits that potential upside between a higher Bitcoin price and an expansion in the premium investors are willing to pay for Strategy relative to its underlying BTC holdings.
Bitcoin Appreciation Accounts for Most of Citi’s MSTR Upside
Citi sees about 34% of MSTR’s potential upside coming from Bitcoin appreciation.
That assumption follows the bank’s decision to raise its 12-month Bitcoin target by roughly 39%, from $82,000 to approximately $113,400.
Strategy’s stock has historically moved closely with Bitcoin because BTC represents the core asset on its balance sheet. The company also uses equity, preferred securities, and debt to fund its treasury strategy, which can amplify changes in Bitcoin value at the common-stock level.
This means Citi’s higher BTC forecast directly increases the value it assigns to MSTR.
Citi Also Expects Strategy’s mNAV Premium to Expand
Another 16% of the expected upside comes from Citi’s assumption that Strategy’s mNAV multiple will increase.
mNAV compares Strategy’s market valuation with the net value of its Bitcoin holdings and other balance-sheet items. A figure above 1.0 means investors are valuing MSTR at a premium to the underlying net assets.
Citi’s updated model assumes an mNAV of about 1.24x.
The bank also increased what it calls its Bitcoin Yield Multiple to 4.0x from 2.5x, giving Strategy a higher valuation for its ability to increase Bitcoin exposure per share through capital-market activity.
The two components broadly explain Citi’s new MSTR target. A roughly 34% benefit from its Bitcoin assumption combined with about 16% from mNAV expansion produces close to the 50% upside needed to move MSTR from around $160.50 to $240.
Strategy Remains Highly Sensitive to Bitcoin
Citi’s target therefore depends heavily on Bitcoin reaching the bank’s higher forecast and MSTR maintaining a premium to its underlying BTC value.
If Bitcoin underperforms the $113,400 assumption or Strategy’s mNAV contracts instead of expanding, the valuation model would change. Conversely, stronger Bitcoin performance or a larger MSTR premium could alter the upside case.
For now, Citi’s latest update raises both sides of the equation: a higher Bitcoin forecast and a higher valuation multiple for Strategy, resulting in the jump from a $136 MSTR target to $240.
#CryptoNewsFlash
161
ບົດຄວາມ
"Crypto Price Analysis BTC, ETH, XRP, QNT, NEAR, October 1: Bitcoin Holds Range as NEAR Rebounds"Bitcoin, Ethereum and XRP hold below resistance as NEAR rebounds and Quant consolidates. Explore technical levels and price scenarios for October 1, 2026.
Bitcoin, Ethereum and XRP opened October with modest rolling 24-hour gains, while NEAR Protocol outperformed the group and Quant remained nearly unchanged. The completed daily charts showed different conditions: Bitcoin remained inside its recent consolidation, Ethereum and XRP stayed below nearby resistance, and NEAR recovered much of its latest pullback.
Quant and NEAR join today’s coverage because both appeared in CoinGecko’s search-trending list and ranked inside its top 100 by market capitalization. NEAR ranked 21st and Quant 32nd in the market snapshot. A trending-search listing measures attention and is distinct from a ranking of price gainers.
Bitcoin Fails to Hold Above the Previous Resistance Zone
Bitcoin closed September 30 at $83,578, down 0.07% from $83,640 a day earlier. The session reached $85,518, temporarily exceeding the $85,210 upper resistance boundary identified in the previous report, before ending back below it. That intraday move did not become a confirmed daily breakout.
The latest high expands immediate resistance to approximately $85,210–$85,520. A completed daily close above $85,520, followed by a hold of the reclaimed area, would strengthen the case for another test of the September highs around $87,250–$87,330.
Support remains near $82,580–$82,950, encompassing the September 28 and September 30 lows. Beneath it, the rising 20-day simple moving average stood near $81,302. A daily close below $82,580 would weaken the range and bring that average into focus.
Four-hour MACD, using 12,26,9 settings, remained mixed as the candle closed at 00:00 UTC. The MACD line was approximately -88.63, above its -116.44 signal line but still below zero. Its positive histogram narrowed from 34.24 to 27.81, indicating that the latest improvement relative to the signal line was losing pace.
Ethereum Holds Above Its 20-Day Average but Below $2,743
Ethereum closed September 30 at $2,684.57, gaining 0.27%. Its $2,736.98 session high remained below the approximately $2,743 resistance level highlighted in the previous report.
Daily Bollinger Bands, calculated using a 20-day simple moving average and two standard deviations, had a midpoint near $2,610.17 and an upper band near $2,833.57. ETH price closed above the midpoint and inside the bands, with nearby horizontal resistance still separating price from the higher band.
Fibonacci retracements of the advance from September 15’s $2,361.16 low to September 21’s $2,804.42 high place the 23.6% level near $2,699.81 and the 38.2% level near $2,635.09. The latter closely matches the recent support floor around $2,635.
A daily close above $2,743 would put the $2,787–$2,804 highs back in view. Only a further break of that area would support an extension toward the upper Bollinger Band, whose value changes with subsequent closes.
Conversely, a close below $2,635 would weaken the consolidation and expose the 20-day average near $2,610, followed by the 50% retracement near $2,583.
XRP’s $1.45–$1.47 Support Remains in Focus
XRP finished September 30 near $1.49 after reaching approximately $1.54. The close remained near the preceding session’s level and below the $1.53–$1.56 resistance band identified in the previous report.
The 20-day simple moving average rose to about $1.44. Fibonacci retracements of the advance from the September 16 low of $1.25 to the September 23 high of $1.66 provide additional reference points: approximately $1.50 at 38.2%, $1.46 at 50%, and $1.41 at 61.8%.
The 50% retracement falls within the established $1.45–$1.47 support area, while the moving average sits just beneath it. A completed close below this support band would weaken the current structure; a further loss of the average would bring the $1.41 retracement into focus.
On the upside, reclaiming $1.50 would be an initial improvement, but a close above $1.56 would be needed to clear the broader resistance band and nearby 23.6% retracement. Holding that reclaimed area would support a retest of $1.61–$1.66. A return below $1.53 after a breakout would weaken that recovery scenario.
Quant’s Daily Recovery Meets Softer Four-Hour Momentum
Quant closed September 30 at $286.87, up 7.36% from $267.20. The session climbed to $326.12 before retreating into the close. Its nearly flat rolling 24-hour return at the later snapshot measures a different window from that completed daily gain.
Fibonacci retracements of the rebound from September 28’s $196.87 low to September 30’s $326.12 high place the 23.6% level at $295.62, the 38.2% level at $276.75 and the 50% level at $261.50. The daily close sat between the first two levels, although the subsequent spot quote was back above $295.62.
The latest completed four-hour MACD line fell below its signal line, with the histogram turning from +0.32 to -1.28. Both lines remained above zero, distinguishing the loss of momentum relative to the signal from a move below the MACD baseline.
A daily reclaim of $295.62 would support another attempt at $318.36–$326.12. A confirmed break above $326.12 would reopen the September 27 high near $358.20. Failure to hold $276.75 would instead expose the September 30 low of $263.45 and nearby $261.50 retracement.
NEAR Recovers Toward Its September High
NEAR closed September 30 at $5.34, up 9.20% from $4.89. The session high of $5.49 remained below September 27’s $5.57 peak, so the rebound had not yet produced a confirmed breakout above the recent high.
Four-hour MACD showed improving momentum at the common chart cutoff. Its line stood near 0.109, above the 0.078 signal line, while the positive histogram increased from approximately 0.026 to 0.031. Unlike Bitcoin, both NEAR readings were above zero.
The $5.16–$5.19 area, containing earlier daily highs, is the first area to watch for a successful support retest. Holding above it would preserve the rebound toward $5.49–$5.57. A return below $5.16 would weaken the recovery, with the September 30 low at $4.84 and September 29 low at $4.55 providing lower reference points.
For a conditional upside scenario, two-point Fibonacci extensions of the recovery from September 29’s $4.55 low to September 30’s $5.49 high stand near $5.75 at 1.272 and $6.07 at 1.618. Those levels become relevant if NEAR first closes above $5.57 and holds the breakout area; they are projected extensions, not confirmed price destinations.
#CryptoNewsFlash
"Crypto Price Analysis BTC, ETH, XRP, QNT, NEAR, October 1: Bitcoin Holds Range as NEAR Rebounds"
Bitcoin, Ethereum and XRP hold below resistance as NEAR rebounds and Quant consolidates. Explore technical levels and price scenarios for October 1, 2026.
Bitcoin, Ethereum and XRP opened October with modest rolling 24-hour gains, while NEAR Protocol outperformed the group and Quant remained nearly unchanged. The completed daily charts showed different conditions: Bitcoin remained inside its recent consolidation, Ethereum and XRP stayed below nearby resistance, and NEAR recovered much of its latest pullback.
Quant and NEAR join today’s coverage because both appeared in CoinGecko’s search-trending list and ranked inside its top 100 by market capitalization. NEAR ranked 21st and Quant 32nd in the market snapshot. A trending-search listing measures attention and is distinct from a ranking of price gainers.
Bitcoin Fails to Hold Above the Previous Resistance Zone
Bitcoin closed September 30 at $83,578, down 0.07% from $83,640 a day earlier. The session reached $85,518, temporarily exceeding the $85,210 upper resistance boundary identified in the previous report, before ending back below it. That intraday move did not become a confirmed daily breakout.
The latest high expands immediate resistance to approximately $85,210–$85,520. A completed daily close above $85,520, followed by a hold of the reclaimed area, would strengthen the case for another test of the September highs around $87,250–$87,330.
Support remains near $82,580–$82,950, encompassing the September 28 and September 30 lows. Beneath it, the rising 20-day simple moving average stood near $81,302. A daily close below $82,580 would weaken the range and bring that average into focus.
Four-hour MACD, using 12,26,9 settings, remained mixed as the candle closed at 00:00 UTC. The MACD line was approximately -88.63, above its -116.44 signal line but still below zero. Its positive histogram narrowed from 34.24 to 27.81, indicating that the latest improvement relative to the signal line was losing pace.
Ethereum Holds Above Its 20-Day Average but Below $2,743
Ethereum closed September 30 at $2,684.57, gaining 0.27%. Its $2,736.98 session high remained below the approximately $2,743 resistance level highlighted in the previous report.
Daily Bollinger Bands, calculated using a 20-day simple moving average and two standard deviations, had a midpoint near $2,610.17 and an upper band near $2,833.57. ETH price closed above the midpoint and inside the bands, with nearby horizontal resistance still separating price from the higher band.
Fibonacci retracements of the advance from September 15’s $2,361.16 low to September 21’s $2,804.42 high place the 23.6% level near $2,699.81 and the 38.2% level near $2,635.09. The latter closely matches the recent support floor around $2,635.
A daily close above $2,743 would put the $2,787–$2,804 highs back in view. Only a further break of that area would support an extension toward the upper Bollinger Band, whose value changes with subsequent closes.
Conversely, a close below $2,635 would weaken the consolidation and expose the 20-day average near $2,610, followed by the 50% retracement near $2,583.
XRP’s $1.45–$1.47 Support Remains in Focus
XRP finished September 30 near $1.49 after reaching approximately $1.54. The close remained near the preceding session’s level and below the $1.53–$1.56 resistance band identified in the previous report.
The 20-day simple moving average rose to about $1.44. Fibonacci retracements of the advance from the September 16 low of $1.25 to the September 23 high of $1.66 provide additional reference points: approximately $1.50 at 38.2%, $1.46 at 50%, and $1.41 at 61.8%.
The 50% retracement falls within the established $1.45–$1.47 support area, while the moving average sits just beneath it. A completed close below this support band would weaken the current structure; a further loss of the average would bring the $1.41 retracement into focus.
On the upside, reclaiming $1.50 would be an initial improvement, but a close above $1.56 would be needed to clear the broader resistance band and nearby 23.6% retracement. Holding that reclaimed area would support a retest of $1.61–$1.66. A return below $1.53 after a breakout would weaken that recovery scenario.
Quant’s Daily Recovery Meets Softer Four-Hour Momentum
Quant closed September 30 at $286.87, up 7.36% from $267.20. The session climbed to $326.12 before retreating into the close. Its nearly flat rolling 24-hour return at the later snapshot measures a different window from that completed daily gain.
Fibonacci retracements of the rebound from September 28’s $196.87 low to September 30’s $326.12 high place the 23.6% level at $295.62, the 38.2% level at $276.75 and the 50% level at $261.50. The daily close sat between the first two levels, although the subsequent spot quote was back above $295.62.
The latest completed four-hour MACD line fell below its signal line, with the histogram turning from +0.32 to -1.28. Both lines remained above zero, distinguishing the loss of momentum relative to the signal from a move below the MACD baseline.
A daily reclaim of $295.62 would support another attempt at $318.36–$326.12. A confirmed break above $326.12 would reopen the September 27 high near $358.20. Failure to hold $276.75 would instead expose the September 30 low of $263.45 and nearby $261.50 retracement.
NEAR Recovers Toward Its September High
NEAR closed September 30 at $5.34, up 9.20% from $4.89. The session high of $5.49 remained below September 27’s $5.57 peak, so the rebound had not yet produced a confirmed breakout above the recent high.
Four-hour MACD showed improving momentum at the common chart cutoff. Its line stood near 0.109, above the 0.078 signal line, while the positive histogram increased from approximately 0.026 to 0.031. Unlike Bitcoin, both NEAR readings were above zero.
The $5.16–$5.19 area, containing earlier daily highs, is the first area to watch for a successful support retest. Holding above it would preserve the rebound toward $5.49–$5.57. A return below $5.16 would weaken the recovery, with the September 30 low at $4.84 and September 29 low at $4.55 providing lower reference points.
For a conditional upside scenario, two-point Fibonacci extensions of the recovery from September 29’s $4.55 low to September 30’s $5.49 high stand near $5.75 at 1.272 and $6.07 at 1.618. Those levels become relevant if NEAR first closes above $5.57 and holds the breakout area; they are projected extensions, not confirmed price destinations.
#CryptoNewsFlash
Bitcoin, Ethereum and XRP opened October with modest rolling 24-hour gains, while NEAR Protocol outperformed the group and Quant remained nearly unchanged. The completed daily charts showed different conditions: Bitcoin remained inside its recent consolidation, Ethereum and XRP stayed below nearby resistance, and NEAR recovered much of its latest pullback.
Quant and NEAR join today’s coverage because both appeared in CoinGecko’s search-trending list and ranked inside its top 100 by market capitalization. NEAR ranked 21st and Quant 32nd in the market snapshot. A trending-search listing measures attention and is distinct from a ranking of price gainers.
Bitcoin Fails to Hold Above the Previous Resistance Zone
Bitcoin closed September 30 at $83,578, down 0.07% from $83,640 a day earlier. The session reached $85,518, temporarily exceeding the $85,210 upper resistance boundary identified in the previous report, before ending back below it. That intraday move did not become a confirmed daily breakout.
The latest high expands immediate resistance to approximately $85,210–$85,520. A completed daily close above $85,520, followed by a hold of the reclaimed area, would strengthen the case for another test of the September highs around $87,250–$87,330.
Support remains near $82,580–$82,950, encompassing the September 28 and September 30 lows. Beneath it, the rising 20-day simple moving average stood near $81,302. A daily close below $82,580 would weaken the range and bring that average into focus.
Four-hour MACD, using 12,26,9 settings, remained mixed as the candle closed at 00:00 UTC. The MACD line was approximately -88.63, above its -116.44 signal line but still below zero. Its positive histogram narrowed from 34.24 to 27.81, indicating that the latest improvement relative to the signal line was losing pace.
Ethereum Holds Above Its 20-Day Average but Below $2,743
Ethereum closed September 30 at $2,684.57, gaining 0.27%. Its $2,736.98 session high remained below the approximately $2,743 resistance level highlighted in the previous report.
Daily Bollinger Bands, calculated using a 20-day simple moving average and two standard deviations, had a midpoint near $2,610.17 and an upper band near $2,833.57. ETH price closed above the midpoint and inside the bands, with nearby horizontal resistance still separating price from the higher band.
Fibonacci retracements of the advance from September 15’s $2,361.16 low to September 21’s $2,804.42 high place the 23.6% level near $2,699.81 and the 38.2% level near $2,635.09. The latter closely matches the recent support floor around $2,635.
A daily close above $2,743 would put the $2,787–$2,804 highs back in view. Only a further break of that area would support an extension toward the upper Bollinger Band, whose value changes with subsequent closes.
Conversely, a close below $2,635 would weaken the consolidation and expose the 20-day average near $2,610, followed by the 50% retracement near $2,583.
XRP’s $1.45–$1.47 Support Remains in Focus
XRP finished September 30 near $1.49 after reaching approximately $1.54. The close remained near the preceding session’s level and below the $1.53–$1.56 resistance band identified in the previous report.
The 20-day simple moving average rose to about $1.44. Fibonacci retracements of the advance from the September 16 low of $1.25 to the September 23 high of $1.66 provide additional reference points: approximately $1.50 at 38.2%, $1.46 at 50%, and $1.41 at 61.8%.
The 50% retracement falls within the established $1.45–$1.47 support area, while the moving average sits just beneath it. A completed close below this support band would weaken the current structure; a further loss of the average would bring the $1.41 retracement into focus.
On the upside, reclaiming $1.50 would be an initial improvement, but a close above $1.56 would be needed to clear the broader resistance band and nearby 23.6% retracement. Holding that reclaimed area would support a retest of $1.61–$1.66. A return below $1.53 after a breakout would weaken that recovery scenario.
Quant’s Daily Recovery Meets Softer Four-Hour Momentum
Quant closed September 30 at $286.87, up 7.36% from $267.20. The session climbed to $326.12 before retreating into the close. Its nearly flat rolling 24-hour return at the later snapshot measures a different window from that completed daily gain.
Fibonacci retracements of the rebound from September 28’s $196.87 low to September 30’s $326.12 high place the 23.6% level at $295.62, the 38.2% level at $276.75 and the 50% level at $261.50. The daily close sat between the first two levels, although the subsequent spot quote was back above $295.62.
The latest completed four-hour MACD line fell below its signal line, with the histogram turning from +0.32 to -1.28. Both lines remained above zero, distinguishing the loss of momentum relative to the signal from a move below the MACD baseline.
A daily reclaim of $295.62 would support another attempt at $318.36–$326.12. A confirmed break above $326.12 would reopen the September 27 high near $358.20. Failure to hold $276.75 would instead expose the September 30 low of $263.45 and nearby $261.50 retracement.
NEAR Recovers Toward Its September High
NEAR closed September 30 at $5.34, up 9.20% from $4.89. The session high of $5.49 remained below September 27’s $5.57 peak, so the rebound had not yet produced a confirmed breakout above the recent high.
Four-hour MACD showed improving momentum at the common chart cutoff. Its line stood near 0.109, above the 0.078 signal line, while the positive histogram increased from approximately 0.026 to 0.031. Unlike Bitcoin, both NEAR readings were above zero.
The $5.16–$5.19 area, containing earlier daily highs, is the first area to watch for a successful support retest. Holding above it would preserve the rebound toward $5.49–$5.57. A return below $5.16 would weaken the recovery, with the September 30 low at $4.84 and September 29 low at $4.55 providing lower reference points.
For a conditional upside scenario, two-point Fibonacci extensions of the recovery from September 29’s $4.55 low to September 30’s $5.49 high stand near $5.75 at 1.272 and $6.07 at 1.618. Those levels become relevant if NEAR first closes above $5.57 and holds the breakout area; they are projected extensions, not confirmed price destinations.
#CryptoNewsFlash
401
ບົດຄວາມ
"The Largest Bitcoin Holders No Longer Buying"The biggest #Bitcoin holders are no longer adding aggressively to their positions, raising fresh concerns about the strength of the current market structure.
Fresh on-chain data from CryptoQuant shows a decline among prominent Bitcoin (BTC) whales. Prices are already beginning to look weak following an over 5% drop in the past seven days. This stalled accumulation adds fresh pressure to the cryptocurrency’s price.
Key Points
Both whale and dolphin wallets are slowing down accumulation at the same time.Dolphin wallets’ balances have been recording consistently lower highs since September 2025.Whale wallets have declined at their fastest rate of this year, mirroring the 2022 bear market.Historically, periods where whales and dolphins pause accumulation together have often preceded weaker price action.
Bitcoin Whales Stopped Accumulating
The CryptoQuant report shows that both whale and dolphin wallets are slowing down accumulation at the same time.
The balance of dolphin wallets—addresses holding between 100 and 1,000 BTC—has been recording consistently lower highs since September 2025. Their holdings have declined year-over-year, trading below their 365-day moving average.
Notably, dolphin wallets’ balance peaked at 970,000 BTC in October 2025. Since then, it has trended lower, as addresses in this category distribute holdings.
At the same time, whale wallets, which are addresses containing between 1,000 and 10,000 BTC, have seen their balance decline at the fastest rate of this year. This year-over-year drop resembles the distribution rate seen in the 2022 bear market.
Additionally, monthly growth of these high-caliber BTC holders remains near zero since February, highlighting persistent selling pressure.
What Does It Mean for Bitcoin?
This combined drop in buying pressure matters because these cohorts are some of the most influential participants in the market. When both groups slow down simultaneously, it usually signals that large-scale accumulation is losing momentum.
Rather than expanding positions aggressively as prices fluctuate, many of these holders now appear to be sitting on existing balances or selling while waiting for stronger confirmation from the broader market.
Notably, the CryptoQuant report classified ETFs and treasury firms within the dolphin category. The reduction in their holding coincides with weaker ETF inflows and softer spot demand, as institutional traction dwindles.
The US Bitcoin spot ETFs are on a 9-day outflow streak, with $1.3 billion worth of Bitcoin already sold this week. So far in May, these products have recorded a net outflow of $2.30 billion, the largest since November 2025.
Weak Participation Detrimental to Prices
Interestingly, this analysis comes on the back of the growth of long-term holders’ supply. Their share of the market rose to an unprecedented level of 74.3%, as their stash expanded to 14.85 million BTC.
Despite the growth, CryptoQuant believes the rise reflects slowing turnover instead of strong conviction. Fewer coins are changing hands at the current market state, causing more BTC to age into long-term holder status.
That dynamic creates a fragile setup. Markets driven mainly by inactive holders rather than expanding demand often struggle to maintain strong upward momentum. Without consistent spot buying pressure, rallies can become heavily dependent on leverage activity in futures markets, which tends to increase volatility.
Historically, periods where whales and dolphins pause accumulation together have often preceded weaker price action. While this does not guarantee a deeper correction, it suggests the market may continue lacking the strong participation needed for a sustained recovery in the near term.
#CryptoNewsFlash
"The Largest Bitcoin Holders No Longer Buying"
The biggest #Bitcoin holders are no longer adding aggressively to their positions, raising fresh concerns about the strength of the current market structure.
Fresh on-chain data from CryptoQuant shows a decline among prominent Bitcoin (BTC) whales. Prices are already beginning to look weak following an over 5% drop in the past seven days. This stalled accumulation adds fresh pressure to the cryptocurrency’s price.
Key Points
Both whale and dolphin wallets are slowing down accumulation at the same time.Dolphin wallets’ balances have been recording consistently lower highs since September 2025.Whale wallets have declined at their fastest rate of this year, mirroring the 2022 bear market.Historically, periods where whales and dolphins pause accumulation together have often preceded weaker price action.
Bitcoin Whales Stopped Accumulating
The CryptoQuant report shows that both whale and dolphin wallets are slowing down accumulation at the same time.
The balance of dolphin wallets—addresses holding between 100 and 1,000 BTC—has been recording consistently lower highs since September 2025. Their holdings have declined year-over-year, trading below their 365-day moving average.
Notably, dolphin wallets’ balance peaked at 970,000 BTC in October 2025. Since then, it has trended lower, as addresses in this category distribute holdings.
At the same time, whale wallets, which are addresses containing between 1,000 and 10,000 BTC, have seen their balance decline at the fastest rate of this year. This year-over-year drop resembles the distribution rate seen in the 2022 bear market.
Additionally, monthly growth of these high-caliber BTC holders remains near zero since February, highlighting persistent selling pressure.
What Does It Mean for Bitcoin?
This combined drop in buying pressure matters because these cohorts are some of the most influential participants in the market. When both groups slow down simultaneously, it usually signals that large-scale accumulation is losing momentum.
Rather than expanding positions aggressively as prices fluctuate, many of these holders now appear to be sitting on existing balances or selling while waiting for stronger confirmation from the broader market.
Notably, the CryptoQuant report classified ETFs and treasury firms within the dolphin category. The reduction in their holding coincides with weaker ETF inflows and softer spot demand, as institutional traction dwindles.
The US Bitcoin spot ETFs are on a 9-day outflow streak, with $1.3 billion worth of Bitcoin already sold this week. So far in May, these products have recorded a net outflow of $2.30 billion, the largest since November 2025.
Weak Participation Detrimental to Prices
Interestingly, this analysis comes on the back of the growth of long-term holders’ supply. Their share of the market rose to an unprecedented level of 74.3%, as their stash expanded to 14.85 million BTC.
Despite the growth, CryptoQuant believes the rise reflects slowing turnover instead of strong conviction. Fewer coins are changing hands at the current market state, causing more BTC to age into long-term holder status.
That dynamic creates a fragile setup. Markets driven mainly by inactive holders rather than expanding demand often struggle to maintain strong upward momentum. Without consistent spot buying pressure, rallies can become heavily dependent on leverage activity in futures markets, which tends to increase volatility.
Historically, periods where whales and dolphins pause accumulation together have often preceded weaker price action. While this does not guarantee a deeper correction, it suggests the market may continue lacking the strong participation needed for a sustained recovery in the near term.
#CryptoNewsFlash
Fresh on-chain data from CryptoQuant shows a decline among prominent Bitcoin (BTC) whales. Prices are already beginning to look weak following an over 5% drop in the past seven days. This stalled accumulation adds fresh pressure to the cryptocurrency’s price.
Key Points
Both whale and dolphin wallets are slowing down accumulation at the same time.Dolphin wallets’ balances have been recording consistently lower highs since September 2025.Whale wallets have declined at their fastest rate of this year, mirroring the 2022 bear market.Historically, periods where whales and dolphins pause accumulation together have often preceded weaker price action.
Bitcoin Whales Stopped Accumulating
The CryptoQuant report shows that both whale and dolphin wallets are slowing down accumulation at the same time.
The balance of dolphin wallets—addresses holding between 100 and 1,000 BTC—has been recording consistently lower highs since September 2025. Their holdings have declined year-over-year, trading below their 365-day moving average.
Notably, dolphin wallets’ balance peaked at 970,000 BTC in October 2025. Since then, it has trended lower, as addresses in this category distribute holdings.
At the same time, whale wallets, which are addresses containing between 1,000 and 10,000 BTC, have seen their balance decline at the fastest rate of this year. This year-over-year drop resembles the distribution rate seen in the 2022 bear market.
Additionally, monthly growth of these high-caliber BTC holders remains near zero since February, highlighting persistent selling pressure.
What Does It Mean for Bitcoin?
This combined drop in buying pressure matters because these cohorts are some of the most influential participants in the market. When both groups slow down simultaneously, it usually signals that large-scale accumulation is losing momentum.
Rather than expanding positions aggressively as prices fluctuate, many of these holders now appear to be sitting on existing balances or selling while waiting for stronger confirmation from the broader market.
Notably, the CryptoQuant report classified ETFs and treasury firms within the dolphin category. The reduction in their holding coincides with weaker ETF inflows and softer spot demand, as institutional traction dwindles.
The US Bitcoin spot ETFs are on a 9-day outflow streak, with $1.3 billion worth of Bitcoin already sold this week. So far in May, these products have recorded a net outflow of $2.30 billion, the largest since November 2025.
Weak Participation Detrimental to Prices
Interestingly, this analysis comes on the back of the growth of long-term holders’ supply. Their share of the market rose to an unprecedented level of 74.3%, as their stash expanded to 14.85 million BTC.
Despite the growth, CryptoQuant believes the rise reflects slowing turnover instead of strong conviction. Fewer coins are changing hands at the current market state, causing more BTC to age into long-term holder status.
That dynamic creates a fragile setup. Markets driven mainly by inactive holders rather than expanding demand often struggle to maintain strong upward momentum. Without consistent spot buying pressure, rallies can become heavily dependent on leverage activity in futures markets, which tends to increase volatility.
Historically, periods where whales and dolphins pause accumulation together have often preceded weaker price action. While this does not guarantee a deeper correction, it suggests the market may continue lacking the strong participation needed for a sustained recovery in the near term.
#CryptoNewsFlash
2
1
656

ບົດຄວາມ
"Expert Analysis on How Bitcoin Price Will Behave This Week and In June"#Bitcoin recorded a critical close above $74,400 last week, paving the way for continued recovery in the coming weeks.
Notably, expert analysis from Sykodelic highlights that this level sits at the center of the broader market structure. His recent X post explains why the $74,400 level is important and how it could shape Bitcoin’s price in the coming weeks.
Key Points
Bitcoin closed last week at $77,020, holding within the bull market support band (BMSB).Last week’s dip to $74,156 marked a retest of the break of the structure point at $74,400.Bitcoin could still produce another brief move lower this week before attempting a stronger bullish continuation in June.The Bitcoin macro bottom is in, with $60,000 seen as the cycle’s base.
Bitcoin Holds Key Higher Timeframe Support
Bitcoin (BTC) closed last week at $77,020, recovering considerably from the intra-week low of $74,156. Per the analysis, this is within the bull market support band (BMSB).
An accompanying chart shows that holding above this band has driven some major Bitcoin rallies. A scenario occurred in November 2024, when BTC held above the BMSB before its explosive price action from around $62,000 to $108,000 in December 2024.
At the same time, Bitcoin is attempting to confirm a higher-timeframe structure. The price recorded a yearly low of $74,400 in 2025 but fell below this level early this year to $60,000 amid persistent selling pressure. BTC bounced from the 2026 lows, reclaimed the 2025 low, and eventually broke structure with its rally to $82,800 earlier this month.
As such, Sykodelic views last week’s dip as a retest of the BOS at $74,400. The weekly closing above it confirms a higher-timeframe bullish structure.
Last Shakeout Before Uptrend
Nonetheless, the analysis suggests Bitcoin could still produce another brief move lower this week before attempting a stronger bullish continuation in June. That possible dip may temporarily push BTC back toward the $74,400 area or slightly beneath it.
However, the move could act as a liquidity sweep, shaking out weak hands. The market dip will trigger aggressive bearish bets, which would eventually be wiped out when BTC quickly reverses upward as support holds.
The liquidity and bullish technical development will drive Bitcoin higher in June, potentially above $90,000. From the current price of $77,266, this represents an over 16% price growth. The prediction aligns with an XWIN Research outlook highlighting the importance of the $93,000 price level.
Meanwhile, Sykodelic concluded that the macro bottom is in, a view that several market analysts have shared. Their view is that Bitcoin bottomed at $60,000 in February.
Bitcoin Market Indicators
Notably, BTC’s momentum indicators are also beginning to stabilize. The RSI has held near the 50 midline, maintaining its trend above the RSI-based MA. Currently at 46.15, it suggests ample room for growth before entering overbought territory.
In addition, the MACD histogram has continued to print green bars despite a recent short-lived dip, keeping bullish momentum in play. However, market participation remains low, with trading volume dropping 13% in the past 24 hours.
#CryptoNewsFlash
"Expert Analysis on How Bitcoin Price Will Behave This Week and In June"
#Bitcoin recorded a critical close above $74,400 last week, paving the way for continued recovery in the coming weeks.
Notably, expert analysis from Sykodelic highlights that this level sits at the center of the broader market structure. His recent X post explains why the $74,400 level is important and how it could shape Bitcoin’s price in the coming weeks.
Key Points
Bitcoin closed last week at $77,020, holding within the bull market support band (BMSB).Last week’s dip to $74,156 marked a retest of the break of the structure point at $74,400.Bitcoin could still produce another brief move lower this week before attempting a stronger bullish continuation in June.The Bitcoin macro bottom is in, with $60,000 seen as the cycle’s base.
Bitcoin Holds Key Higher Timeframe Support
Bitcoin (BTC) closed last week at $77,020, recovering considerably from the intra-week low of $74,156. Per the analysis, this is within the bull market support band (BMSB).
An accompanying chart shows that holding above this band has driven some major Bitcoin rallies. A scenario occurred in November 2024, when BTC held above the BMSB before its explosive price action from around $62,000 to $108,000 in December 2024.
At the same time, Bitcoin is attempting to confirm a higher-timeframe structure. The price recorded a yearly low of $74,400 in 2025 but fell below this level early this year to $60,000 amid persistent selling pressure. BTC bounced from the 2026 lows, reclaimed the 2025 low, and eventually broke structure with its rally to $82,800 earlier this month.
As such, Sykodelic views last week’s dip as a retest of the BOS at $74,400. The weekly closing above it confirms a higher-timeframe bullish structure.
Last Shakeout Before Uptrend
Nonetheless, the analysis suggests Bitcoin could still produce another brief move lower this week before attempting a stronger bullish continuation in June. That possible dip may temporarily push BTC back toward the $74,400 area or slightly beneath it.
However, the move could act as a liquidity sweep, shaking out weak hands. The market dip will trigger aggressive bearish bets, which would eventually be wiped out when BTC quickly reverses upward as support holds.
The liquidity and bullish technical development will drive Bitcoin higher in June, potentially above $90,000. From the current price of $77,266, this represents an over 16% price growth. The prediction aligns with an XWIN Research outlook highlighting the importance of the $93,000 price level.
Meanwhile, Sykodelic concluded that the macro bottom is in, a view that several market analysts have shared. Their view is that Bitcoin bottomed at $60,000 in February.
Bitcoin Market Indicators
Notably, BTC’s momentum indicators are also beginning to stabilize. The RSI has held near the 50 midline, maintaining its trend above the RSI-based MA. Currently at 46.15, it suggests ample room for growth before entering overbought territory.
In addition, the MACD histogram has continued to print green bars despite a recent short-lived dip, keeping bullish momentum in play. However, market participation remains low, with trading volume dropping 13% in the past 24 hours.
#CryptoNewsFlash
Notably, expert analysis from Sykodelic highlights that this level sits at the center of the broader market structure. His recent X post explains why the $74,400 level is important and how it could shape Bitcoin’s price in the coming weeks.
Key Points
Bitcoin closed last week at $77,020, holding within the bull market support band (BMSB).Last week’s dip to $74,156 marked a retest of the break of the structure point at $74,400.Bitcoin could still produce another brief move lower this week before attempting a stronger bullish continuation in June.The Bitcoin macro bottom is in, with $60,000 seen as the cycle’s base.
Bitcoin Holds Key Higher Timeframe Support
Bitcoin (BTC) closed last week at $77,020, recovering considerably from the intra-week low of $74,156. Per the analysis, this is within the bull market support band (BMSB).
An accompanying chart shows that holding above this band has driven some major Bitcoin rallies. A scenario occurred in November 2024, when BTC held above the BMSB before its explosive price action from around $62,000 to $108,000 in December 2024.
At the same time, Bitcoin is attempting to confirm a higher-timeframe structure. The price recorded a yearly low of $74,400 in 2025 but fell below this level early this year to $60,000 amid persistent selling pressure. BTC bounced from the 2026 lows, reclaimed the 2025 low, and eventually broke structure with its rally to $82,800 earlier this month.
As such, Sykodelic views last week’s dip as a retest of the BOS at $74,400. The weekly closing above it confirms a higher-timeframe bullish structure.
Last Shakeout Before Uptrend
Nonetheless, the analysis suggests Bitcoin could still produce another brief move lower this week before attempting a stronger bullish continuation in June. That possible dip may temporarily push BTC back toward the $74,400 area or slightly beneath it.
However, the move could act as a liquidity sweep, shaking out weak hands. The market dip will trigger aggressive bearish bets, which would eventually be wiped out when BTC quickly reverses upward as support holds.
The liquidity and bullish technical development will drive Bitcoin higher in June, potentially above $90,000. From the current price of $77,266, this represents an over 16% price growth. The prediction aligns with an XWIN Research outlook highlighting the importance of the $93,000 price level.
Meanwhile, Sykodelic concluded that the macro bottom is in, a view that several market analysts have shared. Their view is that Bitcoin bottomed at $60,000 in February.
Bitcoin Market Indicators
Notably, BTC’s momentum indicators are also beginning to stabilize. The RSI has held near the 50 midline, maintaining its trend above the RSI-based MA. Currently at 46.15, it suggests ample room for growth before entering overbought territory.
In addition, the MACD histogram has continued to print green bars despite a recent short-lived dip, keeping bullish momentum in play. However, market participation remains low, with trading volume dropping 13% in the past 24 hours.
#CryptoNewsFlash
158

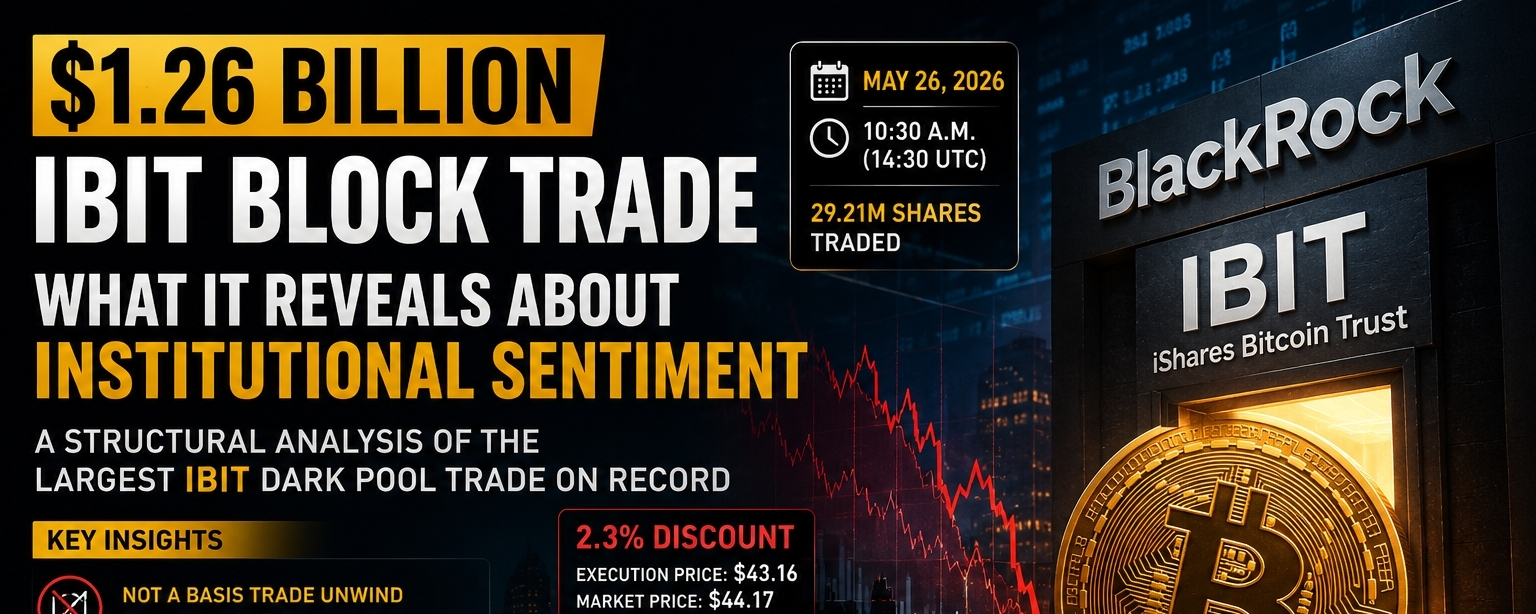
ບົດຄວາມ
Institutional Liquidity and Exit Dynamics: A Structural Analysis of the $1.26 Billion IBIT Block{spot}(BTCUSDT)
1. Executive Brief: The Anatomy of a High-Concession Exit
The $1.26 billion block trade of BlackRock’s iShares Bitcoin Trust (IBIT) on May 26, 2026, serves as a seminal stress test for the maturation of digital asset market microstructure. Executed at 10:30 a.m. (14:30 UTC), this transaction moved a significant volume of risk from the shadow of fragmented OTC desks into the regulated transparency of a U.S. ETF wrapper. While the scale confirms the product's ability to facilitate billion-dollar exits, the execution mechanics reveal a notable mandate-driven de-risking event rather than a tactical rebalance.
The core metrics of the transaction underscore a prioritization of speed over price optimization. Approximately 29.21 million shares of IBIT were traded off-exchange via the FINRA/Nasdaq TRF Carteret facility. The execution price was established at 43.16 per share—a 2.3% (1.01) discount relative to the contemporaneous market price of $44.17. For the seller, this resulted in an estimated $29.5 million execution cost. In clinical terms, this $29.5 million represents an "anonymity premium" paid to facilitate a massive counterparty risk transfer while attempting to mitigate the signaling risk inherent in visible exchange-based liquidations.
2. Deconstructing the "Basis Trade" Counter-Thesis
Within the current market regime, high-volume ETF spikes are frequently dismissed as the mechanical unwinding of "basis trades"—a market-neutral strategy where participants hold long spot ETF positions against short CME futures. However, structural data provided by NYDIG’s research team (Greg Cipolaro) suggests that the May 26 event was directional rather than arbitrage-related.
The 2.3% concession paid is incompatible with the tight margins of standard basis trades; such a discount would effectively negate the carry-trade yield. Furthermore, the absence of a corresponding footprint in the derivatives market is definitive. While the IBIT position represented exposure equivalent to roughly 3,700 CME $BTC futures contracts, only 91 contracts traded during the minute of execution, with no spike in volume observed.
Evidence Against Basis Trade Unwind
Metric
Observed Value
Strategic Implication
Execution Discount
2.3% ($1.01 per share)
Concession exceeds typical arbitrage margins; suggests non-arbitrage, directional motivation.
CME Futures Activity
91 contracts (vs. 3,700 required)
Lack of correlated futures volume rejects the "basis trade unwind" hypothesis.
Execution Venue
FINRA/Nasdaq TRF Carteret
Private negotiation indicates a deliberate strategic trade-off: paying a premium for anonymity.
Counterparty Identification
Exceeds all disclosed 13F holdings
Trade size surpasses every reported position in current 13F filings, implying an undisclosed or synthetic "whale" exit.
The rejection of a mechanical unwind confirms that a major discretionary holder has turned bearish or is facing external liquidity requirements, shifting the focus to broader sentiment erosion.
3. Market Microstructure: Dark Pools and Liquidity Constraints
Dark pools are optimized for institutional liquidity provision, designed to facilitate large-scale risk transfers while minimizing immediate price impact. Alex Thorn (Galaxy Digital) identified this as the largest IBIT dark pool trade on record, with Eric Balchunas (Bloomberg) noting the volume was 22 times larger than the day's next largest sell order.
The microstructural response to this trade highlights a lead-lag relationship between the ETF and spot markets:
Spot Volatility: Within 10 minutes of the 14:30 UTC print, Bitcoin spot price dropped 1.5% from $77,875 to $76,720, eventually sliding to $75,600.ETF Absorption: Despite the underlying spot volatility, the IBIT ETF price stabilized soon after. Analysts observed that the market "absorbed" the trade well within the fund structure itself, suggesting that while information leakage hit the spot market, the ETF's secondary market provided sufficient depth to prevent a cascading breakdown in the product's price relative to its NAV.
This divergence suggests that the ETF wrapper acted as a liquidity buffer, even as the scale of the exit signaled a breakdown in underlying support levels below the $80,000 threshold.
4. Macro-Sentiment and The Capital Rotation Narrative
The May 26 block trade was the apex of an 8-to-9-day net outflow streak (May 15–29) that saw total category AUM contract from $107.75 billion to $94.17 billion. This "capital flight" is not merely technical but reflective of a macro-pivot. Bitcoin has experienced a 16% decline year-to-date in 2026, causing it to drop to the 13th largest asset globally. This stands in stark contrast to the S&P 500’s nine-week rally and the surge in AI-linked equities and precious metals.
Specific macro-geopolitical catalysts have accelerated this rotation:
Regulatory Shifts: The "Clarity Act" has provided a compliance framework for digital assets but has ironically favored infrastructure-linked assets and Ethereum (fixing its compliance discount) while leaving Bitcoin exposed to a "risk-off" rotation.Geopolitical De-escalation: Reports of Iran ceasefire talks have eased global tensions, reducing the "geopolitical hedge" premium previously embedded in Bitcoin’s price.Institutional Position Trimming: 13F filings confirm mandate-driven de-risking by Tier-1 firms, with Jane Street reducing exposure by 70% and Goldman Sachs cutting positions by 10%.
5. Institutional Outlook: Market Maturity vs. Sentiment Shift
The IBIT block trade signals a "normalization" of institutional trading behavior, where billion-dollar exits are feasible but remain costly. The month of May saw IBIT record $1.41 billion in total net outflows, including the $528 million withdrawal on May 28—the second-largest daily outflow in the fund's history.
Strategic Takeaways for Institutional Allocators
Liquidity Reality & NAV Slippage: Billion-dollar exits now require significant concessions. Allocators must incorporate high-liquidity premiums (2%+ discounts) into their risk-management and exit-cost models for digital assets.Product Dominance as a "Primary Exit Ramp": IBIT has solidified its role as the market's primary liquidity venue. Institutions gravitate to BlackRock’s vehicle not just for entry, but because it provides the most robust infrastructure for massive, rapid counterparty risk transfers.Sentiment Indicator: The transition from technical arbitrage to discretionary de-risking suggests a fundamental re-evaluation of Bitcoin's role in the multi-asset portfolio. A seller’s willingness to accept a $29.5 million loss suggests that the perceived risk of holding the asset now outweighs the cost of a high-concession exit.
In conclusion, the May 26 IBIT block trade represents a structural milestone. While the infrastructure successfully facilitated the trade without a market-wide collapse, the event serves as a definitive reminder that institutional participation in digital assets remains subject to the same rigorous "risk-off" thresholds and mandate-driven de-risking as traditional asset classes. Institutional capital is increasingly mobile, and its presence is not a guarantee of permanent support.
#BTC #btcnews #CryptoNewsFlash
Institutional Liquidity and Exit Dynamics: A Structural Analysis of the $1.26 Billion IBIT Block
1. Executive Brief: The Anatomy of a High-Concession Exit
The $1.26 billion block trade of BlackRock’s iShares Bitcoin Trust (IBIT) on May 26, 2026, serves as a seminal stress test for the maturation of digital asset market microstructure. Executed at 10:30 a.m. (14:30 UTC), this transaction moved a significant volume of risk from the shadow of fragmented OTC desks into the regulated transparency of a U.S. ETF wrapper. While the scale confirms the product's ability to facilitate billion-dollar exits, the execution mechanics reveal a notable mandate-driven de-risking event rather than a tactical rebalance.
The core metrics of the transaction underscore a prioritization of speed over price optimization. Approximately 29.21 million shares of IBIT were traded off-exchange via the FINRA/Nasdaq TRF Carteret facility. The execution price was established at 43.16 per share—a 2.3% (1.01) discount relative to the contemporaneous market price of $44.17. For the seller, this resulted in an estimated $29.5 million execution cost. In clinical terms, this $29.5 million represents an "anonymity premium" paid to facilitate a massive counterparty risk transfer while attempting to mitigate the signaling risk inherent in visible exchange-based liquidations.
2. Deconstructing the "Basis Trade" Counter-Thesis
Within the current market regime, high-volume ETF spikes are frequently dismissed as the mechanical unwinding of "basis trades"—a market-neutral strategy where participants hold long spot ETF positions against short CME futures. However, structural data provided by NYDIG’s research team (Greg Cipolaro) suggests that the May 26 event was directional rather than arbitrage-related.
The 2.3% concession paid is incompatible with the tight margins of standard basis trades; such a discount would effectively negate the carry-trade yield. Furthermore, the absence of a corresponding footprint in the derivatives market is definitive. While the IBIT position represented exposure equivalent to roughly 3,700 CME $BTC futures contracts, only 91 contracts traded during the minute of execution, with no spike in volume observed.
Evidence Against Basis Trade Unwind
Metric
Observed Value
Strategic Implication
Execution Discount
2.3% ($1.01 per share)
Concession exceeds typical arbitrage margins; suggests non-arbitrage, directional motivation.
CME Futures Activity
91 contracts (vs. 3,700 required)
Lack of correlated futures volume rejects the "basis trade unwind" hypothesis.
Execution Venue
FINRA/Nasdaq TRF Carteret
Private negotiation indicates a deliberate strategic trade-off: paying a premium for anonymity.
Counterparty Identification
Exceeds all disclosed 13F holdings
Trade size surpasses every reported position in current 13F filings, implying an undisclosed or synthetic "whale" exit.
The rejection of a mechanical unwind confirms that a major discretionary holder has turned bearish or is facing external liquidity requirements, shifting the focus to broader sentiment erosion.
3. Market Microstructure: Dark Pools and Liquidity Constraints
Dark pools are optimized for institutional liquidity provision, designed to facilitate large-scale risk transfers while minimizing immediate price impact. Alex Thorn (Galaxy Digital) identified this as the largest IBIT dark pool trade on record, with Eric Balchunas (Bloomberg) noting the volume was 22 times larger than the day's next largest sell order.
The microstructural response to this trade highlights a lead-lag relationship between the ETF and spot markets:
Spot Volatility: Within 10 minutes of the 14:30 UTC print, Bitcoin spot price dropped 1.5% from $77,875 to $76,720, eventually sliding to $75,600.ETF Absorption: Despite the underlying spot volatility, the IBIT ETF price stabilized soon after. Analysts observed that the market "absorbed" the trade well within the fund structure itself, suggesting that while information leakage hit the spot market, the ETF's secondary market provided sufficient depth to prevent a cascading breakdown in the product's price relative to its NAV.
This divergence suggests that the ETF wrapper acted as a liquidity buffer, even as the scale of the exit signaled a breakdown in underlying support levels below the $80,000 threshold.
4. Macro-Sentiment and The Capital Rotation Narrative
The May 26 block trade was the apex of an 8-to-9-day net outflow streak (May 15–29) that saw total category AUM contract from $107.75 billion to $94.17 billion. This "capital flight" is not merely technical but reflective of a macro-pivot. Bitcoin has experienced a 16% decline year-to-date in 2026, causing it to drop to the 13th largest asset globally. This stands in stark contrast to the S&P 500’s nine-week rally and the surge in AI-linked equities and precious metals.
Specific macro-geopolitical catalysts have accelerated this rotation:
Regulatory Shifts: The "Clarity Act" has provided a compliance framework for digital assets but has ironically favored infrastructure-linked assets and Ethereum (fixing its compliance discount) while leaving Bitcoin exposed to a "risk-off" rotation.Geopolitical De-escalation: Reports of Iran ceasefire talks have eased global tensions, reducing the "geopolitical hedge" premium previously embedded in Bitcoin’s price.Institutional Position Trimming: 13F filings confirm mandate-driven de-risking by Tier-1 firms, with Jane Street reducing exposure by 70% and Goldman Sachs cutting positions by 10%.
5. Institutional Outlook: Market Maturity vs. Sentiment Shift
The IBIT block trade signals a "normalization" of institutional trading behavior, where billion-dollar exits are feasible but remain costly. The month of May saw IBIT record $1.41 billion in total net outflows, including the $528 million withdrawal on May 28—the second-largest daily outflow in the fund's history.
Strategic Takeaways for Institutional Allocators
Liquidity Reality & NAV Slippage: Billion-dollar exits now require significant concessions. Allocators must incorporate high-liquidity premiums (2%+ discounts) into their risk-management and exit-cost models for digital assets.Product Dominance as a "Primary Exit Ramp": IBIT has solidified its role as the market's primary liquidity venue. Institutions gravitate to BlackRock’s vehicle not just for entry, but because it provides the most robust infrastructure for massive, rapid counterparty risk transfers.Sentiment Indicator: The transition from technical arbitrage to discretionary de-risking suggests a fundamental re-evaluation of Bitcoin's role in the multi-asset portfolio. A seller’s willingness to accept a $29.5 million loss suggests that the perceived risk of holding the asset now outweighs the cost of a high-concession exit.
In conclusion, the May 26 IBIT block trade represents a structural milestone. While the infrastructure successfully facilitated the trade without a market-wide collapse, the event serves as a definitive reminder that institutional participation in digital assets remains subject to the same rigorous "risk-off" thresholds and mandate-driven de-risking as traditional asset classes. Institutional capital is increasingly mobile, and its presence is not a guarantee of permanent support.
#BTC #btcnews #CryptoNewsFlash
The $1.26 billion block trade of BlackRock’s iShares Bitcoin Trust (IBIT) on May 26, 2026, serves as a seminal stress test for the maturation of digital asset market microstructure. Executed at 10:30 a.m. (14:30 UTC), this transaction moved a significant volume of risk from the shadow of fragmented OTC desks into the regulated transparency of a U.S. ETF wrapper. While the scale confirms the product's ability to facilitate billion-dollar exits, the execution mechanics reveal a notable mandate-driven de-risking event rather than a tactical rebalance.
The core metrics of the transaction underscore a prioritization of speed over price optimization. Approximately 29.21 million shares of IBIT were traded off-exchange via the FINRA/Nasdaq TRF Carteret facility. The execution price was established at 43.16 per share—a 2.3% (1.01) discount relative to the contemporaneous market price of $44.17. For the seller, this resulted in an estimated $29.5 million execution cost. In clinical terms, this $29.5 million represents an "anonymity premium" paid to facilitate a massive counterparty risk transfer while attempting to mitigate the signaling risk inherent in visible exchange-based liquidations.
2. Deconstructing the "Basis Trade" Counter-Thesis
Within the current market regime, high-volume ETF spikes are frequently dismissed as the mechanical unwinding of "basis trades"—a market-neutral strategy where participants hold long spot ETF positions against short CME futures. However, structural data provided by NYDIG’s research team (Greg Cipolaro) suggests that the May 26 event was directional rather than arbitrage-related.
The 2.3% concession paid is incompatible with the tight margins of standard basis trades; such a discount would effectively negate the carry-trade yield. Furthermore, the absence of a corresponding footprint in the derivatives market is definitive. While the IBIT position represented exposure equivalent to roughly 3,700 CME $BTC futures contracts, only 91 contracts traded during the minute of execution, with no spike in volume observed.
Evidence Against Basis Trade Unwind
Metric
Observed Value
Strategic Implication
Execution Discount
2.3% ($1.01 per share)
Concession exceeds typical arbitrage margins; suggests non-arbitrage, directional motivation.
CME Futures Activity
91 contracts (vs. 3,700 required)
Lack of correlated futures volume rejects the "basis trade unwind" hypothesis.
Execution Venue
FINRA/Nasdaq TRF Carteret
Private negotiation indicates a deliberate strategic trade-off: paying a premium for anonymity.
Counterparty Identification
Exceeds all disclosed 13F holdings
Trade size surpasses every reported position in current 13F filings, implying an undisclosed or synthetic "whale" exit.
The rejection of a mechanical unwind confirms that a major discretionary holder has turned bearish or is facing external liquidity requirements, shifting the focus to broader sentiment erosion.
3. Market Microstructure: Dark Pools and Liquidity Constraints
Dark pools are optimized for institutional liquidity provision, designed to facilitate large-scale risk transfers while minimizing immediate price impact. Alex Thorn (Galaxy Digital) identified this as the largest IBIT dark pool trade on record, with Eric Balchunas (Bloomberg) noting the volume was 22 times larger than the day's next largest sell order.
The microstructural response to this trade highlights a lead-lag relationship between the ETF and spot markets:
Spot Volatility: Within 10 minutes of the 14:30 UTC print, Bitcoin spot price dropped 1.5% from $77,875 to $76,720, eventually sliding to $75,600.ETF Absorption: Despite the underlying spot volatility, the IBIT ETF price stabilized soon after. Analysts observed that the market "absorbed" the trade well within the fund structure itself, suggesting that while information leakage hit the spot market, the ETF's secondary market provided sufficient depth to prevent a cascading breakdown in the product's price relative to its NAV.
This divergence suggests that the ETF wrapper acted as a liquidity buffer, even as the scale of the exit signaled a breakdown in underlying support levels below the $80,000 threshold.
4. Macro-Sentiment and The Capital Rotation Narrative
The May 26 block trade was the apex of an 8-to-9-day net outflow streak (May 15–29) that saw total category AUM contract from $107.75 billion to $94.17 billion. This "capital flight" is not merely technical but reflective of a macro-pivot. Bitcoin has experienced a 16% decline year-to-date in 2026, causing it to drop to the 13th largest asset globally. This stands in stark contrast to the S&P 500’s nine-week rally and the surge in AI-linked equities and precious metals.
Specific macro-geopolitical catalysts have accelerated this rotation:
Regulatory Shifts: The "Clarity Act" has provided a compliance framework for digital assets but has ironically favored infrastructure-linked assets and Ethereum (fixing its compliance discount) while leaving Bitcoin exposed to a "risk-off" rotation.Geopolitical De-escalation: Reports of Iran ceasefire talks have eased global tensions, reducing the "geopolitical hedge" premium previously embedded in Bitcoin’s price.Institutional Position Trimming: 13F filings confirm mandate-driven de-risking by Tier-1 firms, with Jane Street reducing exposure by 70% and Goldman Sachs cutting positions by 10%.
5. Institutional Outlook: Market Maturity vs. Sentiment Shift
The IBIT block trade signals a "normalization" of institutional trading behavior, where billion-dollar exits are feasible but remain costly. The month of May saw IBIT record $1.41 billion in total net outflows, including the $528 million withdrawal on May 28—the second-largest daily outflow in the fund's history.
Strategic Takeaways for Institutional Allocators
Liquidity Reality & NAV Slippage: Billion-dollar exits now require significant concessions. Allocators must incorporate high-liquidity premiums (2%+ discounts) into their risk-management and exit-cost models for digital assets.Product Dominance as a "Primary Exit Ramp": IBIT has solidified its role as the market's primary liquidity venue. Institutions gravitate to BlackRock’s vehicle not just for entry, but because it provides the most robust infrastructure for massive, rapid counterparty risk transfers.Sentiment Indicator: The transition from technical arbitrage to discretionary de-risking suggests a fundamental re-evaluation of Bitcoin's role in the multi-asset portfolio. A seller’s willingness to accept a $29.5 million loss suggests that the perceived risk of holding the asset now outweighs the cost of a high-concession exit.
In conclusion, the May 26 IBIT block trade represents a structural milestone. While the infrastructure successfully facilitated the trade without a market-wide collapse, the event serves as a definitive reminder that institutional participation in digital assets remains subject to the same rigorous "risk-off" thresholds and mandate-driven de-risking as traditional asset classes. Institutional capital is increasingly mobile, and its presence is not a guarantee of permanent support.
#BTC #btcnews #CryptoNewsFlash
170
ບົດຄວາມ
"XRP Reaches $400M in Tokenized RWAs Faster Than Ethereum"XRPL has reached $400 million in tokenized real-world asset (RWA) value in just 15 months, significantly outpacing several major blockchain networks, including Ethereum.
Evernorth revealed this in a recent report, while XRP community commentator BankXRP amplified the findings across the crypto community. The comparison has drawn attention to XRPL’s accelerating tokenization activity and highlighted the network’s ability to scale at a pace comparable to some of the industry’s fastest-growing ecosystems.
Key Points
XRPL reached $400 million in tokenized real-world asset value within just 15 months. It took Ethereum 36 months to achieve a similar milestone. XRPL recorded 78% year-to-date growth in tokenized assets, rising from $227 million to $404 million.The network currently ranks tenth globally in represented tokenized value, while Ethereum remains the market leader with $16.8 billion.
XRPL Hits $400M in Tokenized Value Faster Than Ethereum
The report compared how long major blockchain networks took to grow from $10 million to $400 million in tokenized asset value. According to the data, XRPL completed the milestone in just 15 months, whereas Ethereum required 36 months to achieve the same level.
Specifically, XRPL’s tokenized RWA market stood at approximately $10 million in January 2025. However, the valuation surged to $400 million by April 2026, allowing the network to accomplish the feat within 14.9 months.
In contrast, Ethereum’s tokenized RWA market measured around $10 million in September 2018 before eventually climbing to $400 million in September 2021, roughly 35.9 months later. Additionally, the data showed that XRPL outpaced Avalanche and Polygon by six and seven months, respectively.
XRPL Outperforms Ethereum in YTD Growth
Furthermore, XRPL has also outperformed Ethereum in year-to-date tokenized asset growth. According to Evernorth, XRPL’s tokenized value increased by 78% this year, rising from $227 million to $404 million.
Meanwhile, Ethereum’s tokenized value grew by 36%, increasing from $13.8 billion to $18.66 billion during the same period. Notably, several other blockchain networks have also recorded strong tokenization growth in 2026.
Among blockchains with more than $200 million in tokenized assets, SEI leads with 858% year-to-date growth. Plume follows with 366%, while zkSync Era and Stellar recorded growth rates of 361% and 131%, respectively.
XRP Secures Top Position Among Enterprise-Focused Blockchain Networks
Meanwhile, XRPL has overtaken several enterprise-focused blockchain networks, including Aptos, Mantle, and Algorand. As of May 2025, XRPL ranked below those networks with a tokenized value of $116 million, while Aptos, Mantle, and Algorand stood at $120 million, $148 million, and $304 million, respectively.
However, the rankings have shifted significantly. XRPL now leads the group with $404 million in tokenized value, while Aptos and Algorand have declined to $64.9 million and $70.9 million, respectively. Although Mantle’s valuation climbed to $258 million, it remains below XRPL’s current level.
The development comes as competition intensifies among blockchain networks seeking dominance in the rapidly expanding tokenization market. According to data from RWA.xyz, XRPL currently ranks tenth globally in ‘represented’ tokenized value at $404.4 million. Nonetheless, Ethereum continues to dominate the sector with a tokenized valuation of $16.8 billion.
#CryptoNewsFlash
"XRP Reaches $400M in Tokenized RWAs Faster Than Ethereum"
XRPL has reached $400 million in tokenized real-world asset (RWA) value in just 15 months, significantly outpacing several major blockchain networks, including Ethereum.
Evernorth revealed this in a recent report, while XRP community commentator BankXRP amplified the findings across the crypto community. The comparison has drawn attention to XRPL’s accelerating tokenization activity and highlighted the network’s ability to scale at a pace comparable to some of the industry’s fastest-growing ecosystems.
Key Points
XRPL reached $400 million in tokenized real-world asset value within just 15 months. It took Ethereum 36 months to achieve a similar milestone. XRPL recorded 78% year-to-date growth in tokenized assets, rising from $227 million to $404 million.The network currently ranks tenth globally in represented tokenized value, while Ethereum remains the market leader with $16.8 billion.
XRPL Hits $400M in Tokenized Value Faster Than Ethereum
The report compared how long major blockchain networks took to grow from $10 million to $400 million in tokenized asset value. According to the data, XRPL completed the milestone in just 15 months, whereas Ethereum required 36 months to achieve the same level.
Specifically, XRPL’s tokenized RWA market stood at approximately $10 million in January 2025. However, the valuation surged to $400 million by April 2026, allowing the network to accomplish the feat within 14.9 months.
In contrast, Ethereum’s tokenized RWA market measured around $10 million in September 2018 before eventually climbing to $400 million in September 2021, roughly 35.9 months later. Additionally, the data showed that XRPL outpaced Avalanche and Polygon by six and seven months, respectively.
XRPL Outperforms Ethereum in YTD Growth
Furthermore, XRPL has also outperformed Ethereum in year-to-date tokenized asset growth. According to Evernorth, XRPL’s tokenized value increased by 78% this year, rising from $227 million to $404 million.
Meanwhile, Ethereum’s tokenized value grew by 36%, increasing from $13.8 billion to $18.66 billion during the same period. Notably, several other blockchain networks have also recorded strong tokenization growth in 2026.
Among blockchains with more than $200 million in tokenized assets, SEI leads with 858% year-to-date growth. Plume follows with 366%, while zkSync Era and Stellar recorded growth rates of 361% and 131%, respectively.
XRP Secures Top Position Among Enterprise-Focused Blockchain Networks
Meanwhile, XRPL has overtaken several enterprise-focused blockchain networks, including Aptos, Mantle, and Algorand. As of May 2025, XRPL ranked below those networks with a tokenized value of $116 million, while Aptos, Mantle, and Algorand stood at $120 million, $148 million, and $304 million, respectively.
However, the rankings have shifted significantly. XRPL now leads the group with $404 million in tokenized value, while Aptos and Algorand have declined to $64.9 million and $70.9 million, respectively. Although Mantle’s valuation climbed to $258 million, it remains below XRPL’s current level.
The development comes as competition intensifies among blockchain networks seeking dominance in the rapidly expanding tokenization market. According to data from RWA.xyz, XRPL currently ranks tenth globally in ‘represented’ tokenized value at $404.4 million. Nonetheless, Ethereum continues to dominate the sector with a tokenized valuation of $16.8 billion.
#CryptoNewsFlash
Evernorth revealed this in a recent report, while XRP community commentator BankXRP amplified the findings across the crypto community. The comparison has drawn attention to XRPL’s accelerating tokenization activity and highlighted the network’s ability to scale at a pace comparable to some of the industry’s fastest-growing ecosystems.
Key Points
XRPL reached $400 million in tokenized real-world asset value within just 15 months. It took Ethereum 36 months to achieve a similar milestone. XRPL recorded 78% year-to-date growth in tokenized assets, rising from $227 million to $404 million.The network currently ranks tenth globally in represented tokenized value, while Ethereum remains the market leader with $16.8 billion.
XRPL Hits $400M in Tokenized Value Faster Than Ethereum
The report compared how long major blockchain networks took to grow from $10 million to $400 million in tokenized asset value. According to the data, XRPL completed the milestone in just 15 months, whereas Ethereum required 36 months to achieve the same level.
Specifically, XRPL’s tokenized RWA market stood at approximately $10 million in January 2025. However, the valuation surged to $400 million by April 2026, allowing the network to accomplish the feat within 14.9 months.
In contrast, Ethereum’s tokenized RWA market measured around $10 million in September 2018 before eventually climbing to $400 million in September 2021, roughly 35.9 months later. Additionally, the data showed that XRPL outpaced Avalanche and Polygon by six and seven months, respectively.
XRPL Outperforms Ethereum in YTD Growth
Furthermore, XRPL has also outperformed Ethereum in year-to-date tokenized asset growth. According to Evernorth, XRPL’s tokenized value increased by 78% this year, rising from $227 million to $404 million.
Meanwhile, Ethereum’s tokenized value grew by 36%, increasing from $13.8 billion to $18.66 billion during the same period. Notably, several other blockchain networks have also recorded strong tokenization growth in 2026.
Among blockchains with more than $200 million in tokenized assets, SEI leads with 858% year-to-date growth. Plume follows with 366%, while zkSync Era and Stellar recorded growth rates of 361% and 131%, respectively.
XRP Secures Top Position Among Enterprise-Focused Blockchain Networks
Meanwhile, XRPL has overtaken several enterprise-focused blockchain networks, including Aptos, Mantle, and Algorand. As of May 2025, XRPL ranked below those networks with a tokenized value of $116 million, while Aptos, Mantle, and Algorand stood at $120 million, $148 million, and $304 million, respectively.
However, the rankings have shifted significantly. XRPL now leads the group with $404 million in tokenized value, while Aptos and Algorand have declined to $64.9 million and $70.9 million, respectively. Although Mantle’s valuation climbed to $258 million, it remains below XRPL’s current level.
The development comes as competition intensifies among blockchain networks seeking dominance in the rapidly expanding tokenization market. According to data from RWA.xyz, XRPL currently ranks tenth globally in ‘represented’ tokenized value at $404.4 million. Nonetheless, Ethereum continues to dominate the sector with a tokenized valuation of $16.8 billion.
#CryptoNewsFlash
1
904
ບົດຄວາມ
XRP at $10 Would Mean a $620 Billion Valuation, Analyst Says It’s Still More Achievable Than SpaceXXRP YouTuber Zach Rector has compared the upside potential of XRP with that of newly public aerospace giant SpaceX.
He argued that XRP offers a more realistic path to a 9x return on investment.
In a post on X, Rector said XRP reaching $10 would generate roughly a ninefold return for investors. By comparison, he noted that SpaceX would need to grow into a $15 trillion company to deliver similar gains from its recent IPO valuation.
“Same return. Wildly different odds,” Rector wrote.
XRP at $10 Could Push Valuation Above $600 Billion
In a YouTube video, Rector explained the math behind his comparison. He noted XRP was trading around $1.13 with a market capitalization of about $77 billion and a circulating supply of roughly 62 billion tokens.
Under those conditions, a move to $10 would represent an increase of about 800%, turning a $1 investment into nearly $9. XRP’s market capitalization would also climb to around $620 billion.
Rector acknowledged that a valuation above $600 billion sounds enormous. However, he argued it remains achievable given XRP’s ambitions in global payments and tokenized assets.
He added that if XRP’s circulating supply eventually expands to its 100 billion maximum, a $10 price would imply a valuation of roughly $1 trillion.
According to Rector, both scenarios remain “very doable” over the long term.
SpaceX Faces a Much Bigger Challenge
Meanwhile, Rector contrasted XRP’s outlook with SpaceX, which recently went public at a valuation of about $1.75 trillion and briefly traded above a $2 trillion market capitalization.
To generate the same 9x return as XRP reaching $10, SpaceX would need to achieve a valuation of roughly $15 trillion to $16 trillion, he said.
According to Rector, that figure would exceed the combined value of the world’s three largest companies today. It would also require SpaceX to reach an unprecedented level of corporate valuation.
He emphasized that the comparison was not meant as criticism of SpaceX or its founder, Elon Musk. Rather, he said he was simply evaluating the likelihood of each asset producing similar returns.
Why Rector Favors XRP
Rector argued that crypto markets have already shown that digital assets can reach valuations in the hundreds of billions of dollars. He pointed to the growth of Bitcoin and Ethereum as examples.
By contrast, he said SpaceX would need to become several times larger than today’s biggest public companies to provide comparable gains.
Rector also noted that many of SpaceX’s largest gains were captured by early private investors and venture capital firms during the company’s two decades as a private business.
While he acknowledged that public investors could still profit from SpaceX, he concluded that XRP price has the better chance of delivering a 9x return over the next three to five years.
#CryptoNewsFlash
XRP at $10 Would Mean a $620 Billion Valuation, Analyst Says It’s Still More Achievable Than SpaceX
XRP YouTuber Zach Rector has compared the upside potential of XRP with that of newly public aerospace giant SpaceX.
He argued that XRP offers a more realistic path to a 9x return on investment.
In a post on X, Rector said XRP reaching $10 would generate roughly a ninefold return for investors. By comparison, he noted that SpaceX would need to grow into a $15 trillion company to deliver similar gains from its recent IPO valuation.
“Same return. Wildly different odds,” Rector wrote.
XRP at $10 Could Push Valuation Above $600 Billion
In a YouTube video, Rector explained the math behind his comparison. He noted XRP was trading around $1.13 with a market capitalization of about $77 billion and a circulating supply of roughly 62 billion tokens.
Under those conditions, a move to $10 would represent an increase of about 800%, turning a $1 investment into nearly $9. XRP’s market capitalization would also climb to around $620 billion.
Rector acknowledged that a valuation above $600 billion sounds enormous. However, he argued it remains achievable given XRP’s ambitions in global payments and tokenized assets.
He added that if XRP’s circulating supply eventually expands to its 100 billion maximum, a $10 price would imply a valuation of roughly $1 trillion.
According to Rector, both scenarios remain “very doable” over the long term.
SpaceX Faces a Much Bigger Challenge
Meanwhile, Rector contrasted XRP’s outlook with SpaceX, which recently went public at a valuation of about $1.75 trillion and briefly traded above a $2 trillion market capitalization.
To generate the same 9x return as XRP reaching $10, SpaceX would need to achieve a valuation of roughly $15 trillion to $16 trillion, he said.
According to Rector, that figure would exceed the combined value of the world’s three largest companies today. It would also require SpaceX to reach an unprecedented level of corporate valuation.
He emphasized that the comparison was not meant as criticism of SpaceX or its founder, Elon Musk. Rather, he said he was simply evaluating the likelihood of each asset producing similar returns.
Why Rector Favors XRP
Rector argued that crypto markets have already shown that digital assets can reach valuations in the hundreds of billions of dollars. He pointed to the growth of Bitcoin and Ethereum as examples.
By contrast, he said SpaceX would need to become several times larger than today’s biggest public companies to provide comparable gains.
Rector also noted that many of SpaceX’s largest gains were captured by early private investors and venture capital firms during the company’s two decades as a private business.
While he acknowledged that public investors could still profit from SpaceX, he concluded that XRP price has the better chance of delivering a 9x return over the next three to five years.
#CryptoNewsFlash
He argued that XRP offers a more realistic path to a 9x return on investment.
In a post on X, Rector said XRP reaching $10 would generate roughly a ninefold return for investors. By comparison, he noted that SpaceX would need to grow into a $15 trillion company to deliver similar gains from its recent IPO valuation.
“Same return. Wildly different odds,” Rector wrote.
XRP at $10 Could Push Valuation Above $600 Billion
In a YouTube video, Rector explained the math behind his comparison. He noted XRP was trading around $1.13 with a market capitalization of about $77 billion and a circulating supply of roughly 62 billion tokens.
Under those conditions, a move to $10 would represent an increase of about 800%, turning a $1 investment into nearly $9. XRP’s market capitalization would also climb to around $620 billion.
Rector acknowledged that a valuation above $600 billion sounds enormous. However, he argued it remains achievable given XRP’s ambitions in global payments and tokenized assets.
He added that if XRP’s circulating supply eventually expands to its 100 billion maximum, a $10 price would imply a valuation of roughly $1 trillion.
According to Rector, both scenarios remain “very doable” over the long term.
SpaceX Faces a Much Bigger Challenge
Meanwhile, Rector contrasted XRP’s outlook with SpaceX, which recently went public at a valuation of about $1.75 trillion and briefly traded above a $2 trillion market capitalization.
To generate the same 9x return as XRP reaching $10, SpaceX would need to achieve a valuation of roughly $15 trillion to $16 trillion, he said.
According to Rector, that figure would exceed the combined value of the world’s three largest companies today. It would also require SpaceX to reach an unprecedented level of corporate valuation.
He emphasized that the comparison was not meant as criticism of SpaceX or its founder, Elon Musk. Rather, he said he was simply evaluating the likelihood of each asset producing similar returns.
Why Rector Favors XRP
Rector argued that crypto markets have already shown that digital assets can reach valuations in the hundreds of billions of dollars. He pointed to the growth of Bitcoin and Ethereum as examples.
By contrast, he said SpaceX would need to become several times larger than today’s biggest public companies to provide comparable gains.
Rector also noted that many of SpaceX’s largest gains were captured by early private investors and venture capital firms during the company’s two decades as a private business.
While he acknowledged that public investors could still profit from SpaceX, he concluded that XRP price has the better chance of delivering a 9x return over the next three to five years.
#CryptoNewsFlash
1
348
ບົດຄວາມ
"Cardano Stablecoin Market Surges 14.67% as Valuation Climbs Above $60M"The stablecoin market on the #Cardano network recorded a double-digit increase over the past week, pushing its valuation above the $60 million mark.
According to data from DeFiLlama, Cardano’s stablecoin market cap climbed to $60.39 million, representing a 14.67% increase over the past seven days. The rise marks one of the strongest short-term expansions in the network’s stablecoin sector in recent months and signals increasing participation in Cardano’s decentralized finance ecosystem.
Cardano Stablecoin Market Cap Soars
USDCx Fuels Cardano Stablecoin Valuation
The surge came only days after an unidentified user bridged more than $10 million worth of USDCx onto the Cardano blockchain. Several ecosystem participants highlighted the transaction, including Cardano DeFi aggregator DEX Hunter.
Meanwhile, additional USDCx tokens have continued to enter circulation on Cardano. Data shared by SNEK co-founder Rami indicates that roughly $4.5 million worth of USDCx was minted on the network within two days, further strengthening stablecoin liquidity. As a result, the fresh capital inflow has deepened liquidity across the ecosystem.
USDCx, the Circle-backed stablecoin introduced to Cardano earlier this year, has quickly established itself as the dominant stable asset on the network.
Currently, USDCx commands a market share of 59.38%, accounting for $35.85 million of Cardano’s total $60.39 million stablecoin market cap. The rapid growth highlights increasing adoption of the asset as users seek seamless access to cross-chain liquidity within the ecosystem.
Stablecoin Growth Supports Total Value Locked
The rise in stablecoin liquidity also lifted Cardano’s total value locked (TVL), which climbed to approximately $82 million earlier this week before retreating to around $75 million following the latest decline in ADA’s price.
Despite the pullback, analysts believe the recent increase in stablecoin reserves provides a stronger foundation for future DeFi expansion on the network. Cardano research analyst Dr. Cuadrado believes the recent influx of stablecoin liquidity marks the beginning of a major growth phase for the ecosystem.
According to him, the most explosive stage of the current bull market could begin once Cardano’s stablecoin market cap surpasses its total value locked. He argued that such a development would signal the presence of excess liquidity waiting to be deployed across decentralized applications.
In his view, higher stablecoin reserves would lead to deeper liquidity pools, increased borrowing and lending activity, larger trading volumes, and more attractive yield opportunities across the network.
ADA Remains Under Pressure Despite Improving Fundamentals
Meanwhile, ADA continues to face bearish pressure despite the improvement in on-chain metrics. The asset has gradually slipped down the global cryptocurrency rankings and currently stands as the world’s 18th-largest crypto by market cap.
At press time, ADA had a market valuation of $5.53 billion and traded at $0.1519 per token, representing a 35.43% decrease over the past month.
#CryptoNewsFlash
"Cardano Stablecoin Market Surges 14.67% as Valuation Climbs Above $60M"
The stablecoin market on the #Cardano network recorded a double-digit increase over the past week, pushing its valuation above the $60 million mark.
According to data from DeFiLlama, Cardano’s stablecoin market cap climbed to $60.39 million, representing a 14.67% increase over the past seven days. The rise marks one of the strongest short-term expansions in the network’s stablecoin sector in recent months and signals increasing participation in Cardano’s decentralized finance ecosystem.
Cardano Stablecoin Market Cap Soars
USDCx Fuels Cardano Stablecoin Valuation
The surge came only days after an unidentified user bridged more than $10 million worth of USDCx onto the Cardano blockchain. Several ecosystem participants highlighted the transaction, including Cardano DeFi aggregator DEX Hunter.
Meanwhile, additional USDCx tokens have continued to enter circulation on Cardano. Data shared by SNEK co-founder Rami indicates that roughly $4.5 million worth of USDCx was minted on the network within two days, further strengthening stablecoin liquidity. As a result, the fresh capital inflow has deepened liquidity across the ecosystem.
USDCx, the Circle-backed stablecoin introduced to Cardano earlier this year, has quickly established itself as the dominant stable asset on the network.
Currently, USDCx commands a market share of 59.38%, accounting for $35.85 million of Cardano’s total $60.39 million stablecoin market cap. The rapid growth highlights increasing adoption of the asset as users seek seamless access to cross-chain liquidity within the ecosystem.
Stablecoin Growth Supports Total Value Locked
The rise in stablecoin liquidity also lifted Cardano’s total value locked (TVL), which climbed to approximately $82 million earlier this week before retreating to around $75 million following the latest decline in ADA’s price.
Despite the pullback, analysts believe the recent increase in stablecoin reserves provides a stronger foundation for future DeFi expansion on the network. Cardano research analyst Dr. Cuadrado believes the recent influx of stablecoin liquidity marks the beginning of a major growth phase for the ecosystem.
According to him, the most explosive stage of the current bull market could begin once Cardano’s stablecoin market cap surpasses its total value locked. He argued that such a development would signal the presence of excess liquidity waiting to be deployed across decentralized applications.
In his view, higher stablecoin reserves would lead to deeper liquidity pools, increased borrowing and lending activity, larger trading volumes, and more attractive yield opportunities across the network.
ADA Remains Under Pressure Despite Improving Fundamentals
Meanwhile, ADA continues to face bearish pressure despite the improvement in on-chain metrics. The asset has gradually slipped down the global cryptocurrency rankings and currently stands as the world’s 18th-largest crypto by market cap.
At press time, ADA had a market valuation of $5.53 billion and traded at $0.1519 per token, representing a 35.43% decrease over the past month.
#CryptoNewsFlash
According to data from DeFiLlama, Cardano’s stablecoin market cap climbed to $60.39 million, representing a 14.67% increase over the past seven days. The rise marks one of the strongest short-term expansions in the network’s stablecoin sector in recent months and signals increasing participation in Cardano’s decentralized finance ecosystem.
Cardano Stablecoin Market Cap Soars
USDCx Fuels Cardano Stablecoin Valuation
The surge came only days after an unidentified user bridged more than $10 million worth of USDCx onto the Cardano blockchain. Several ecosystem participants highlighted the transaction, including Cardano DeFi aggregator DEX Hunter.
Meanwhile, additional USDCx tokens have continued to enter circulation on Cardano. Data shared by SNEK co-founder Rami indicates that roughly $4.5 million worth of USDCx was minted on the network within two days, further strengthening stablecoin liquidity. As a result, the fresh capital inflow has deepened liquidity across the ecosystem.
USDCx, the Circle-backed stablecoin introduced to Cardano earlier this year, has quickly established itself as the dominant stable asset on the network.
Currently, USDCx commands a market share of 59.38%, accounting for $35.85 million of Cardano’s total $60.39 million stablecoin market cap. The rapid growth highlights increasing adoption of the asset as users seek seamless access to cross-chain liquidity within the ecosystem.
Stablecoin Growth Supports Total Value Locked
The rise in stablecoin liquidity also lifted Cardano’s total value locked (TVL), which climbed to approximately $82 million earlier this week before retreating to around $75 million following the latest decline in ADA’s price.
Despite the pullback, analysts believe the recent increase in stablecoin reserves provides a stronger foundation for future DeFi expansion on the network. Cardano research analyst Dr. Cuadrado believes the recent influx of stablecoin liquidity marks the beginning of a major growth phase for the ecosystem.
According to him, the most explosive stage of the current bull market could begin once Cardano’s stablecoin market cap surpasses its total value locked. He argued that such a development would signal the presence of excess liquidity waiting to be deployed across decentralized applications.
In his view, higher stablecoin reserves would lead to deeper liquidity pools, increased borrowing and lending activity, larger trading volumes, and more attractive yield opportunities across the network.
ADA Remains Under Pressure Despite Improving Fundamentals
Meanwhile, ADA continues to face bearish pressure despite the improvement in on-chain metrics. The asset has gradually slipped down the global cryptocurrency rankings and currently stands as the world’s 18th-largest crypto by market cap.
At press time, ADA had a market valuation of $5.53 billion and traded at $0.1519 per token, representing a 35.43% decrease over the past month.
#CryptoNewsFlash
76

ບົດຄວາມ
"Elon Musk Cryptos in 2026: Top Coins and Real Holdings"Musk’s actual involvement in crypto is much smaller and more cautious than many people think.
This guide explains what crypto Elon Musk personally owns, what his companies hold, which coins are truly connected to him, and how to avoid scams using his name.
What Are Elon Musk Cryptos?
The phrase “Elon Musk cryptos” refers to two things.
First, the coins Musk has confirmed he owns: Bitcoin (BTC), Ethereum (ETH), and Dogecoin (DOGE). These are major, well-established cryptocurrencies with billions traded daily.
His companies, Tesla and SpaceX, also hold large amounts of Bitcoin, making them among the largest corporate holders in the world.
The second category includes hundreds of coins that use Musk’s name or image, like “ElonCoin,” “MuskToken,” and “X Coin.” These have no real connection to him, are created by third parties, and are almost always very risky. Musk has clearly stated he is not involved with any of them.
Elon Musk’s Confirmed Crypto Holdings in 2026
In July 2021, Musk confirmed that he personally owns Bitcoin, Ethereum, and Dogecoin. At The B Word conference and on social media, he joked that these are just “ASCII hash strings,” highlighting that cryptocurrencies are really just digital data. As of 2026, he has not announced owning any other coins.
Bitcoin (BTC)
Musk received 0.25 BTC from a friend in 2018, the earliest known record of his Bitcoin holdings. He has not disclosed how much he currently owns. While he does hold Bitcoin, Musk has criticized it for using too much energy.
Tesla even paused BTC payments in 2021 because of this and its slow speed, which he said stems from how it was originally designed in 2008.
Ethereum (ETH)
Confirmed at The B Word conference in 2021, Musk described Ethereum as a practical smart contract network rather than a meme asset. However, he has not revealed specific quantities and has made fewer public comments about ETH than about the other two coins.
Dogecoin (DOGE)
This is where Musk’s enthusiasm is most visible and documented. He has championed Dogecoin since at least 2019, citing its lower transaction fees, faster block times, and the community-driven, humorous spirit of the project.
He has referred to it as a “people’s crypto” on multiple occasions. Despite acknowledging its origins as a joke, Musk argues that its blockchain infrastructure makes it more practical for everyday payments than Bitcoin.
What Musk Does Not Hold
In October 2021, when asked directly by a social media user how much Shiba Inu (SHIB) he owned, Musk replied, “None.”
He has issued similar denials for other tokens bearing his name or image. To date, Musk has publicly stated that his only personal cryptocurrency holdings are Bitcoin, Ethereum, and Dogecoin.
Corporate Holdings: Tesla and SpaceX
Musk’s influence on crypto is not limited to his personal wallet. Two of his companies hold substantial Bitcoin positions, and their actions have at times moved global markets.
Tesla
In February 2021, Tesla bought $1.5 billion worth of Bitcoin, helping drive a major market rally. The company later sold some to raise cash. As of today, Tesla holds 11,509 BTC, bought for about $386 million, making it one of the largest corporate Bitcoin holders.
Tesla also holds Dogecoin and has accepted DOGE for online merchandise since January 2022. Notably, Tesla has not fully separated its BTC and DOGE values in its most recent digital-asset disclosures.
SpaceX
SpaceX has maintained Bitcoin holdings since 2021, though the company has historically been less transparent than Tesla about its exact position. In July 2025, blockchain analytics identified a SpaceX-controlled wallet transferring approximately $153.7 million in BTC. Even after that transfer, SpaceX reportedly retained over $850 million in Bitcoin reserves.
Top Elon Musk Cryptos by Market Relevance in 2026
Bitcoin
Bitcoin remains the largest and most important crypto in Musk’s confirmed holdings and Tesla’s treasury. In 2025, Musk’s new political group, the America Party, took a pro-Bitcoin stance, adding a political angle to his crypto involvement. Experts speculate he may buy more BTC in 2026, but nothing is certain.
Dogecoin
Dogecoin is the crypto most closely tied to Musk. Once a joke coin, DOGE has survived while many other projects failed, thanks to Elon Musk’s backing.
In early 2026, DOGE ETFs launched, bringing in millions of dollars in inflows. It’s accepted at AMC Theatres, tested at GameStop, and usable for Tesla merchandise. While its price no longer spikes dramatically after Musk’s comments, DOGE still has a market value above $15 billion.
Ethereum
While Musk owns Ethereum, he has also praised its smart-contract capabilities. He talks less about ETH than Dogecoin, but his confirmed holdings keep it relevant. Ethereum’s widespread use in DeFi, NFTs, and stablecoins gives it a strong market presence that even Musk cannot drastically move.
How Elon Musk Influences the Crypto Market
Musk’s influence on digital assets operates through several distinct channels:
Social media posts.
One post on X, a meme, a short reply, or an endorsement, can move prices, especially for Dogecoin and other meme coins. Studies tracking engagement between 2024 and 2026 show that Musk’s posts remain among the most reacted-to financial messages online.
However, the magnitude of these moves has diminished as the market has grown and diversified. Price swings after his comments now tend to be smaller and shorter-lived than in 2020–2021.
Corporate treasury decisions
Tesla’s $1.5 billion Bitcoin purchase in 2021 showed that major companies could hold crypto as a treasury asset. That decision triggered a market rally worth tens of billions in capitalization. Subsequent moves, such as partial BTC sales and DOGE integration for merchandise, continue to set precedents that other companies closely watch.
Payment integration signals
Musk has promoted Dogecoin payments on X and in real-world projects like the Las Vegas Loop. X Money, a payment system under development, fuels speculation about broader crypto use.
Political and regulatory signals
Musk’s advisory role in the U.S. government’s DOGE Department (2024–2025) and public comments on blockchain and regulation shape how lawmakers and regulators approach crypto.
The SpaceX–xAI merger.
In February 2026, SpaceX acquired Musk’s AI company xAI in a $1.25 trillion all-stock deal. This sparked speculation about potential crypto use in space-based AI and satellite networks.
Overall, the “Musk effect” is mostly a sentiment amplifier: in strong markets, it can accelerate rallies; in weak markets, attention-driven assets may fall faster.
Top Elon Musk Meme Coins to Watch in 2026
Dogecoin (DOGE)
The only meme coin with a real, documented connection to Musk. DOGE is still the main celebrity-driven crypto and has more support than most meme coins thanks to its spot ETF pipeline and growing merchant adoption.
One caution: unlike Bitcoin, DOGE has no supply cap; around 5 billion new DOGE are created each year, which matters for long-term holders.
Floki (FLOKI)
Named after Musk’s Shiba Inu puppy, Floki launched in 2021 and quickly became a well-known meme coin. Unlike purely speculative tokens, Floki has a real ecosystem: a play-to-earn game (Valhalla), DeFi products (FlokiFi), and an educational platform (Floki University).
It runs on Ethereum and BNB Chain and has marketing partnerships with sports teams worldwide. Floki combines meme culture with real development, making it unique in the space.
Shiba Inu (SHIB) Launched as a “Dogecoin killer,” SHIB is the largest Ethereum-based meme coin by market cap. It now has its own ecosystem, including a decentralized exchange (ShibaSwap), a Layer-2 blockchain (Shibarium), and governance tokens (LEASH and BONE).
Musk has confirmed he does not hold SHIB, but its size and liquidity make it a major player in the meme-coin world. Notably, half of SHIB’s supply was originally sent to Ethereum co-founder Vitalik Buterin, who donated part of it to COVID-19 relief in India.
Pepe (PEPE) Inspired by the Pepe the Frog meme, PEPE launched in April 2023 and hit a $1 billion market cap in just three weeks. It has stayed popular longer than many competitors.
While Musk isn’t directly connected, his activity often fuels the meme-coin market, which benefits PEPE. Its strong liquidity and listing on major exchanges make it easy to trade.
Bonk (BONK) A Solana-based meme coin, BONK was airdropped to community members during a challenging period for the Solana network. It has grown into one of Solana’s main community tokens, with fast transactions and increasing exchange support. Musk isn’t directly involved, but his influence on risk-on sentiment benefits it.
The Legal Landscape: The Dogecoin Lawsuit In June 2022, a Dogecoin investor sued Elon Musk, Tesla, and SpaceX, alleging they ran a pyramid scheme by promoting Dogecoin and seeking $258 billion in damages. Musk’s lawyers argued that his posts and memes were protected speech, not market manipulation.
The case was dismissed by a federal judge in August 2024. The plaintiffs dropped their appeal in November 2024, ending the lawsuit.
Analysts view this as a key test of how the law treats celebrity influence in crypto markets.
How to Verify Any “Official” Musk Crypto Claim Given the volume of scams exploiting Musk’s name, a basic verification checklist is essential before engaging with any token claiming his association:
Check the primary source. Musk’s confirmed statements come from his verified X account (@elonmusk) and SEC filings related to Tesla’s treasury. Any claim of a new holding, endorsement, or official partnership not originating from these sources should be treated as unverified.
Look for SEC disclosures.
Corporate crypto holdings are reported in quarterly and annual filings. If a claim about Tesla or SpaceX holding a new token cannot be verified in SEC or equivalent regulatory filings, it is almost certainly false.
Search Musk’s X history.
His feed is public and searchable. Genuine endorsements will have traceable posts. Be cautious of screenshots without verifiable links; they can easily be fabricated.
Ignore influencer amplification.
Musk does not run personal tokens. Any coin claiming to be the “official Elon Musk token” is a third-party creation.
Beware of hype.
Numerous accounts on X, YouTube, and Telegram claim exclusive knowledge of Musk’s “next crypto pick”. None of them has verified information. This content is designed to manufacture urgency and drive purchases that benefit early holders at the expense of later buyers.
How to Evaluate Elon Musk Crypto Before Investing
Whether it’s a confirmed holding like Bitcoin, Ethereum, or Dogecoin, or a meme coin linked to Musk, following a clear evaluation process helps reduce risk:
Assess fundamentals independently of Musk Ask: Would this coin have value without Musk’s attention? Bitcoin and Ethereum clearly would. Dogecoin has some real-world use and recognition. Many meme coins fail this test.
Check liquidity and market cap
Low liquidity can cause wild price swings. A high market cap with low trading volume may be misleading. Favor coins that trade on major exchanges with real activity.
Understand tokenomics
Look at supply rules, inflation, and founder vesting schedules. For example, DOGE has no supply cap, with 5 billion new coins minted yearly. This does not automatically disqualify it, but should guide expectations.
Size your position wisely
Musk-linked meme coins can rise or fall dramatically. Treat them as small, speculative parts of your portfolio, not core holdings.
Watch for market manipulation
Rapid price jumps without news are often engineered by early holders or coordinated groups. These “pump-and-dump” moves can trap inexperienced investors.
The Bottom Line In 2026, Elon Musk’s confirmed crypto holdings are straightforward: Bitcoin, Ethereum, and Dogecoin, along with significant Bitcoin exposure through Tesla and SpaceX. Beyond these, many coins claim a connection to him without proof.
The “Musk effect” is real, but changing. Price moves from his comments are smaller and shorter than in earlier years. The market now rewards real utility, strong communities, and solid fundamentals alongside hype. Musk remains a major influence, but the crypto ecosystem is more complex and competitive than ever.
For investors, the rule is simple: verify the connection, focus on fundamentals, and do not rely on celebrity endorsements instead of research.
#CryptoNewsFlash
"Elon Musk Cryptos in 2026: Top Coins and Real Holdings"
Musk’s actual involvement in crypto is much smaller and more cautious than many people think.
This guide explains what crypto Elon Musk personally owns, what his companies hold, which coins are truly connected to him, and how to avoid scams using his name.
What Are Elon Musk Cryptos?
The phrase “Elon Musk cryptos” refers to two things.
First, the coins Musk has confirmed he owns: Bitcoin (BTC), Ethereum (ETH), and Dogecoin (DOGE). These are major, well-established cryptocurrencies with billions traded daily.
His companies, Tesla and SpaceX, also hold large amounts of Bitcoin, making them among the largest corporate holders in the world.
The second category includes hundreds of coins that use Musk’s name or image, like “ElonCoin,” “MuskToken,” and “X Coin.” These have no real connection to him, are created by third parties, and are almost always very risky. Musk has clearly stated he is not involved with any of them.
Elon Musk’s Confirmed Crypto Holdings in 2026
In July 2021, Musk confirmed that he personally owns Bitcoin, Ethereum, and Dogecoin. At The B Word conference and on social media, he joked that these are just “ASCII hash strings,” highlighting that cryptocurrencies are really just digital data. As of 2026, he has not announced owning any other coins.
Bitcoin (BTC)
Musk received 0.25 BTC from a friend in 2018, the earliest known record of his Bitcoin holdings. He has not disclosed how much he currently owns. While he does hold Bitcoin, Musk has criticized it for using too much energy.
Tesla even paused BTC payments in 2021 because of this and its slow speed, which he said stems from how it was originally designed in 2008.
Ethereum (ETH)
Confirmed at The B Word conference in 2021, Musk described Ethereum as a practical smart contract network rather than a meme asset. However, he has not revealed specific quantities and has made fewer public comments about ETH than about the other two coins.
Dogecoin (DOGE)
This is where Musk’s enthusiasm is most visible and documented. He has championed Dogecoin since at least 2019, citing its lower transaction fees, faster block times, and the community-driven, humorous spirit of the project.
He has referred to it as a “people’s crypto” on multiple occasions. Despite acknowledging its origins as a joke, Musk argues that its blockchain infrastructure makes it more practical for everyday payments than Bitcoin.
What Musk Does Not Hold
In October 2021, when asked directly by a social media user how much Shiba Inu (SHIB) he owned, Musk replied, “None.”
He has issued similar denials for other tokens bearing his name or image. To date, Musk has publicly stated that his only personal cryptocurrency holdings are Bitcoin, Ethereum, and Dogecoin.
Corporate Holdings: Tesla and SpaceX
Musk’s influence on crypto is not limited to his personal wallet. Two of his companies hold substantial Bitcoin positions, and their actions have at times moved global markets.
Tesla
In February 2021, Tesla bought $1.5 billion worth of Bitcoin, helping drive a major market rally. The company later sold some to raise cash. As of today, Tesla holds 11,509 BTC, bought for about $386 million, making it one of the largest corporate Bitcoin holders.
Tesla also holds Dogecoin and has accepted DOGE for online merchandise since January 2022. Notably, Tesla has not fully separated its BTC and DOGE values in its most recent digital-asset disclosures.
SpaceX
SpaceX has maintained Bitcoin holdings since 2021, though the company has historically been less transparent than Tesla about its exact position. In July 2025, blockchain analytics identified a SpaceX-controlled wallet transferring approximately $153.7 million in BTC. Even after that transfer, SpaceX reportedly retained over $850 million in Bitcoin reserves.
Top Elon Musk Cryptos by Market Relevance in 2026
Bitcoin
Bitcoin remains the largest and most important crypto in Musk’s confirmed holdings and Tesla’s treasury. In 2025, Musk’s new political group, the America Party, took a pro-Bitcoin stance, adding a political angle to his crypto involvement. Experts speculate he may buy more BTC in 2026, but nothing is certain.
Dogecoin
Dogecoin is the crypto most closely tied to Musk. Once a joke coin, DOGE has survived while many other projects failed, thanks to Elon Musk’s backing.
In early 2026, DOGE ETFs launched, bringing in millions of dollars in inflows. It’s accepted at AMC Theatres, tested at GameStop, and usable for Tesla merchandise. While its price no longer spikes dramatically after Musk’s comments, DOGE still has a market value above $15 billion.
Ethereum
While Musk owns Ethereum, he has also praised its smart-contract capabilities. He talks less about ETH than Dogecoin, but his confirmed holdings keep it relevant. Ethereum’s widespread use in DeFi, NFTs, and stablecoins gives it a strong market presence that even Musk cannot drastically move.
How Elon Musk Influences the Crypto Market
Musk’s influence on digital assets operates through several distinct channels:
Social media posts.
One post on X, a meme, a short reply, or an endorsement, can move prices, especially for Dogecoin and other meme coins. Studies tracking engagement between 2024 and 2026 show that Musk’s posts remain among the most reacted-to financial messages online.
However, the magnitude of these moves has diminished as the market has grown and diversified. Price swings after his comments now tend to be smaller and shorter-lived than in 2020–2021.
Corporate treasury decisions
Tesla’s $1.5 billion Bitcoin purchase in 2021 showed that major companies could hold crypto as a treasury asset. That decision triggered a market rally worth tens of billions in capitalization. Subsequent moves, such as partial BTC sales and DOGE integration for merchandise, continue to set precedents that other companies closely watch.
Payment integration signals
Musk has promoted Dogecoin payments on X and in real-world projects like the Las Vegas Loop. X Money, a payment system under development, fuels speculation about broader crypto use.
Political and regulatory signals
Musk’s advisory role in the U.S. government’s DOGE Department (2024–2025) and public comments on blockchain and regulation shape how lawmakers and regulators approach crypto.
The SpaceX–xAI merger.
In February 2026, SpaceX acquired Musk’s AI company xAI in a $1.25 trillion all-stock deal. This sparked speculation about potential crypto use in space-based AI and satellite networks.
Overall, the “Musk effect” is mostly a sentiment amplifier: in strong markets, it can accelerate rallies; in weak markets, attention-driven assets may fall faster.
Top Elon Musk Meme Coins to Watch in 2026
Dogecoin (DOGE)
The only meme coin with a real, documented connection to Musk. DOGE is still the main celebrity-driven crypto and has more support than most meme coins thanks to its spot ETF pipeline and growing merchant adoption.
One caution: unlike Bitcoin, DOGE has no supply cap; around 5 billion new DOGE are created each year, which matters for long-term holders.
Floki (FLOKI)
Named after Musk’s Shiba Inu puppy, Floki launched in 2021 and quickly became a well-known meme coin. Unlike purely speculative tokens, Floki has a real ecosystem: a play-to-earn game (Valhalla), DeFi products (FlokiFi), and an educational platform (Floki University).
It runs on Ethereum and BNB Chain and has marketing partnerships with sports teams worldwide. Floki combines meme culture with real development, making it unique in the space.
Shiba Inu (SHIB) Launched as a “Dogecoin killer,” SHIB is the largest Ethereum-based meme coin by market cap. It now has its own ecosystem, including a decentralized exchange (ShibaSwap), a Layer-2 blockchain (Shibarium), and governance tokens (LEASH and BONE).
Musk has confirmed he does not hold SHIB, but its size and liquidity make it a major player in the meme-coin world. Notably, half of SHIB’s supply was originally sent to Ethereum co-founder Vitalik Buterin, who donated part of it to COVID-19 relief in India.
Pepe (PEPE) Inspired by the Pepe the Frog meme, PEPE launched in April 2023 and hit a $1 billion market cap in just three weeks. It has stayed popular longer than many competitors.
While Musk isn’t directly connected, his activity often fuels the meme-coin market, which benefits PEPE. Its strong liquidity and listing on major exchanges make it easy to trade.
Bonk (BONK) A Solana-based meme coin, BONK was airdropped to community members during a challenging period for the Solana network. It has grown into one of Solana’s main community tokens, with fast transactions and increasing exchange support. Musk isn’t directly involved, but his influence on risk-on sentiment benefits it.
The Legal Landscape: The Dogecoin Lawsuit In June 2022, a Dogecoin investor sued Elon Musk, Tesla, and SpaceX, alleging they ran a pyramid scheme by promoting Dogecoin and seeking $258 billion in damages. Musk’s lawyers argued that his posts and memes were protected speech, not market manipulation.
The case was dismissed by a federal judge in August 2024. The plaintiffs dropped their appeal in November 2024, ending the lawsuit.
Analysts view this as a key test of how the law treats celebrity influence in crypto markets.
How to Verify Any “Official” Musk Crypto Claim Given the volume of scams exploiting Musk’s name, a basic verification checklist is essential before engaging with any token claiming his association:
Check the primary source. Musk’s confirmed statements come from his verified X account (@elonmusk) and SEC filings related to Tesla’s treasury. Any claim of a new holding, endorsement, or official partnership not originating from these sources should be treated as unverified.
Look for SEC disclosures.
Corporate crypto holdings are reported in quarterly and annual filings. If a claim about Tesla or SpaceX holding a new token cannot be verified in SEC or equivalent regulatory filings, it is almost certainly false.
Search Musk’s X history.
His feed is public and searchable. Genuine endorsements will have traceable posts. Be cautious of screenshots without verifiable links; they can easily be fabricated.
Ignore influencer amplification.
Musk does not run personal tokens. Any coin claiming to be the “official Elon Musk token” is a third-party creation.
Beware of hype.
Numerous accounts on X, YouTube, and Telegram claim exclusive knowledge of Musk’s “next crypto pick”. None of them has verified information. This content is designed to manufacture urgency and drive purchases that benefit early holders at the expense of later buyers.
How to Evaluate Elon Musk Crypto Before Investing
Whether it’s a confirmed holding like Bitcoin, Ethereum, or Dogecoin, or a meme coin linked to Musk, following a clear evaluation process helps reduce risk:
Assess fundamentals independently of Musk Ask: Would this coin have value without Musk’s attention? Bitcoin and Ethereum clearly would. Dogecoin has some real-world use and recognition. Many meme coins fail this test.
Check liquidity and market cap
Low liquidity can cause wild price swings. A high market cap with low trading volume may be misleading. Favor coins that trade on major exchanges with real activity.
Understand tokenomics
Look at supply rules, inflation, and founder vesting schedules. For example, DOGE has no supply cap, with 5 billion new coins minted yearly. This does not automatically disqualify it, but should guide expectations.
Size your position wisely
Musk-linked meme coins can rise or fall dramatically. Treat them as small, speculative parts of your portfolio, not core holdings.
Watch for market manipulation
Rapid price jumps without news are often engineered by early holders or coordinated groups. These “pump-and-dump” moves can trap inexperienced investors.
The Bottom Line In 2026, Elon Musk’s confirmed crypto holdings are straightforward: Bitcoin, Ethereum, and Dogecoin, along with significant Bitcoin exposure through Tesla and SpaceX. Beyond these, many coins claim a connection to him without proof.
The “Musk effect” is real, but changing. Price moves from his comments are smaller and shorter than in earlier years. The market now rewards real utility, strong communities, and solid fundamentals alongside hype. Musk remains a major influence, but the crypto ecosystem is more complex and competitive than ever.
For investors, the rule is simple: verify the connection, focus on fundamentals, and do not rely on celebrity endorsements instead of research.
#CryptoNewsFlash
This guide explains what crypto Elon Musk personally owns, what his companies hold, which coins are truly connected to him, and how to avoid scams using his name.
What Are Elon Musk Cryptos?
The phrase “Elon Musk cryptos” refers to two things.
First, the coins Musk has confirmed he owns: Bitcoin (BTC), Ethereum (ETH), and Dogecoin (DOGE). These are major, well-established cryptocurrencies with billions traded daily.
His companies, Tesla and SpaceX, also hold large amounts of Bitcoin, making them among the largest corporate holders in the world.
The second category includes hundreds of coins that use Musk’s name or image, like “ElonCoin,” “MuskToken,” and “X Coin.” These have no real connection to him, are created by third parties, and are almost always very risky. Musk has clearly stated he is not involved with any of them.
Elon Musk’s Confirmed Crypto Holdings in 2026
In July 2021, Musk confirmed that he personally owns Bitcoin, Ethereum, and Dogecoin. At The B Word conference and on social media, he joked that these are just “ASCII hash strings,” highlighting that cryptocurrencies are really just digital data. As of 2026, he has not announced owning any other coins.
Bitcoin (BTC)
Musk received 0.25 BTC from a friend in 2018, the earliest known record of his Bitcoin holdings. He has not disclosed how much he currently owns. While he does hold Bitcoin, Musk has criticized it for using too much energy.
Tesla even paused BTC payments in 2021 because of this and its slow speed, which he said stems from how it was originally designed in 2008.
Ethereum (ETH)
Confirmed at The B Word conference in 2021, Musk described Ethereum as a practical smart contract network rather than a meme asset. However, he has not revealed specific quantities and has made fewer public comments about ETH than about the other two coins.
Dogecoin (DOGE)
This is where Musk’s enthusiasm is most visible and documented. He has championed Dogecoin since at least 2019, citing its lower transaction fees, faster block times, and the community-driven, humorous spirit of the project.
He has referred to it as a “people’s crypto” on multiple occasions. Despite acknowledging its origins as a joke, Musk argues that its blockchain infrastructure makes it more practical for everyday payments than Bitcoin.
What Musk Does Not Hold
In October 2021, when asked directly by a social media user how much Shiba Inu (SHIB) he owned, Musk replied, “None.”
He has issued similar denials for other tokens bearing his name or image. To date, Musk has publicly stated that his only personal cryptocurrency holdings are Bitcoin, Ethereum, and Dogecoin.
Corporate Holdings: Tesla and SpaceX
Musk’s influence on crypto is not limited to his personal wallet. Two of his companies hold substantial Bitcoin positions, and their actions have at times moved global markets.
Tesla
In February 2021, Tesla bought $1.5 billion worth of Bitcoin, helping drive a major market rally. The company later sold some to raise cash. As of today, Tesla holds 11,509 BTC, bought for about $386 million, making it one of the largest corporate Bitcoin holders.
Tesla also holds Dogecoin and has accepted DOGE for online merchandise since January 2022. Notably, Tesla has not fully separated its BTC and DOGE values in its most recent digital-asset disclosures.
SpaceX
SpaceX has maintained Bitcoin holdings since 2021, though the company has historically been less transparent than Tesla about its exact position. In July 2025, blockchain analytics identified a SpaceX-controlled wallet transferring approximately $153.7 million in BTC. Even after that transfer, SpaceX reportedly retained over $850 million in Bitcoin reserves.
Top Elon Musk Cryptos by Market Relevance in 2026
Bitcoin
Bitcoin remains the largest and most important crypto in Musk’s confirmed holdings and Tesla’s treasury. In 2025, Musk’s new political group, the America Party, took a pro-Bitcoin stance, adding a political angle to his crypto involvement. Experts speculate he may buy more BTC in 2026, but nothing is certain.
Dogecoin
Dogecoin is the crypto most closely tied to Musk. Once a joke coin, DOGE has survived while many other projects failed, thanks to Elon Musk’s backing.
In early 2026, DOGE ETFs launched, bringing in millions of dollars in inflows. It’s accepted at AMC Theatres, tested at GameStop, and usable for Tesla merchandise. While its price no longer spikes dramatically after Musk’s comments, DOGE still has a market value above $15 billion.
Ethereum
While Musk owns Ethereum, he has also praised its smart-contract capabilities. He talks less about ETH than Dogecoin, but his confirmed holdings keep it relevant. Ethereum’s widespread use in DeFi, NFTs, and stablecoins gives it a strong market presence that even Musk cannot drastically move.
How Elon Musk Influences the Crypto Market
Musk’s influence on digital assets operates through several distinct channels:
Social media posts.
One post on X, a meme, a short reply, or an endorsement, can move prices, especially for Dogecoin and other meme coins. Studies tracking engagement between 2024 and 2026 show that Musk’s posts remain among the most reacted-to financial messages online.
However, the magnitude of these moves has diminished as the market has grown and diversified. Price swings after his comments now tend to be smaller and shorter-lived than in 2020–2021.
Corporate treasury decisions
Tesla’s $1.5 billion Bitcoin purchase in 2021 showed that major companies could hold crypto as a treasury asset. That decision triggered a market rally worth tens of billions in capitalization. Subsequent moves, such as partial BTC sales and DOGE integration for merchandise, continue to set precedents that other companies closely watch.
Payment integration signals
Musk has promoted Dogecoin payments on X and in real-world projects like the Las Vegas Loop. X Money, a payment system under development, fuels speculation about broader crypto use.
Political and regulatory signals
Musk’s advisory role in the U.S. government’s DOGE Department (2024–2025) and public comments on blockchain and regulation shape how lawmakers and regulators approach crypto.
The SpaceX–xAI merger.
In February 2026, SpaceX acquired Musk’s AI company xAI in a $1.25 trillion all-stock deal. This sparked speculation about potential crypto use in space-based AI and satellite networks.
Overall, the “Musk effect” is mostly a sentiment amplifier: in strong markets, it can accelerate rallies; in weak markets, attention-driven assets may fall faster.
Top Elon Musk Meme Coins to Watch in 2026
Dogecoin (DOGE)
The only meme coin with a real, documented connection to Musk. DOGE is still the main celebrity-driven crypto and has more support than most meme coins thanks to its spot ETF pipeline and growing merchant adoption.
One caution: unlike Bitcoin, DOGE has no supply cap; around 5 billion new DOGE are created each year, which matters for long-term holders.
Floki (FLOKI)
Named after Musk’s Shiba Inu puppy, Floki launched in 2021 and quickly became a well-known meme coin. Unlike purely speculative tokens, Floki has a real ecosystem: a play-to-earn game (Valhalla), DeFi products (FlokiFi), and an educational platform (Floki University).
It runs on Ethereum and BNB Chain and has marketing partnerships with sports teams worldwide. Floki combines meme culture with real development, making it unique in the space.
Shiba Inu (SHIB) Launched as a “Dogecoin killer,” SHIB is the largest Ethereum-based meme coin by market cap. It now has its own ecosystem, including a decentralized exchange (ShibaSwap), a Layer-2 blockchain (Shibarium), and governance tokens (LEASH and BONE).
Musk has confirmed he does not hold SHIB, but its size and liquidity make it a major player in the meme-coin world. Notably, half of SHIB’s supply was originally sent to Ethereum co-founder Vitalik Buterin, who donated part of it to COVID-19 relief in India.
Pepe (PEPE) Inspired by the Pepe the Frog meme, PEPE launched in April 2023 and hit a $1 billion market cap in just three weeks. It has stayed popular longer than many competitors.
While Musk isn’t directly connected, his activity often fuels the meme-coin market, which benefits PEPE. Its strong liquidity and listing on major exchanges make it easy to trade.
Bonk (BONK) A Solana-based meme coin, BONK was airdropped to community members during a challenging period for the Solana network. It has grown into one of Solana’s main community tokens, with fast transactions and increasing exchange support. Musk isn’t directly involved, but his influence on risk-on sentiment benefits it.
The Legal Landscape: The Dogecoin Lawsuit In June 2022, a Dogecoin investor sued Elon Musk, Tesla, and SpaceX, alleging they ran a pyramid scheme by promoting Dogecoin and seeking $258 billion in damages. Musk’s lawyers argued that his posts and memes were protected speech, not market manipulation.
The case was dismissed by a federal judge in August 2024. The plaintiffs dropped their appeal in November 2024, ending the lawsuit.
Analysts view this as a key test of how the law treats celebrity influence in crypto markets.
How to Verify Any “Official” Musk Crypto Claim Given the volume of scams exploiting Musk’s name, a basic verification checklist is essential before engaging with any token claiming his association:
Check the primary source. Musk’s confirmed statements come from his verified X account (@elonmusk) and SEC filings related to Tesla’s treasury. Any claim of a new holding, endorsement, or official partnership not originating from these sources should be treated as unverified.
Look for SEC disclosures.
Corporate crypto holdings are reported in quarterly and annual filings. If a claim about Tesla or SpaceX holding a new token cannot be verified in SEC or equivalent regulatory filings, it is almost certainly false.
Search Musk’s X history.
His feed is public and searchable. Genuine endorsements will have traceable posts. Be cautious of screenshots without verifiable links; they can easily be fabricated.
Ignore influencer amplification.
Musk does not run personal tokens. Any coin claiming to be the “official Elon Musk token” is a third-party creation.
Beware of hype.
Numerous accounts on X, YouTube, and Telegram claim exclusive knowledge of Musk’s “next crypto pick”. None of them has verified information. This content is designed to manufacture urgency and drive purchases that benefit early holders at the expense of later buyers.
How to Evaluate Elon Musk Crypto Before Investing
Whether it’s a confirmed holding like Bitcoin, Ethereum, or Dogecoin, or a meme coin linked to Musk, following a clear evaluation process helps reduce risk:
Assess fundamentals independently of Musk Ask: Would this coin have value without Musk’s attention? Bitcoin and Ethereum clearly would. Dogecoin has some real-world use and recognition. Many meme coins fail this test.
Check liquidity and market cap
Low liquidity can cause wild price swings. A high market cap with low trading volume may be misleading. Favor coins that trade on major exchanges with real activity.
Understand tokenomics
Look at supply rules, inflation, and founder vesting schedules. For example, DOGE has no supply cap, with 5 billion new coins minted yearly. This does not automatically disqualify it, but should guide expectations.
Size your position wisely
Musk-linked meme coins can rise or fall dramatically. Treat them as small, speculative parts of your portfolio, not core holdings.
Watch for market manipulation
Rapid price jumps without news are often engineered by early holders or coordinated groups. These “pump-and-dump” moves can trap inexperienced investors.
The Bottom Line In 2026, Elon Musk’s confirmed crypto holdings are straightforward: Bitcoin, Ethereum, and Dogecoin, along with significant Bitcoin exposure through Tesla and SpaceX. Beyond these, many coins claim a connection to him without proof.
The “Musk effect” is real, but changing. Price moves from his comments are smaller and shorter than in earlier years. The market now rewards real utility, strong communities, and solid fundamentals alongside hype. Musk remains a major influence, but the crypto ecosystem is more complex and competitive than ever.
For investors, the rule is simple: verify the connection, focus on fundamentals, and do not rely on celebrity endorsements instead of research.
#CryptoNewsFlash
516
ບົດຄວາມ
Bitcoin Is Getting Stronger as Monthly RSI Rebounds From Deep 2026 Lows#Bitcoin is showing signs of strength as its monthly RSI recovers from the low levels seen during its 2026 decline.
Bitcoin analyst PlanB, who has over 2 million followers on X, shared the latest monthly RSI chart from Block Horizon and simply said, “Bitcoin is getting stronger.”
Bitcoin Monthly RSI Moves Back Above 50
The chart, updated on September 24, shows Bitcoin’s monthly RSI at around 54, while its five-month average is about 47.
Earlier in 2026, the RSI fell into the mid-40s, indicating weaker momentum. This decline coincided with Bitcoin’s price drop from $97,860.60 to $57,700 in July, representing a 40.99% decline.
However, Bitcoin has improved significantly since that low. Bitcoin has surged to $87,265 as of this week, representing a 51% gain from the July low.
Accordingly, Bitcoin’s monthly RSI has now recovered above 50, suggesting that BTC’s momentum is improving. However, the RSI remains well below 70, a level often seen during Bitcoin’s strongest rallies.
The chart also shows that Bitcoin’s RSI has experienced major ups and downs in the past. Major market peaks have often occurred with RSI readings above 85, while major corrections have pushed the indicator below 50.
Therefore, PlanB’s comment suggests that Bitcoin’s momentum is improving following the previous decline.
Gradually Entering a Bull Market
Interestingly, when Bitcoin reached a peak of $126,200 in 2025, its RSI did not reach the typical 80-plus levels seen during previous bull markets. Instead, it reached the mid-70s before the decline began.
On the other hand, the RSI reached the usual bear-market bottom levels below 50, similar to what occurred during previous bear markets.
CoinMarketCap data shows BTC at around $84,580, up about 1.5% over the past 24 hours and 8% over the past week. The recovery has led to more positive comments from traders on social media, with some suggesting that the bull market has resumed.
X user Riley Coleman said that despite criticism from some bears, Bitcoin’s market structure is getting stronger. “The bears can keep coping all they want on social media, but the math doesn’t care about your feelings,” he said.
Notably, the RSI suggests Bitcoin is gradually entering another major rally. At around 54, the monthly RSI remains in the middle of its historical range and well below the extreme levels seen during previous market peaks.
The key point is that Bitcoin’s monthly RSI has recovered as its price has risen significantly from the July low. If the RSI continues to rise, it would suggest stronger long-term momentum. If it falls below 50 again, it could indicate renewed weakness.
Bitcoin Supertrend Flashes Buy Signal at $84K
Beyond the monthly RSI, Bitcoin’s Supertrend indicator has turned green again around $84,000, signaling a shift back to an uptrend.
The previous green signal appeared in 2023 near $16,000 and remained in place for roughly three years as Bitcoin climbed about 700%, eventually reaching $120,000. The indicator has now turned green again after Bitcoin fell to around $57,700 in July 2026 and subsequently rebounded by about 51%.
The Supertrend indicator uses price and volatility to identify market direction, with green indicating an upward trend.
Bitcoin has also moved back above its 365-day moving average near $83,000 and its 50-week moving average. The next major technical level is around $88,761, the two-year moving average. A sustained move above these levels could signal stronger momentum, although technical indicators do not guarantee future gains.
#CryptoNewsFlash
Bitcoin Is Getting Stronger as Monthly RSI Rebounds From Deep 2026 Lows
#Bitcoin is showing signs of strength as its monthly RSI recovers from the low levels seen during its 2026 decline.
Bitcoin analyst PlanB, who has over 2 million followers on X, shared the latest monthly RSI chart from Block Horizon and simply said, “Bitcoin is getting stronger.”
Bitcoin Monthly RSI Moves Back Above 50
The chart, updated on September 24, shows Bitcoin’s monthly RSI at around 54, while its five-month average is about 47.
Earlier in 2026, the RSI fell into the mid-40s, indicating weaker momentum. This decline coincided with Bitcoin’s price drop from $97,860.60 to $57,700 in July, representing a 40.99% decline.
However, Bitcoin has improved significantly since that low. Bitcoin has surged to $87,265 as of this week, representing a 51% gain from the July low.
Accordingly, Bitcoin’s monthly RSI has now recovered above 50, suggesting that BTC’s momentum is improving. However, the RSI remains well below 70, a level often seen during Bitcoin’s strongest rallies.
The chart also shows that Bitcoin’s RSI has experienced major ups and downs in the past. Major market peaks have often occurred with RSI readings above 85, while major corrections have pushed the indicator below 50.
Therefore, PlanB’s comment suggests that Bitcoin’s momentum is improving following the previous decline.
Gradually Entering a Bull Market
Interestingly, when Bitcoin reached a peak of $126,200 in 2025, its RSI did not reach the typical 80-plus levels seen during previous bull markets. Instead, it reached the mid-70s before the decline began.
On the other hand, the RSI reached the usual bear-market bottom levels below 50, similar to what occurred during previous bear markets.
CoinMarketCap data shows BTC at around $84,580, up about 1.5% over the past 24 hours and 8% over the past week. The recovery has led to more positive comments from traders on social media, with some suggesting that the bull market has resumed.
X user Riley Coleman said that despite criticism from some bears, Bitcoin’s market structure is getting stronger. “The bears can keep coping all they want on social media, but the math doesn’t care about your feelings,” he said.
Notably, the RSI suggests Bitcoin is gradually entering another major rally. At around 54, the monthly RSI remains in the middle of its historical range and well below the extreme levels seen during previous market peaks.
The key point is that Bitcoin’s monthly RSI has recovered as its price has risen significantly from the July low. If the RSI continues to rise, it would suggest stronger long-term momentum. If it falls below 50 again, it could indicate renewed weakness.
Bitcoin Supertrend Flashes Buy Signal at $84K
Beyond the monthly RSI, Bitcoin’s Supertrend indicator has turned green again around $84,000, signaling a shift back to an uptrend.
The previous green signal appeared in 2023 near $16,000 and remained in place for roughly three years as Bitcoin climbed about 700%, eventually reaching $120,000. The indicator has now turned green again after Bitcoin fell to around $57,700 in July 2026 and subsequently rebounded by about 51%.
The Supertrend indicator uses price and volatility to identify market direction, with green indicating an upward trend.
Bitcoin has also moved back above its 365-day moving average near $83,000 and its 50-week moving average. The next major technical level is around $88,761, the two-year moving average. A sustained move above these levels could signal stronger momentum, although technical indicators do not guarantee future gains.
#CryptoNewsFlash
Bitcoin analyst PlanB, who has over 2 million followers on X, shared the latest monthly RSI chart from Block Horizon and simply said, “Bitcoin is getting stronger.”
Bitcoin Monthly RSI Moves Back Above 50
The chart, updated on September 24, shows Bitcoin’s monthly RSI at around 54, while its five-month average is about 47.
Earlier in 2026, the RSI fell into the mid-40s, indicating weaker momentum. This decline coincided with Bitcoin’s price drop from $97,860.60 to $57,700 in July, representing a 40.99% decline.
However, Bitcoin has improved significantly since that low. Bitcoin has surged to $87,265 as of this week, representing a 51% gain from the July low.
Accordingly, Bitcoin’s monthly RSI has now recovered above 50, suggesting that BTC’s momentum is improving. However, the RSI remains well below 70, a level often seen during Bitcoin’s strongest rallies.
The chart also shows that Bitcoin’s RSI has experienced major ups and downs in the past. Major market peaks have often occurred with RSI readings above 85, while major corrections have pushed the indicator below 50.
Therefore, PlanB’s comment suggests that Bitcoin’s momentum is improving following the previous decline.
Gradually Entering a Bull Market
Interestingly, when Bitcoin reached a peak of $126,200 in 2025, its RSI did not reach the typical 80-plus levels seen during previous bull markets. Instead, it reached the mid-70s before the decline began.
On the other hand, the RSI reached the usual bear-market bottom levels below 50, similar to what occurred during previous bear markets.
CoinMarketCap data shows BTC at around $84,580, up about 1.5% over the past 24 hours and 8% over the past week. The recovery has led to more positive comments from traders on social media, with some suggesting that the bull market has resumed.
X user Riley Coleman said that despite criticism from some bears, Bitcoin’s market structure is getting stronger. “The bears can keep coping all they want on social media, but the math doesn’t care about your feelings,” he said.
Notably, the RSI suggests Bitcoin is gradually entering another major rally. At around 54, the monthly RSI remains in the middle of its historical range and well below the extreme levels seen during previous market peaks.
The key point is that Bitcoin’s monthly RSI has recovered as its price has risen significantly from the July low. If the RSI continues to rise, it would suggest stronger long-term momentum. If it falls below 50 again, it could indicate renewed weakness.
Bitcoin Supertrend Flashes Buy Signal at $84K
Beyond the monthly RSI, Bitcoin’s Supertrend indicator has turned green again around $84,000, signaling a shift back to an uptrend.
The previous green signal appeared in 2023 near $16,000 and remained in place for roughly three years as Bitcoin climbed about 700%, eventually reaching $120,000. The indicator has now turned green again after Bitcoin fell to around $57,700 in July 2026 and subsequently rebounded by about 51%.
The Supertrend indicator uses price and volatility to identify market direction, with green indicating an upward trend.
Bitcoin has also moved back above its 365-day moving average near $83,000 and its 50-week moving average. The next major technical level is around $88,761, the two-year moving average. A sustained move above these levels could signal stronger momentum, although technical indicators do not guarantee future gains.
#CryptoNewsFlash
317

📰 Berita Crypto Hari Ini :
🔥 Stablecoin Kepatuhan Tether, USA₮, Diluncurkan di Mainnet Celo
Stablecoin Tether yang berfokus pada kepatuhan, USA₮, resmi diluncurkan di mainnet Celo, menandai penyebaran mainnet keduanya setelah Ethereum. Token tersebut, yang diterbitkan oleh Anchorage Digital Bank, dapat dicetak dan ditukarkan secara natif di Celo.
⚡ bStocks Binance Lampaui $500 Juta dalam Tujuh Minggu, Mendominasi Perdagangan Saham Tokenisasi
Produk saham tokenisasi Binance, bStocks, melampaui $500 juta dalam Aset yang Dikelola (AUM) pada tanggal 28 Juli, hanya tujuh minggu setelah diluncurkan. Pertumbuhan ini menunjukkan dominasi bStocks dalam volume perdagangan DEX saham tokenisasi (85%) dan kapitalisasi pasar (27%), menunjukkan bahwa generasi baru berinvestasi di pasar tradisional melalui crypto.
📉 Korea Selatan Merencanakan Undang-Undang Dasar Aset Digital Konsolidasi, Mengatasi Stablecoin dan Pajak Crypto
Komisi Jasa Keuangan (FSC) Korea Selatan dilaporkan berkolaborasi dengan partai yang berkuasa untuk menyusun Undang-Undang Dasar Aset Digital yang komprehensif. Inisiatif ini bertujuan untuk menetapkan regulasi yang didukung pemerintah untuk stablecoin dan pasar cryptocurrency yang lebih luas, di samping kerangka kerja pajak yang baru.
📈 Kinerja Aset Utama (24 jam)
BTC: +0.1% — Bitcoin sempat turun di bawah $64.000 tetapi menunjukkan sedikit pemulihan, mengindikasikan sentimen hati-hati menjelang keputusan The Fed.
ETH: -1.3% — Ethereum mengalami penurunan moderat, diperdagangkan di bawah $1.900 USDT, sejalan dengan konsolidasi pasar yang lebih luas.
SOL: -1.5% — Solana mengalami sedikit penurunan, mencerminkan suasana pasar yang ragu-ragu secara umum.
#CryptoNewsFlash #binancesquare
📰 Berita Crypto Hari Ini :
🔥 Stablecoin Kepatuhan Tether, USA₮, Diluncurkan di Mainnet Celo
Stablecoin Tether yang berfokus pada kepatuhan, USA₮, resmi diluncurkan di mainnet Celo, menandai penyebaran mainnet keduanya setelah Ethereum. Token tersebut, yang diterbitkan oleh Anchorage Digital Bank, dapat dicetak dan ditukarkan secara natif di Celo.
⚡ bStocks Binance Lampaui $500 Juta dalam Tujuh Minggu, Mendominasi Perdagangan Saham Tokenisasi
Produk saham tokenisasi Binance, bStocks, melampaui $500 juta dalam Aset yang Dikelola (AUM) pada tanggal 28 Juli, hanya tujuh minggu setelah diluncurkan. Pertumbuhan ini menunjukkan dominasi bStocks dalam volume perdagangan DEX saham tokenisasi (85%) dan kapitalisasi pasar (27%), menunjukkan bahwa generasi baru berinvestasi di pasar tradisional melalui crypto.
📉 Korea Selatan Merencanakan Undang-Undang Dasar Aset Digital Konsolidasi, Mengatasi Stablecoin dan Pajak Crypto
Komisi Jasa Keuangan (FSC) Korea Selatan dilaporkan berkolaborasi dengan partai yang berkuasa untuk menyusun Undang-Undang Dasar Aset Digital yang komprehensif. Inisiatif ini bertujuan untuk menetapkan regulasi yang didukung pemerintah untuk stablecoin dan pasar cryptocurrency yang lebih luas, di samping kerangka kerja pajak yang baru.
📈 Kinerja Aset Utama (24 jam)
BTC: +0.1% — Bitcoin sempat turun di bawah $64.000 tetapi menunjukkan sedikit pemulihan, mengindikasikan sentimen hati-hati menjelang keputusan The Fed.
ETH: -1.3% — Ethereum mengalami penurunan moderat, diperdagangkan di bawah $1.900 USDT, sejalan dengan konsolidasi pasar yang lebih luas.
SOL: -1.5% — Solana mengalami sedikit penurunan, mencerminkan suasana pasar yang ragu-ragu secara umum.
#CryptoNewsFlash #binancesquare
🔥 Stablecoin Kepatuhan Tether, USA₮, Diluncurkan di Mainnet Celo
Stablecoin Tether yang berfokus pada kepatuhan, USA₮, resmi diluncurkan di mainnet Celo, menandai penyebaran mainnet keduanya setelah Ethereum. Token tersebut, yang diterbitkan oleh Anchorage Digital Bank, dapat dicetak dan ditukarkan secara natif di Celo.
⚡ bStocks Binance Lampaui $500 Juta dalam Tujuh Minggu, Mendominasi Perdagangan Saham Tokenisasi
Produk saham tokenisasi Binance, bStocks, melampaui $500 juta dalam Aset yang Dikelola (AUM) pada tanggal 28 Juli, hanya tujuh minggu setelah diluncurkan. Pertumbuhan ini menunjukkan dominasi bStocks dalam volume perdagangan DEX saham tokenisasi (85%) dan kapitalisasi pasar (27%), menunjukkan bahwa generasi baru berinvestasi di pasar tradisional melalui crypto.
📉 Korea Selatan Merencanakan Undang-Undang Dasar Aset Digital Konsolidasi, Mengatasi Stablecoin dan Pajak Crypto
Komisi Jasa Keuangan (FSC) Korea Selatan dilaporkan berkolaborasi dengan partai yang berkuasa untuk menyusun Undang-Undang Dasar Aset Digital yang komprehensif. Inisiatif ini bertujuan untuk menetapkan regulasi yang didukung pemerintah untuk stablecoin dan pasar cryptocurrency yang lebih luas, di samping kerangka kerja pajak yang baru.
📈 Kinerja Aset Utama (24 jam)
BTC: +0.1% — Bitcoin sempat turun di bawah $64.000 tetapi menunjukkan sedikit pemulihan, mengindikasikan sentimen hati-hati menjelang keputusan The Fed.
ETH: -1.3% — Ethereum mengalami penurunan moderat, diperdagangkan di bawah $1.900 USDT, sejalan dengan konsolidasi pasar yang lebih luas.
SOL: -1.5% — Solana mengalami sedikit penurunan, mencerminkan suasana pasar yang ragu-ragu secara umum.
#CryptoNewsFlash #binancesquare
91
Top NFT Platform OpenSea Teases Perpetual Trading Launch With #Hyperliquid .
Zack Brenner, the product marketing lead at OpenSea, recently drew attention on X after asking users whether they would be interested in early access to perpetual contracts on the platform.
In a follow-up exchange, he also responded “YES” when asked if the upcoming service would be powered by Hyperliquid, confirming the integration.
Meanwhile, OpenSea continues to hold a strong position in the NFT market, ranking third by monthly trading volume with a 19.9% share, according to the latest CoinGecko marketplace data.
#CryptoNewsFlash
Top NFT Platform OpenSea Teases Perpetual Trading Launch With #Hyperliquid .
Zack Brenner, the product marketing lead at OpenSea, recently drew attention on X after asking users whether they would be interested in early access to perpetual contracts on the platform.
In a follow-up exchange, he also responded “YES” when asked if the upcoming service would be powered by Hyperliquid, confirming the integration.
Meanwhile, OpenSea continues to hold a strong position in the NFT market, ranking third by monthly trading volume with a 19.9% share, according to the latest CoinGecko marketplace data.
#CryptoNewsFlash
Zack Brenner, the product marketing lead at OpenSea, recently drew attention on X after asking users whether they would be interested in early access to perpetual contracts on the platform.
In a follow-up exchange, he also responded “YES” when asked if the upcoming service would be powered by Hyperliquid, confirming the integration.
Meanwhile, OpenSea continues to hold a strong position in the NFT market, ranking third by monthly trading volume with a 19.9% share, according to the latest CoinGecko marketplace data.
#CryptoNewsFlash
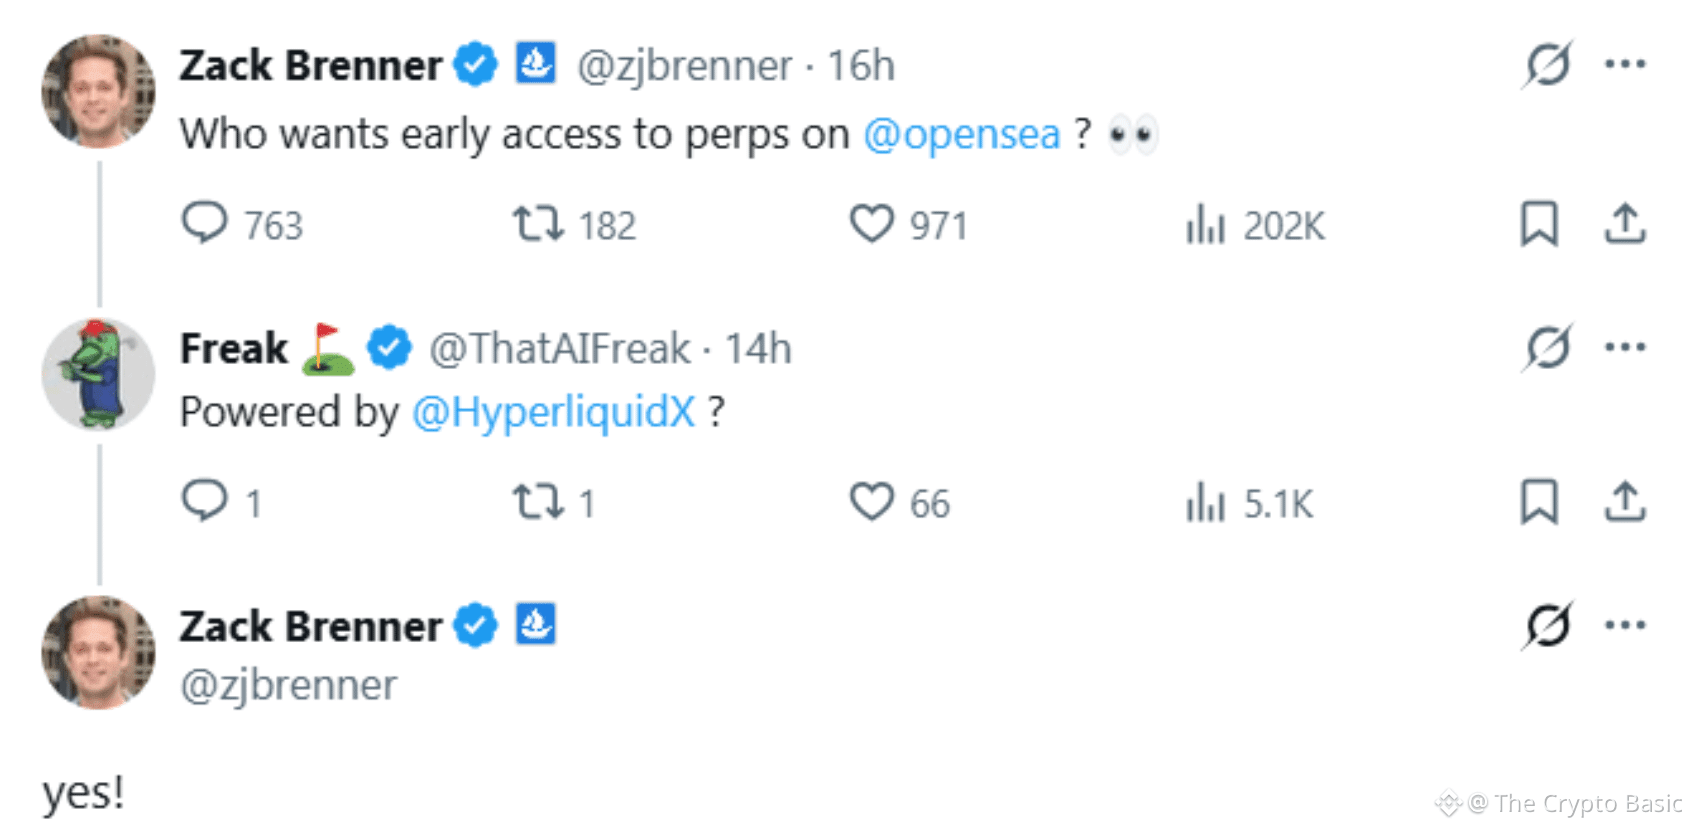
1
380
ບົດຄວາມ
"Dan Gambardello Warns Traders Against Writing Off Cardano as ADA Eyes $0.40"Market veteran Dan Gambardello has urged traders not to write off Cardano as ADA approaches a potentially important technical breakout.
Cardano started the week on a positive note as the broader cryptocurrency market staged a recovery. ADA climbed from an intraday low of $0.23 to around $0.25, strengthening its recent rebound despite the token’s significant decline over the past several months.
While some critics have questioned whether Cardano can regain its previous momentum, Gambardello has taken a different view. He warned traders against dismissing the cryptocurrency, pointing to a technical setup that could support a sharp upward move.
Gambardello Sees Potential Move to $0.40
Gambardello specifically cautioned traders against “writing off” Cardano as ADA approaches a possible breakout.
According to him, ADA could reach $0.40 “in an instant” if it escapes its current technical structure. His comment highlights the importance of the resistance levels ADA is currently testing and the possibility of a stronger rally if the token breaks above them.
The accompanying chart shows ADA trading around $0.241 while testing an ascending yellow trendline that has recently acted as resistance. Recent candles have moved above the trendline, suggesting that buyers are attempting to push the token into a stronger position above this level.
ADA Builds Recovery Structure
Meanwhile, ADA has recovered significantly from its recent low near $0.14 and has formed a series of higher lows. The blue moving average has also turned upward and remains below the current price, indicating that short-term momentum has improved.
Nonetheless, ADA still faces resistance from the longer-term red moving average, which continues to trend downward from higher levels. Therefore, a sustained break above these resistance areas could play an important role in determining whether ADA can extend its recovery.
At its current price of $0.24603, ADA requires a surge of 62.58% to reach the $0.40 target highlighted by Gambardello. Notably, ADA last traded around the $0.40 level in January 2026 before losing ground.
Gambardello Still Holds ADA
Gambardello’s latest comments also stand out because he previously reduced his Cardano exposure during the governance crisis that affected the ecosystem in June 2026.
At the time, he disclosed that he had moved part of his ADA holdings into Sui. Although he has since liquidated some of his Cardano position, Gambardello confirmed that he remains an ADA holder. However, the exact size of his current ADA holdings remains unknown.
Meanwhile, Cardano continues to retain much of the gain from yesterday’s broader market rally. ADA is currently up 5.63% over the past 24 hours, with its market cap rising by a similar percentage to $9.02 billion.
With this valuation, ADA ranks as the 14th-largest cryptocurrency by market capitalization on CoinMarketCap. Whether it can sustain the current recovery will depend in part on its ability to overcome the resistance levels highlighted in Gambardello’s analysis.
#CryptoNewsFlash
"Dan Gambardello Warns Traders Against Writing Off Cardano as ADA Eyes $0.40"
Market veteran Dan Gambardello has urged traders not to write off Cardano as ADA approaches a potentially important technical breakout.
Cardano started the week on a positive note as the broader cryptocurrency market staged a recovery. ADA climbed from an intraday low of $0.23 to around $0.25, strengthening its recent rebound despite the token’s significant decline over the past several months.
While some critics have questioned whether Cardano can regain its previous momentum, Gambardello has taken a different view. He warned traders against dismissing the cryptocurrency, pointing to a technical setup that could support a sharp upward move.
Gambardello Sees Potential Move to $0.40
Gambardello specifically cautioned traders against “writing off” Cardano as ADA approaches a possible breakout.
According to him, ADA could reach $0.40 “in an instant” if it escapes its current technical structure. His comment highlights the importance of the resistance levels ADA is currently testing and the possibility of a stronger rally if the token breaks above them.
The accompanying chart shows ADA trading around $0.241 while testing an ascending yellow trendline that has recently acted as resistance. Recent candles have moved above the trendline, suggesting that buyers are attempting to push the token into a stronger position above this level.
ADA Builds Recovery Structure
Meanwhile, ADA has recovered significantly from its recent low near $0.14 and has formed a series of higher lows. The blue moving average has also turned upward and remains below the current price, indicating that short-term momentum has improved.
Nonetheless, ADA still faces resistance from the longer-term red moving average, which continues to trend downward from higher levels. Therefore, a sustained break above these resistance areas could play an important role in determining whether ADA can extend its recovery.
At its current price of $0.24603, ADA requires a surge of 62.58% to reach the $0.40 target highlighted by Gambardello. Notably, ADA last traded around the $0.40 level in January 2026 before losing ground.
Gambardello Still Holds ADA
Gambardello’s latest comments also stand out because he previously reduced his Cardano exposure during the governance crisis that affected the ecosystem in June 2026.
At the time, he disclosed that he had moved part of his ADA holdings into Sui. Although he has since liquidated some of his Cardano position, Gambardello confirmed that he remains an ADA holder. However, the exact size of his current ADA holdings remains unknown.
Meanwhile, Cardano continues to retain much of the gain from yesterday’s broader market rally. ADA is currently up 5.63% over the past 24 hours, with its market cap rising by a similar percentage to $9.02 billion.
With this valuation, ADA ranks as the 14th-largest cryptocurrency by market capitalization on CoinMarketCap. Whether it can sustain the current recovery will depend in part on its ability to overcome the resistance levels highlighted in Gambardello’s analysis.
#CryptoNewsFlash
Cardano started the week on a positive note as the broader cryptocurrency market staged a recovery. ADA climbed from an intraday low of $0.23 to around $0.25, strengthening its recent rebound despite the token’s significant decline over the past several months.
While some critics have questioned whether Cardano can regain its previous momentum, Gambardello has taken a different view. He warned traders against dismissing the cryptocurrency, pointing to a technical setup that could support a sharp upward move.
Gambardello Sees Potential Move to $0.40
Gambardello specifically cautioned traders against “writing off” Cardano as ADA approaches a possible breakout.
According to him, ADA could reach $0.40 “in an instant” if it escapes its current technical structure. His comment highlights the importance of the resistance levels ADA is currently testing and the possibility of a stronger rally if the token breaks above them.
The accompanying chart shows ADA trading around $0.241 while testing an ascending yellow trendline that has recently acted as resistance. Recent candles have moved above the trendline, suggesting that buyers are attempting to push the token into a stronger position above this level.
ADA Builds Recovery Structure
Meanwhile, ADA has recovered significantly from its recent low near $0.14 and has formed a series of higher lows. The blue moving average has also turned upward and remains below the current price, indicating that short-term momentum has improved.
Nonetheless, ADA still faces resistance from the longer-term red moving average, which continues to trend downward from higher levels. Therefore, a sustained break above these resistance areas could play an important role in determining whether ADA can extend its recovery.
At its current price of $0.24603, ADA requires a surge of 62.58% to reach the $0.40 target highlighted by Gambardello. Notably, ADA last traded around the $0.40 level in January 2026 before losing ground.
Gambardello Still Holds ADA
Gambardello’s latest comments also stand out because he previously reduced his Cardano exposure during the governance crisis that affected the ecosystem in June 2026.
At the time, he disclosed that he had moved part of his ADA holdings into Sui. Although he has since liquidated some of his Cardano position, Gambardello confirmed that he remains an ADA holder. However, the exact size of his current ADA holdings remains unknown.
Meanwhile, Cardano continues to retain much of the gain from yesterday’s broader market rally. ADA is currently up 5.63% over the past 24 hours, with its market cap rising by a similar percentage to $9.02 billion.
With this valuation, ADA ranks as the 14th-largest cryptocurrency by market capitalization on CoinMarketCap. Whether it can sustain the current recovery will depend in part on its ability to overcome the resistance levels highlighted in Gambardello’s analysis.
#CryptoNewsFlash
1
469
ເຂົ້າສູ່ລະບົບເພື່ອສຳຫຼວດເນື້ອຫາເພີ່ມເຕີມ
ເຂົ້າຮ່ວມກຸ່ມຜູ້ໃຊ້ຄຣິບໂຕທົ່ວໂລກໃນ Binance Square.
⚡️ ໄດ້ຮັບຂໍ້ມູນຫຼ້າສຸດ ແລະ ທີ່ມີປະໂຫຍດກ່ຽວກັບຄຣິບໂຕ.
💬 ໄດ້ຮັບຄວາມໄວ້ວາງໃຈຈາກຕະຫຼາດແລກປ່ຽນຄຣິບໂຕທີ່ໃຫຍ່ທີ່ສຸດໃນໂລກ.
👍 ຄົ້ນຫາຂໍ້ມູນເຊີງເລິກທີ່ແທ້ຈາກນັກສ້າງທີ່ໄດ້ຮັບການຢືນຢັນ.
ອີເມວ / ເບີໂທລະສັບ
ຫົວຂໍ້ທີ່ກໍາລັງນິຍົມ
1
#BinanceProcesses$4.65BWithdrawals
30,076 ຄັ້ງທີ່ເບິ່ງ
131 ກຳລັງສົນທະນາ
2
#WithdrawalsBack: 15 networks live
8,367 ຄັ້ງທີ່ເບິ່ງ
131 ກຳລັງສົນທະນາ
3
#BinanceUpdatesProofofReservesAddresses
138,513 ຄັ້ງທີ່ເບິ່ງ
1,614 ກຳລັງສົນທະນາ
4
#BinanceToResumePhaseOneOfWithdrawals
172,834 ຄັ້ງທີ່ເບິ່ງ
1,658 ກຳລັງສົນທະນາ
5
#BinanceHadAlreadyCovered$6BofHackLoss
11,655 ຄັ້ງທີ່ເບິ່ງ
143 ກຳລັງສົນທະນາ
6
#FBIConfirmsNorthKoreaIsResponsibleForBinanceCryptoHack
54,637 ຄັ້ງທີ່ເບິ່ງ
157 ກຳລັງສົນທະນາ
7
#CZDismissesClaimsBinanceHackWasPredicted
89,177 ຄັ້ງທີ່ເບິ່ງ
801 ກຳລັງສົນທະນາ
8
#B14gReportsUnauthorizedTransferOfAbout97MCORE
34,705 ຄັ້ງທີ່ເບິ່ງ
416 ກຳລັງສົນທະນາ
9
#USSpotETHETFsPost23StraightDaysOfNetOutflows
36,964 ຄັ້ງທີ່ເບິ່ງ
409 ກຳລັງສົນທະນາ
10
#IntelHasItsWorstDaySince1974
134,141 ຄັ້ງທີ່ເບິ່ງ
1,019 ກຳລັງສົນທະນາ