
#chainlinkanalysis
chainlinkanalysis
100,567 views
65 ກຳລັງສົນທະນາ
ມາແຮງ
ຫຼ້າສຸດ

Chainlink (LINK/BRL) – Deep Dive Analysis: Consolidation or Accumulation Before the Next Move?1. Current Market Snapshot
As of July 20, 2026, 20:45, Chainlink (LINK) is trading at 43.38 BRL (approx. $7.90 USD equivalent). The pair shows a modest +0.74% gain on the day, with a 24-hour high of 43.90 BRL and a low of 42.79 BRL. The trading volume stands at 3,216.04 LINK and 139,103.80 BRL, indicating moderate but not explosive activity.
---
2. Technical Indicators – What Are They Saying?
Indicator Value Interpretation
MA(7) 43.38 Price exactly at short-term average – neutral
MA(25) 43.26 Price slightly above – mild bullish tilt
MA(99) 43.19 All MAs clustered within 0.19 BRL – tight consolidation
Bollinger Bands Available Likely squeezing – volatility contraction (watch for breakout)
SAR Available Would show trend reversal points
MACD Available Check for crossover momentum
RSI Available Look for overbought (>70) or oversold (<30) levels
KDJ Available Sensitive to short-term swings
OBV Available On-Balance Volume – confirms if volume supports price
Key observation: The MA cluster (7, 25, 99) is extremely tight – this is a classic volatility squeeze. When all major moving averages converge, a sharp move (up or down) typically follows. The next 24–48 hours could be decisive.
---
3. Order Book & Market Sentiment
Side Percentage
Bids 22.73%
Asks 77.27%
Sellers are dominating the order book at 77.27% – this suggests overhead resistance. However, note that buy orders at 43.13–43.14 show strong support just below current price. The depth shows accumulating bids from 43.03 to 43.34, while asks are stacked from 43.13 to 43.56.
Interpretation: There's a battle at 43.13–43.15. If buyers absorb the sell wall, we could see a push toward 43.90 and beyond. If sellers win, a drop to 43.03–43.07 is likely.
---
4. Performance Timeline – The Bigger Picture
Timeframe Return Insight
Today +1.10% Short-term stability
7 Days +4.50% Mild recovery
30 Days +6.48% Building momentum
90 Days -6.75% Still in a downtrend
180 Days -34.26% Heavy correction
1 Year -57.71% Bear market from highs
Critical takeaway: While short-term (7D, 30D) shows recovery, the 1-year loss of -57.71% indicates LINK is far from its bull-market peaks. This could be:
· A bear market rally – temporary bounce before further downside, OR
· A long-term accumulation zone – smart money buying at discounted prices.
---
5. What’s Driving Chainlink Right Now?
1. Oracles Demand: Chainlink remains the #1 decentralized oracle network. With DeFi, RWA (Real-World Assets), and AI integrations growing, LINK's utility is undeniable.
2. Market Sentiment: Crypto-wide consolidation ahead of potential macro shifts (interest rates, ETF flows, etc.).
3. Technical Setup: The tight MA squeeze + RSI near middle range (not overbought/oversold) gives no clear directional bias – patience is key.
---
6. Scenarios to Watch
Bullish Scenario (Breakout above 43.90)
· Confirm with volume spike (VOL indicator).
· RSI crossing above 60–65.
· OBV rising – accumulation.
· Target 1: 45.50 BRL (previous resistance)
· Target 2: 48.00 BRL (psychological level)
Bearish Scenario (Breakdown below 42.79)
· MACD bearish crossover.
· RSI falling below 40.
· Increasing sell volume.
· Target 1: 41.50 BRL
· Target 2: 39.00 BRL (major support)
---
7. Trading Strategy for LINK/BRL
Trader Type Strategy
Scalper Trade within 43.00–43.90 range with tight stops.
Swing Trader Wait for breakout above 43.90 or breakdown below 42.79 – then ride the move.
Long-term Investor Accumulate on dips near 41–42 BRL if fundamentals remain strong. DCA (Dollar-Cost Average) into positions.
---
8. Final Verdict
Chainlink is at a critical juncture. The price is coiling up like a spring – the longer it consolidates, the stronger the eventual move. With 77% asks pressuring from above but strong bids at 43.13, the market is waiting for a catalyst.
My bias: Slightly bullish in the short term IF 43.90 breaks with volume. But caution is warranted – the 1-year chart shows this is still a recovery phase, not a new bull run.
---
9. Engage With Us
What’s your take on LINK?
· Are you buying this dip?
· Do you see further downside to 39 BRL?
· Or is this the calm before a massive pump?
Drop your charts, predictions, and analysis below 👇 Let's earn together!
#SpaceXReschedulesStarshipFlight13ToJuly23 #ChainlinkAnalysis #LINKUSDT #CryptoWriting #TechnicalAnalysiss
Chainlink (LINK/BRL) – Deep Dive Analysis: Consolidation or Accumulation Before the Next Move?
1. Current Market Snapshot
As of July 20, 2026, 20:45, Chainlink (LINK) is trading at 43.38 BRL (approx. $7.90 USD equivalent). The pair shows a modest +0.74% gain on the day, with a 24-hour high of 43.90 BRL and a low of 42.79 BRL. The trading volume stands at 3,216.04 LINK and 139,103.80 BRL, indicating moderate but not explosive activity.
---
2. Technical Indicators – What Are They Saying?
Indicator Value Interpretation
MA(7) 43.38 Price exactly at short-term average – neutral
MA(25) 43.26 Price slightly above – mild bullish tilt
MA(99) 43.19 All MAs clustered within 0.19 BRL – tight consolidation
Bollinger Bands Available Likely squeezing – volatility contraction (watch for breakout)
SAR Available Would show trend reversal points
MACD Available Check for crossover momentum
RSI Available Look for overbought (>70) or oversold (<30) levels
KDJ Available Sensitive to short-term swings
OBV Available On-Balance Volume – confirms if volume supports price
Key observation: The MA cluster (7, 25, 99) is extremely tight – this is a classic volatility squeeze. When all major moving averages converge, a sharp move (up or down) typically follows. The next 24–48 hours could be decisive.
---
3. Order Book & Market Sentiment
Side Percentage
Bids 22.73%
Asks 77.27%
Sellers are dominating the order book at 77.27% – this suggests overhead resistance. However, note that buy orders at 43.13–43.14 show strong support just below current price. The depth shows accumulating bids from 43.03 to 43.34, while asks are stacked from 43.13 to 43.56.
Interpretation: There's a battle at 43.13–43.15. If buyers absorb the sell wall, we could see a push toward 43.90 and beyond. If sellers win, a drop to 43.03–43.07 is likely.
---
4. Performance Timeline – The Bigger Picture
Timeframe Return Insight
Today +1.10% Short-term stability
7 Days +4.50% Mild recovery
30 Days +6.48% Building momentum
90 Days -6.75% Still in a downtrend
180 Days -34.26% Heavy correction
1 Year -57.71% Bear market from highs
Critical takeaway: While short-term (7D, 30D) shows recovery, the 1-year loss of -57.71% indicates LINK is far from its bull-market peaks. This could be:
· A bear market rally – temporary bounce before further downside, OR
· A long-term accumulation zone – smart money buying at discounted prices.
---
5. What’s Driving Chainlink Right Now?
1. Oracles Demand: Chainlink remains the #1 decentralized oracle network. With DeFi, RWA (Real-World Assets), and AI integrations growing, LINK's utility is undeniable.
2. Market Sentiment: Crypto-wide consolidation ahead of potential macro shifts (interest rates, ETF flows, etc.).
3. Technical Setup: The tight MA squeeze + RSI near middle range (not overbought/oversold) gives no clear directional bias – patience is key.
---
6. Scenarios to Watch
Bullish Scenario (Breakout above 43.90)
· Confirm with volume spike (VOL indicator).
· RSI crossing above 60–65.
· OBV rising – accumulation.
· Target 1: 45.50 BRL (previous resistance)
· Target 2: 48.00 BRL (psychological level)
Bearish Scenario (Breakdown below 42.79)
· MACD bearish crossover.
· RSI falling below 40.
· Increasing sell volume.
· Target 1: 41.50 BRL
· Target 2: 39.00 BRL (major support)
---
7. Trading Strategy for LINK/BRL
Trader Type Strategy
Scalper Trade within 43.00–43.90 range with tight stops.
Swing Trader Wait for breakout above 43.90 or breakdown below 42.79 – then ride the move.
Long-term Investor Accumulate on dips near 41–42 BRL if fundamentals remain strong. DCA (Dollar-Cost Average) into positions.
---
8. Final Verdict
Chainlink is at a critical juncture. The price is coiling up like a spring – the longer it consolidates, the stronger the eventual move. With 77% asks pressuring from above but strong bids at 43.13, the market is waiting for a catalyst.
My bias: Slightly bullish in the short term IF 43.90 breaks with volume. But caution is warranted – the 1-year chart shows this is still a recovery phase, not a new bull run.
---
9. Engage With Us
What’s your take on LINK?
· Are you buying this dip?
· Do you see further downside to 39 BRL?
· Or is this the calm before a massive pump?
Drop your charts, predictions, and analysis below 👇 Let's earn together!
#SpaceXReschedulesStarshipFlight13ToJuly23 #ChainlinkAnalysis #LINKUSDT #CryptoWriting #TechnicalAnalysiss
As of July 20, 2026, 20:45, Chainlink (LINK) is trading at 43.38 BRL (approx. $7.90 USD equivalent). The pair shows a modest +0.74% gain on the day, with a 24-hour high of 43.90 BRL and a low of 42.79 BRL. The trading volume stands at 3,216.04 LINK and 139,103.80 BRL, indicating moderate but not explosive activity.
---
2. Technical Indicators – What Are They Saying?
Indicator Value Interpretation
MA(7) 43.38 Price exactly at short-term average – neutral
MA(25) 43.26 Price slightly above – mild bullish tilt
MA(99) 43.19 All MAs clustered within 0.19 BRL – tight consolidation
Bollinger Bands Available Likely squeezing – volatility contraction (watch for breakout)
SAR Available Would show trend reversal points
MACD Available Check for crossover momentum
RSI Available Look for overbought (>70) or oversold (<30) levels
KDJ Available Sensitive to short-term swings
OBV Available On-Balance Volume – confirms if volume supports price
Key observation: The MA cluster (7, 25, 99) is extremely tight – this is a classic volatility squeeze. When all major moving averages converge, a sharp move (up or down) typically follows. The next 24–48 hours could be decisive.
---
3. Order Book & Market Sentiment
Side Percentage
Bids 22.73%
Asks 77.27%
Sellers are dominating the order book at 77.27% – this suggests overhead resistance. However, note that buy orders at 43.13–43.14 show strong support just below current price. The depth shows accumulating bids from 43.03 to 43.34, while asks are stacked from 43.13 to 43.56.
Interpretation: There's a battle at 43.13–43.15. If buyers absorb the sell wall, we could see a push toward 43.90 and beyond. If sellers win, a drop to 43.03–43.07 is likely.
---
4. Performance Timeline – The Bigger Picture
Timeframe Return Insight
Today +1.10% Short-term stability
7 Days +4.50% Mild recovery
30 Days +6.48% Building momentum
90 Days -6.75% Still in a downtrend
180 Days -34.26% Heavy correction
1 Year -57.71% Bear market from highs
Critical takeaway: While short-term (7D, 30D) shows recovery, the 1-year loss of -57.71% indicates LINK is far from its bull-market peaks. This could be:
· A bear market rally – temporary bounce before further downside, OR
· A long-term accumulation zone – smart money buying at discounted prices.
---
5. What’s Driving Chainlink Right Now?
1. Oracles Demand: Chainlink remains the #1 decentralized oracle network. With DeFi, RWA (Real-World Assets), and AI integrations growing, LINK's utility is undeniable.
2. Market Sentiment: Crypto-wide consolidation ahead of potential macro shifts (interest rates, ETF flows, etc.).
3. Technical Setup: The tight MA squeeze + RSI near middle range (not overbought/oversold) gives no clear directional bias – patience is key.
---
6. Scenarios to Watch
Bullish Scenario (Breakout above 43.90)
· Confirm with volume spike (VOL indicator).
· RSI crossing above 60–65.
· OBV rising – accumulation.
· Target 1: 45.50 BRL (previous resistance)
· Target 2: 48.00 BRL (psychological level)
Bearish Scenario (Breakdown below 42.79)
· MACD bearish crossover.
· RSI falling below 40.
· Increasing sell volume.
· Target 1: 41.50 BRL
· Target 2: 39.00 BRL (major support)
---
7. Trading Strategy for LINK/BRL
Trader Type Strategy
Scalper Trade within 43.00–43.90 range with tight stops.
Swing Trader Wait for breakout above 43.90 or breakdown below 42.79 – then ride the move.
Long-term Investor Accumulate on dips near 41–42 BRL if fundamentals remain strong. DCA (Dollar-Cost Average) into positions.
---
8. Final Verdict
Chainlink is at a critical juncture. The price is coiling up like a spring – the longer it consolidates, the stronger the eventual move. With 77% asks pressuring from above but strong bids at 43.13, the market is waiting for a catalyst.
My bias: Slightly bullish in the short term IF 43.90 breaks with volume. But caution is warranted – the 1-year chart shows this is still a recovery phase, not a new bull run.
---
9. Engage With Us
What’s your take on LINK?
· Are you buying this dip?
· Do you see further downside to 39 BRL?
· Or is this the calm before a massive pump?
Drop your charts, predictions, and analysis below 👇 Let's earn together!
#SpaceXReschedulesStarshipFlight13ToJuly23 #ChainlinkAnalysis #LINKUSDT #CryptoWriting #TechnicalAnalysiss
79

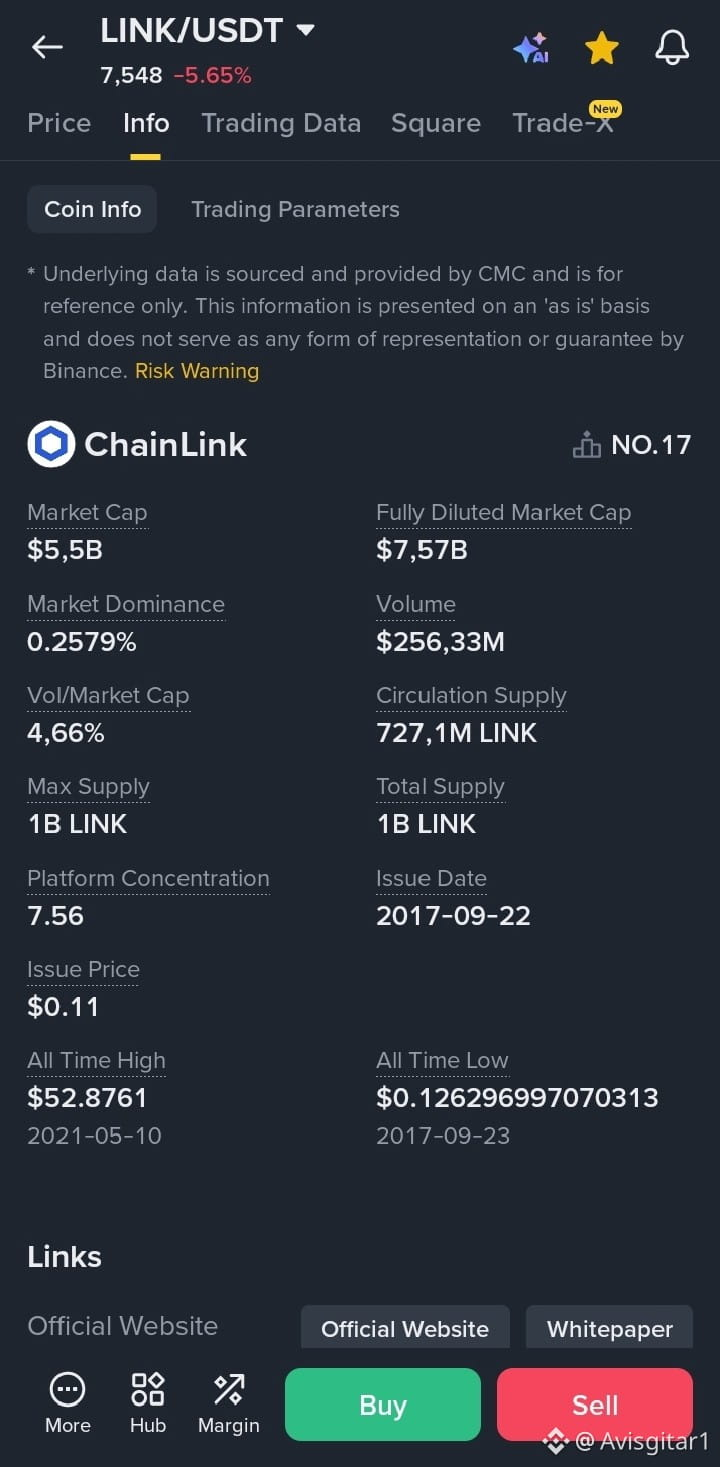
Is anyone still unsure about which coin to invest in?
Chainlink =
✓ A solid project
✓ Strong fundamentals
✓ Has a pretty good track record
disclaimer:
Not financial advice (Do Your Own Research)
$LINK $LINK #ChainlinkAnalysis
Is anyone still unsure about which coin to invest in?
Chainlink =
✓ A solid project
✓ Strong fundamentals
✓ Has a pretty good track record
disclaimer:
Not financial advice (Do Your Own Research)
$LINK $LINK #ChainlinkAnalysis
Chainlink =
✓ A solid project
✓ Strong fundamentals
✓ Has a pretty good track record
disclaimer:
Not financial advice (Do Your Own Research)
$LINK $LINK #ChainlinkAnalysis
258

·
--
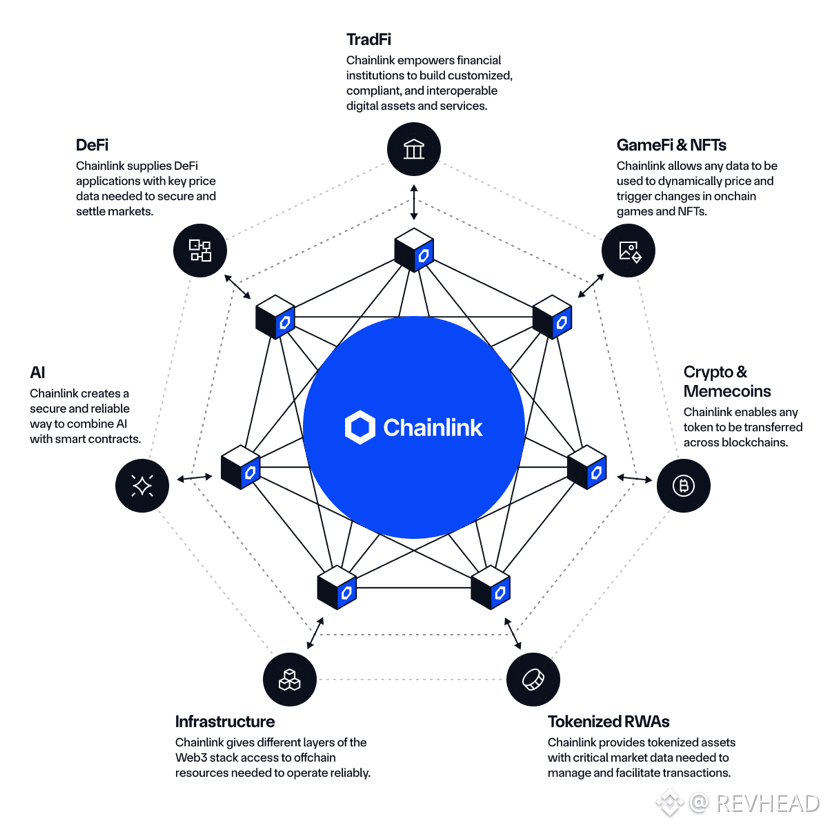
If capital rotates back toward quality, $LINK should stay in the conversation.
That doesn’t guarantee a breakout, but it does mean I’m paying attention to how it behaves relative to weaker alt names on pullbacks.
#LINK #ChainlinkAnalysis
If capital rotates back toward quality, $LINK should stay in the conversation.
That doesn’t guarantee a breakout, but it does mean I’m paying attention to how it behaves relative to weaker alt names on pullbacks.
#LINK #ChainlinkAnalysis
That doesn’t guarantee a breakout, but it does mean I’m paying attention to how it behaves relative to weaker alt names on pullbacks.
#LINK #ChainlinkAnalysis
36

$DOT interoperability could become the next huge crypto narrative. #dot #Polkadot
$LINK keeps powering real blockchain utility worldwide. #LINK #ChainlinkAnalysis #SchwabOpensCryptoAccounts
$DOT interoperability could become the next huge crypto narrative. #dot #Polkadot
$LINK keeps powering real blockchain utility worldwide. #LINK #ChainlinkAnalysis #SchwabOpensCryptoAccounts
$LINK keeps powering real blockchain utility worldwide. #LINK #ChainlinkAnalysis #SchwabOpensCryptoAccounts

96
ເຂົ້າສູ່ລະບົບເພື່ອສຳຫຼວດເນື້ອຫາເພີ່ມເຕີມ
ເຂົ້າຮ່ວມກຸ່ມຜູ້ໃຊ້ຄຣິບໂຕທົ່ວໂລກໃນ Binance Square.
⚡️ ໄດ້ຮັບຂໍ້ມູນຫຼ້າສຸດ ແລະ ທີ່ມີປະໂຫຍດກ່ຽວກັບຄຣິບໂຕ.
💬 ໄດ້ຮັບຄວາມໄວ້ວາງໃຈຈາກຕະຫຼາດແລກປ່ຽນຄຣິບໂຕທີ່ໃຫຍ່ທີ່ສຸດໃນໂລກ.
👍 ຄົ້ນຫາຂໍ້ມູນເຊີງເລິກທີ່ແທ້ຈາກນັກສ້າງທີ່ໄດ້ຮັບການຢືນຢັນ.
ອີເມວ / ເບີໂທລະສັບ
ຫົວຂໍ້ທີ່ກໍາລັງນິຍົມ
1
#USIranTradeTankerStrikesEscalate
74,978 views
1,696 ກຳລັງສົນທະນາ
2
#CanadaToImpose15%To50%TariffsOnUSGoods
4,965 views
212 ກຳລັງສົນທະນາ
3
#ZcashRises45%WeeklyToHighestSince2016
27,800 views
597 ກຳລັງສົນທະນາ
4
#LiquidNetworkSuffers$320MExploit
2,641 views
71 ກຳລັງສົນທະນາ
5
#IMFSaysElSalvadorBTCNoPublicFunds
67,418 views
1,331 ກຳລັງສົນທະນາ
6
#IranSaysItHit3USShips3Tankers
41,002 views
862 ກຳລັງສົນທະນາ
7
#SideSwapSuspendsLiquidServices
43,829 views
755 ກຳລັງສົນທະນາ
8
#RussiaUkraineTradeStrikesKushnerWitkoffToKyiv
37,373 views
706 ກຳລັງສົນທະນາ
9
#EightChineseFinancialFirmsRaise360BYuan
21,776 views
481 ກຳລັງສົນທະນາ
10
#IranToSetRestrictedZoneNearHormuz
23,756 views
373 ກຳລັງສົນທະນາ