
#candle
candle
89,464 views
162 ກຳລັງສົນທະນາ
ມາແຮງ
ຫຼ້າສຸດ
📊 Understanding Candlestick Charts in Trading
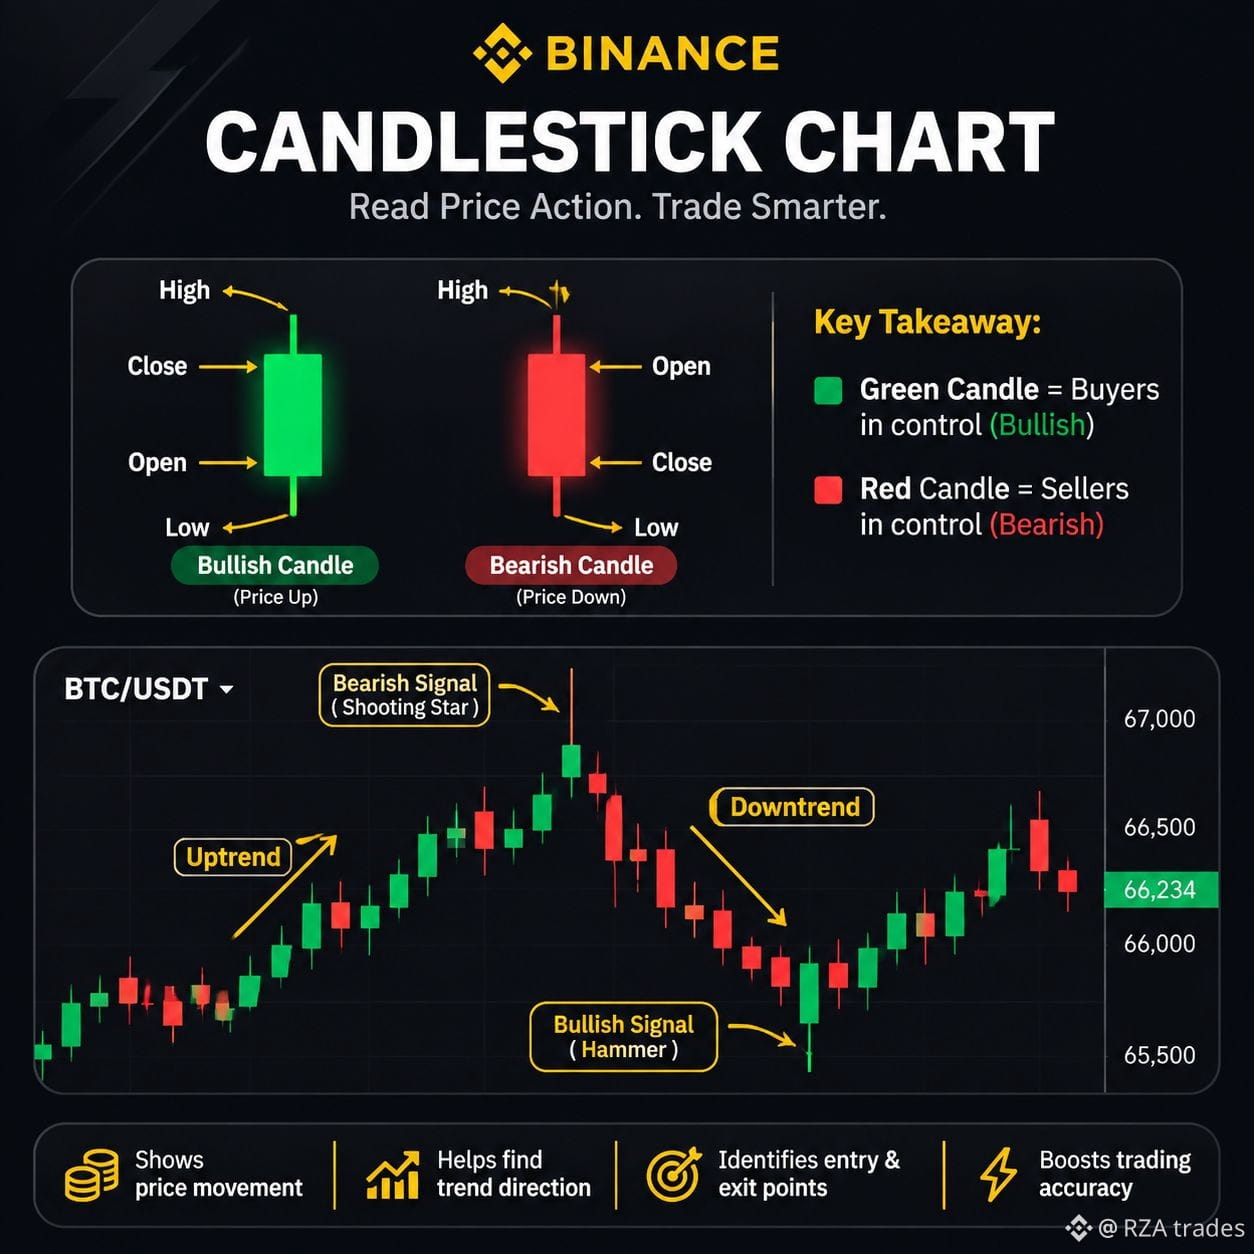
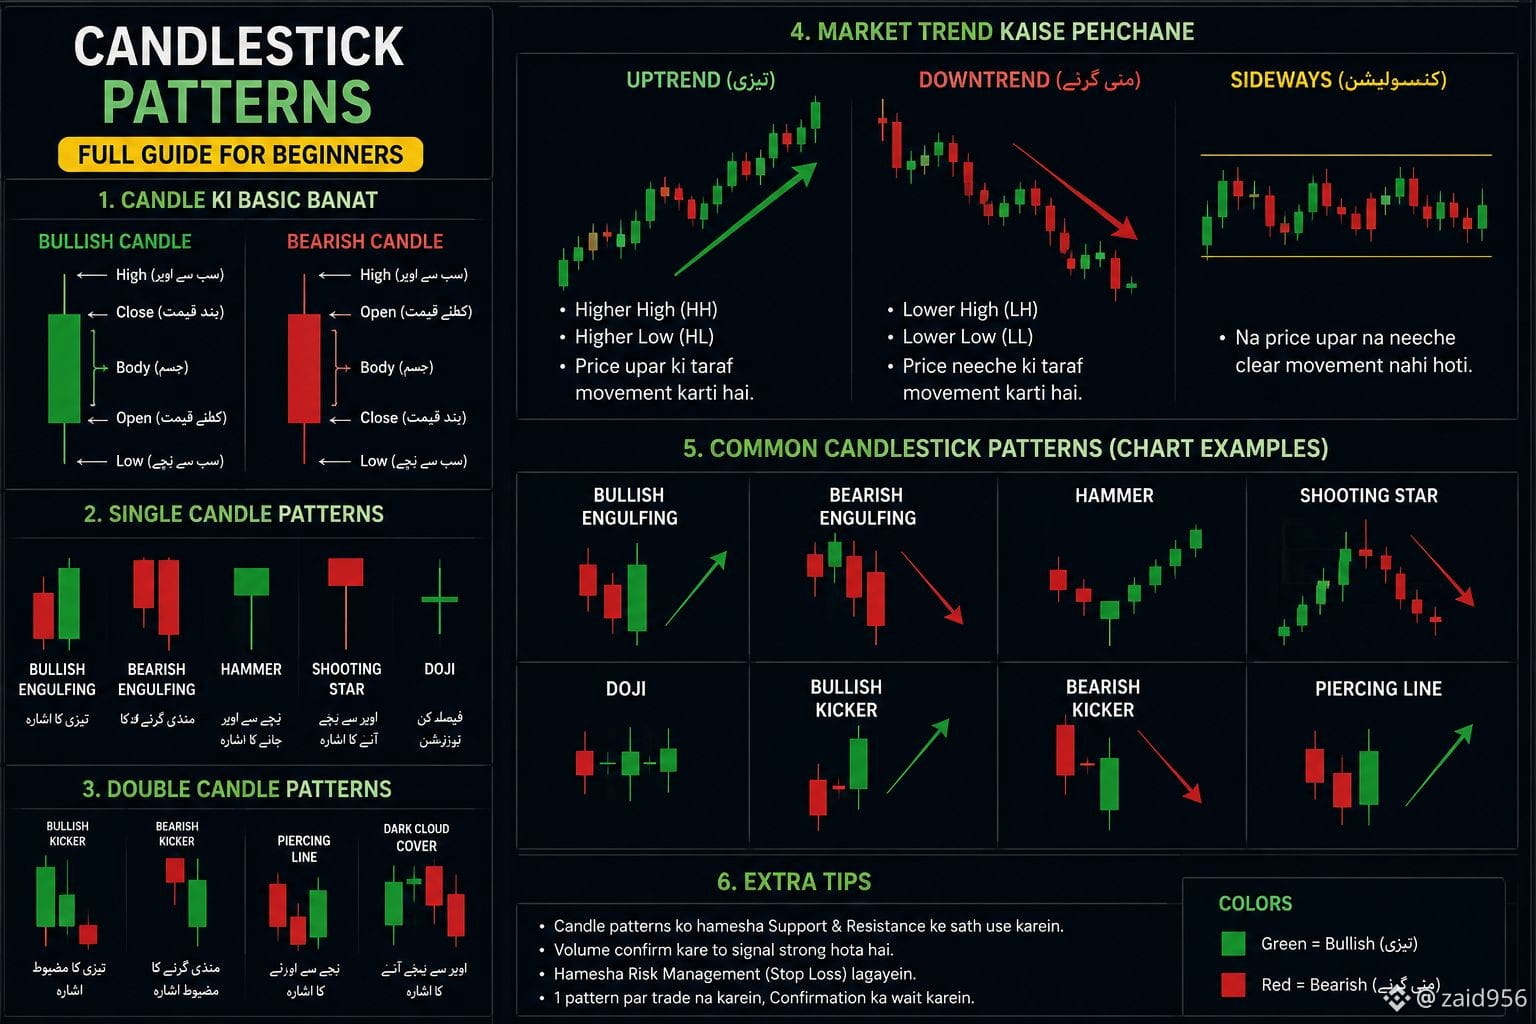
Candlesticks are a visual representation of price movement on Binance charts.
Each candle shows four important points: Open, High, Low, and Close (OHLC) price.
Green candles indicate buying pressure, while red candles show selling pressure.
Traders use candle patterns to understand market sentiment and predict possible price movements.
Learning candlesticks is the first step toward smarter technical analysis. 📈
#candlestick_patterns #candle
Candlesticks are a visual representation of price movement on Binance charts.
Each candle shows four important points: Open, High, Low, and Close (OHLC) price.
Green candles indicate buying pressure, while red candles show selling pressure.
Traders use candle patterns to understand market sentiment and predict possible price movements.
Learning candlesticks is the first step toward smarter technical analysis. 📈
#candlestick_patterns #candle

📈 Green candles can create FOMO. 📉 Red candles can create panic.
Try not to let emotions control your decisions.
$BTC
#candlestick #candle
Try not to let emotions control your decisions.
$BTC
#candlestick #candle


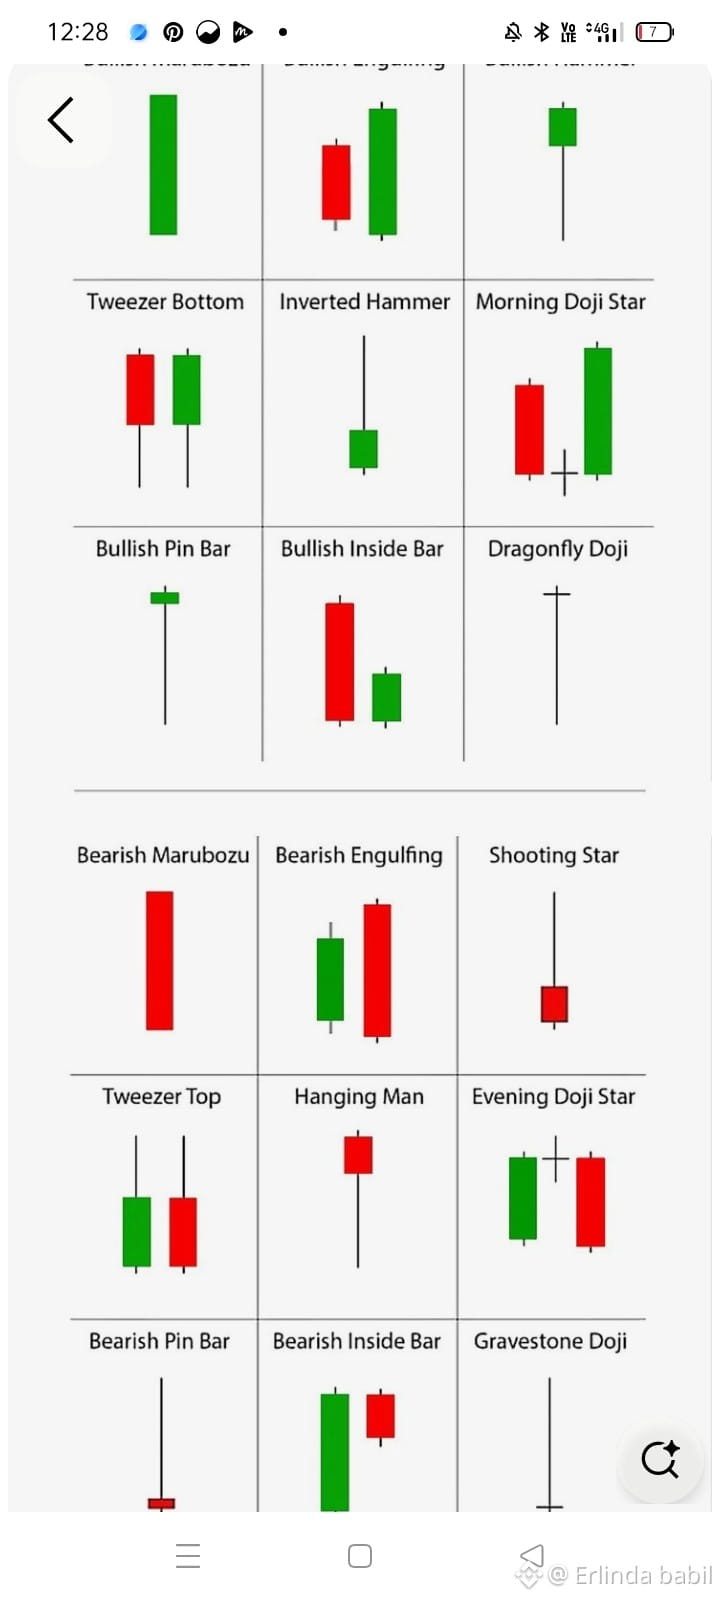

predicting the future with certainty—it is about understanding market behavior, managing risk, and preparing for better trading opportunities
Every candlestick tells a story. 🕯️📈 Understanding candlestick patterns helps traders analyze the battle between buyers and sellers, identify market momentum, spot potential reversals, and make more informed trading decisions.
🔹 Big candles can show strong momentum
🔹 Long wicks may indicate price rejection
🔹 Doji candles often show market indecision
🔹 Multiple candles can provide confirmation
🔹 Always follow the trend and wait for confirmation
#candlestick #candlestick_patterns #candle #CandleStory #CryptoPatience
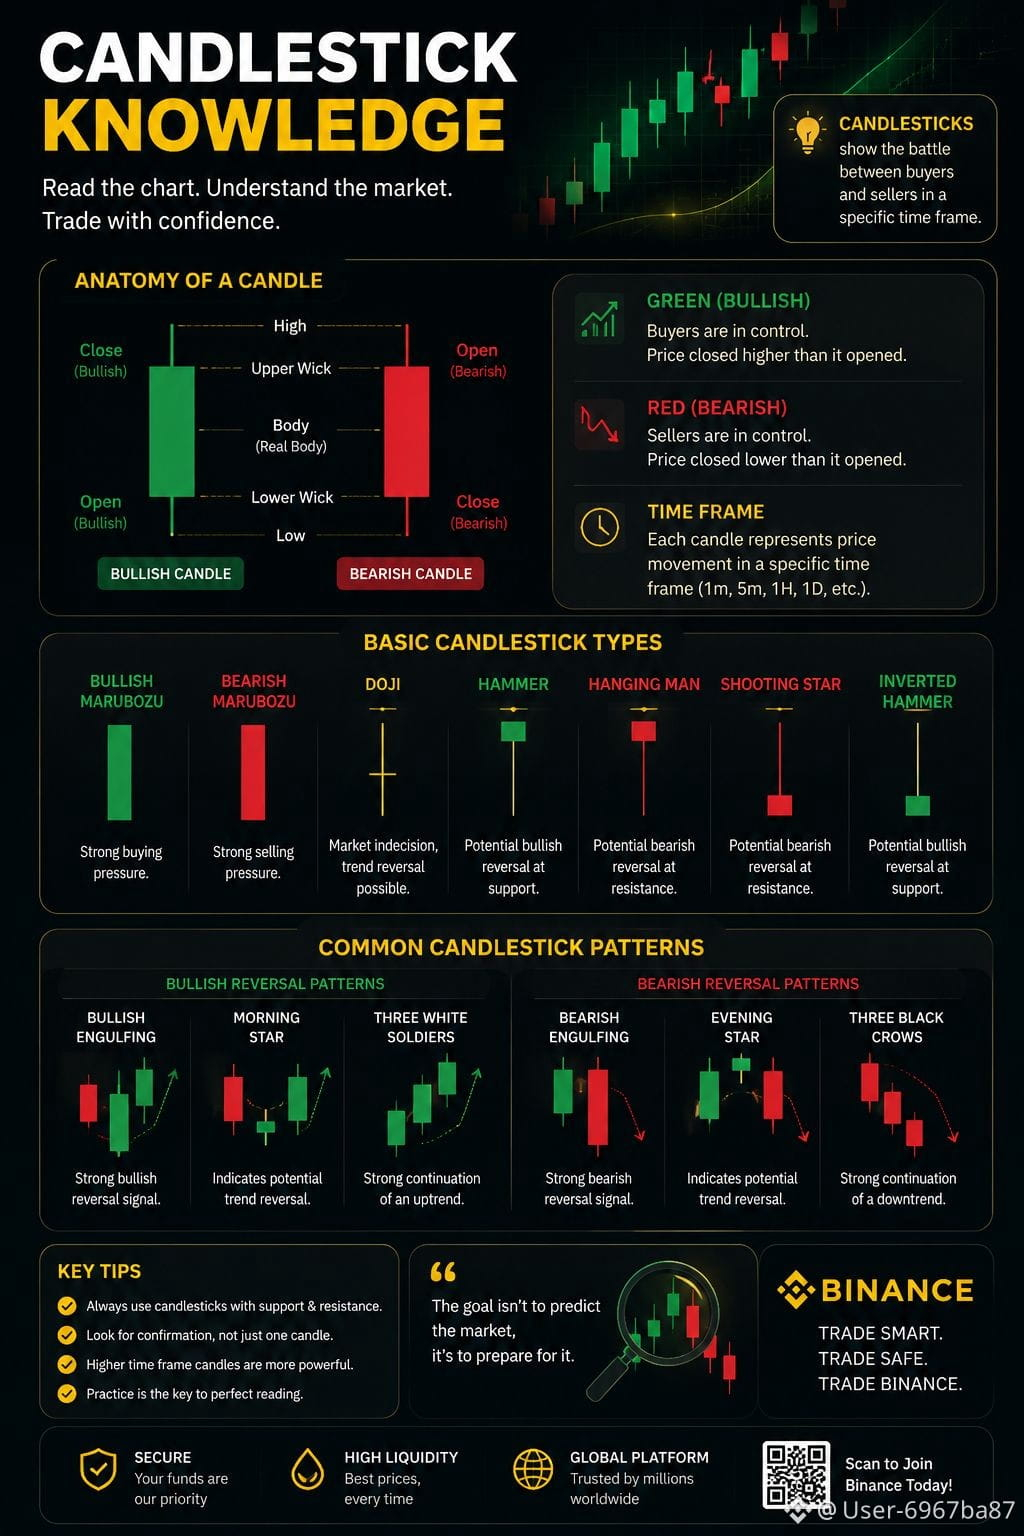
Every candlestick tells a story. 🕯️📈 Understanding candlestick patterns helps traders analyze the battle between buyers and sellers, identify market momentum, spot potential reversals, and make more informed trading decisions.
🔹 Big candles can show strong momentum
🔹 Long wicks may indicate price rejection
🔹 Doji candles often show market indecision
🔹 Multiple candles can provide confirmation
🔹 Always follow the trend and wait for confirmation
#candlestick #candlestick_patterns #candle #CandleStory #CryptoPatience
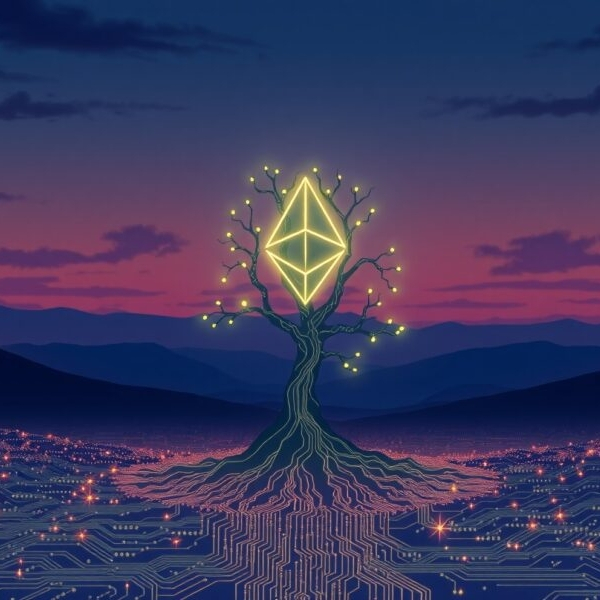
Life is an unfinished #chart …❤️🔥
Some days you shine like a green #candle $BNB 💚📈, some days you melt like a red one ❤️🩹📉.
But the beauty is in the rhythm—❤️🔥
the quiet moments, the hidden battles, the silent prayers you whisper before every decision 🌙✨.
Trading teaches you what life never says out loud:
Every fall carries a future rise. Every loss carries a hidden lesson.
And the ones who survive the storm…
become the ones who lead the market of their own destiny ⚡🔥💛
Some days you shine like a green #candle $BNB 💚📈, some days you melt like a red one ❤️🩹📉.
But the beauty is in the rhythm—❤️🔥
the quiet moments, the hidden battles, the silent prayers you whisper before every decision 🌙✨.
Trading teaches you what life never says out loud:
Every fall carries a future rise. Every loss carries a hidden lesson.
And the ones who survive the storm…
become the ones who lead the market of their own destiny ⚡🔥💛




ເຂົ້າສູ່ລະບົບເພື່ອສຳຫຼວດເນື້ອຫາເພີ່ມເຕີມ