

#btcusdc
btcusdc
55,401 views
356 ກຳລັງສົນທະນາ
ມາແຮງ
ຫຼ້າສຸດ


·
--

ບົດຄວາມ
$BTC перед CPI: отскок есть, но 4H остаётся слабымПриветствую вас, дорогие друзья. Хочу представить детальный анализ по $BTC .
Bitcoin сейчас находится около $77 300. После снижения к зоне $76 200–76 400 цена пытается восстановиться, но пока я не вижу подтверждения полноценного разворота вверх.
На 15M картина пока выглядит лучше. Цена держится выше Supertrend около $76 908 и выше SAR около $77 078. Это говорит о том, что краткосрочный отскок ещё сохраняется.
Но на 4H ситуация слабее. BTC находится около $77 300, а Supertrend расположен примерно на $79 057. Пока цена ниже этого уровня, я рассматриваю рост как восстановление после падения, а не как новый восходящий тренд.
На дневном графике Supertrend находится около $72 658. Поэтому крупный восходящий тренд пока не сломан. Сейчас основная проблема именно на 4H.
Что показывают фьючерсы
Открытый интерес по BTCUSDC составляет около 18 542 BTC, или примерно $1,43 млрд.
При этом лонгов заметно больше: около 61,2% против 38,8% шортов.
Это важно, если BTC потеряет поддержку $76 200–76 400. При таком снижении часть лонгов начнёт закрываться, а их закрытие означает дополнительные продажи. Поэтому пробой этой зоны может ускорить падение.
На 5M это уже частично подтверждается: в последних периодах несколько волн агрессивных продаж были сильнее покупок.
Макроэкономика
Вчерашний PPI США показал рост цен производителей на 0,4% за месяц и 5,4% за год. После этого ожидания повышения ставки ФРС выросли примерно до 70%. (Reuters)
Сегодня главным событием станет CPI США. Рынок ожидает его именно потому, что эти данные могут изменить ожидания по решению ФРС на заседании 15–16 сентября. (Reuters)
Для Bitcoin логика здесь простая: если инфляция окажется выше ожиданий, давление на рискованные активы может усилиться. Если данные будут мягче, BTC получит шанс на более сильный отскок.
При этом спотовые Bitcoin ETF после сильных притоков в начале месяца показали два дня оттока подряд: −$46,6 млн 8 сентября и −$120,2 млн 9 сентября. Это не означает исчезновения институционального спроса, но показывает, что сейчас он не усиливает движение вверх. (TFTC)
Мой сценарий
Главная поддержка сейчас $76 200–76 400. Пока она держится, Bitcoin может продолжить отскок к $78 000–79 000.
Но для более уверенного разворота вверх мне нужно увидеть возврат и закрепление выше $79 000–79 100. Именно здесь проходит 4H Supertrend.
Если же $76 200–76 400 будет пробита и цена закрепится ниже на 4H, вероятность продолжения снижения заметно увеличится.
Поэтому сейчас я вижу следующую картину: 15M пытается развернуться вверх, 4H остаётся под давлением, а дневной тренд пока сохраняется. Сегодня главным фактором, который может изменить эту картину, станет CPI США.
Торговые пары, которые я отслеживаю: #BTCUSDT Perpetual и #BTCUSDC Perpetual.
#CPIWatch #BTC #BTCUSDT #BTCUSDC
$BTC перед CPI: отскок есть, но 4H остаётся слабым
Приветствую вас, дорогие друзья. Хочу представить детальный анализ по $BTC .
Bitcoin сейчас находится около $77 300. После снижения к зоне $76 200–76 400 цена пытается восстановиться, но пока я не вижу подтверждения полноценного разворота вверх.
На 15M картина пока выглядит лучше. Цена держится выше Supertrend около $76 908 и выше SAR около $77 078. Это говорит о том, что краткосрочный отскок ещё сохраняется.
Но на 4H ситуация слабее. BTC находится около $77 300, а Supertrend расположен примерно на $79 057. Пока цена ниже этого уровня, я рассматриваю рост как восстановление после падения, а не как новый восходящий тренд.
На дневном графике Supertrend находится около $72 658. Поэтому крупный восходящий тренд пока не сломан. Сейчас основная проблема именно на 4H.
Что показывают фьючерсы
Открытый интерес по BTCUSDC составляет около 18 542 BTC, или примерно $1,43 млрд.
При этом лонгов заметно больше: около 61,2% против 38,8% шортов.
Это важно, если BTC потеряет поддержку $76 200–76 400. При таком снижении часть лонгов начнёт закрываться, а их закрытие означает дополнительные продажи. Поэтому пробой этой зоны может ускорить падение.
На 5M это уже частично подтверждается: в последних периодах несколько волн агрессивных продаж были сильнее покупок.
Макроэкономика
Вчерашний PPI США показал рост цен производителей на 0,4% за месяц и 5,4% за год. После этого ожидания повышения ставки ФРС выросли примерно до 70%. (Reuters)
Сегодня главным событием станет CPI США. Рынок ожидает его именно потому, что эти данные могут изменить ожидания по решению ФРС на заседании 15–16 сентября. (Reuters)
Для Bitcoin логика здесь простая: если инфляция окажется выше ожиданий, давление на рискованные активы может усилиться. Если данные будут мягче, BTC получит шанс на более сильный отскок.
При этом спотовые Bitcoin ETF после сильных притоков в начале месяца показали два дня оттока подряд: −$46,6 млн 8 сентября и −$120,2 млн 9 сентября. Это не означает исчезновения институционального спроса, но показывает, что сейчас он не усиливает движение вверх. (TFTC)
Мой сценарий
Главная поддержка сейчас $76 200–76 400. Пока она держится, Bitcoin может продолжить отскок к $78 000–79 000.
Но для более уверенного разворота вверх мне нужно увидеть возврат и закрепление выше $79 000–79 100. Именно здесь проходит 4H Supertrend.
Если же $76 200–76 400 будет пробита и цена закрепится ниже на 4H, вероятность продолжения снижения заметно увеличится.
Поэтому сейчас я вижу следующую картину: 15M пытается развернуться вверх, 4H остаётся под давлением, а дневной тренд пока сохраняется. Сегодня главным фактором, который может изменить эту картину, станет CPI США.
Торговые пары, которые я отслеживаю: #BTCUSDT Perpetual и #BTCUSDC Perpetual.
#CPIWatch #BTC #BTCUSDT #BTCUSDC
Bitcoin сейчас находится около $77 300. После снижения к зоне $76 200–76 400 цена пытается восстановиться, но пока я не вижу подтверждения полноценного разворота вверх.
На 15M картина пока выглядит лучше. Цена держится выше Supertrend около $76 908 и выше SAR около $77 078. Это говорит о том, что краткосрочный отскок ещё сохраняется.
Но на 4H ситуация слабее. BTC находится около $77 300, а Supertrend расположен примерно на $79 057. Пока цена ниже этого уровня, я рассматриваю рост как восстановление после падения, а не как новый восходящий тренд.
На дневном графике Supertrend находится около $72 658. Поэтому крупный восходящий тренд пока не сломан. Сейчас основная проблема именно на 4H.
Что показывают фьючерсы
Открытый интерес по BTCUSDC составляет около 18 542 BTC, или примерно $1,43 млрд.
При этом лонгов заметно больше: около 61,2% против 38,8% шортов.
Это важно, если BTC потеряет поддержку $76 200–76 400. При таком снижении часть лонгов начнёт закрываться, а их закрытие означает дополнительные продажи. Поэтому пробой этой зоны может ускорить падение.
На 5M это уже частично подтверждается: в последних периодах несколько волн агрессивных продаж были сильнее покупок.
Макроэкономика
Вчерашний PPI США показал рост цен производителей на 0,4% за месяц и 5,4% за год. После этого ожидания повышения ставки ФРС выросли примерно до 70%. (Reuters)
Сегодня главным событием станет CPI США. Рынок ожидает его именно потому, что эти данные могут изменить ожидания по решению ФРС на заседании 15–16 сентября. (Reuters)
Для Bitcoin логика здесь простая: если инфляция окажется выше ожиданий, давление на рискованные активы может усилиться. Если данные будут мягче, BTC получит шанс на более сильный отскок.
При этом спотовые Bitcoin ETF после сильных притоков в начале месяца показали два дня оттока подряд: −$46,6 млн 8 сентября и −$120,2 млн 9 сентября. Это не означает исчезновения институционального спроса, но показывает, что сейчас он не усиливает движение вверх. (TFTC)
Мой сценарий
Главная поддержка сейчас $76 200–76 400. Пока она держится, Bitcoin может продолжить отскок к $78 000–79 000.
Но для более уверенного разворота вверх мне нужно увидеть возврат и закрепление выше $79 000–79 100. Именно здесь проходит 4H Supertrend.
Если же $76 200–76 400 будет пробита и цена закрепится ниже на 4H, вероятность продолжения снижения заметно увеличится.
Поэтому сейчас я вижу следующую картину: 15M пытается развернуться вверх, 4H остаётся под давлением, а дневной тренд пока сохраняется. Сегодня главным фактором, который может изменить эту картину, станет CPI США.
Торговые пары, которые я отслеживаю: #BTCUSDT Perpetual и #BTCUSDC Perpetual.
#CPIWatch #BTC #BTCUSDT #BTCUSDC
91

·
--
ສັນຍານໝີ
BTCUSDC longs just lost another $7.39K.
The $77,781 area remains under downside pressure.
$BTC
{future}(BTCUSDT)
USDC 🔴 LIQUIDITY ZONE HIT 🔴
Long liquidation spotted 🧨
$7.3892K cleared at $77781.5
Downside liquidity swept — watch reaction 👀
🎯 TP Targets:
TP1: ~$77,003
TP2: ~$76,224
TP3: ~$75,446
#Btcusdc
BTCUSDC longs just lost another $7.39K.
The $77,781 area remains under downside pressure.
$BTC
USDC 🔴 LIQUIDITY ZONE HIT 🔴
Long liquidation spotted 🧨
$7.3892K cleared at $77781.5
Downside liquidity swept — watch reaction 👀
🎯 TP Targets:
TP1: ~$77,003
TP2: ~$76,224
TP3: ~$75,446
#Btcusdc
The $77,781 area remains under downside pressure.
$BTC
USDC 🔴 LIQUIDITY ZONE HIT 🔴
Long liquidation spotted 🧨
$7.3892K cleared at $77781.5
Downside liquidity swept — watch reaction 👀
🎯 TP Targets:
TP1: ~$77,003
TP2: ~$76,224
TP3: ~$75,446
#Btcusdc
16
·
--
ສັນຍານໝີ
BTCUSDC longs just got hit for $26.15K.
The $77,840 zone is showing another downside sweep.
$BTC
{future}(BTCUSDT)
USDC 🔴 LIQUIDITY ZONE HIT 🔴
Long liquidation spotted 🧨
$26.154K cleared at $77840.2
Downside liquidity swept — watch reaction 👀
🎯 TP Targets:
TP1: ~$77,062
TP2: ~$76,283
TP3: ~$75,505
#Btcusdc
BTCUSDC longs just got hit for $26.15K.
The $77,840 zone is showing another downside sweep.
$BTC
USDC 🔴 LIQUIDITY ZONE HIT 🔴
Long liquidation spotted 🧨
$26.154K cleared at $77840.2
Downside liquidity swept — watch reaction 👀
🎯 TP Targets:
TP1: ~$77,062
TP2: ~$76,283
TP3: ~$75,505
#Btcusdc
The $77,840 zone is showing another downside sweep.
$BTC
USDC 🔴 LIQUIDITY ZONE HIT 🔴
Long liquidation spotted 🧨
$26.154K cleared at $77840.2
Downside liquidity swept — watch reaction 👀
🎯 TP Targets:
TP1: ~$77,062
TP2: ~$76,283
TP3: ~$75,505
#Btcusdc
12

·
--
ສັນຍານກະທິງ
🚨 BTC/USDC Update Buyers Ready?
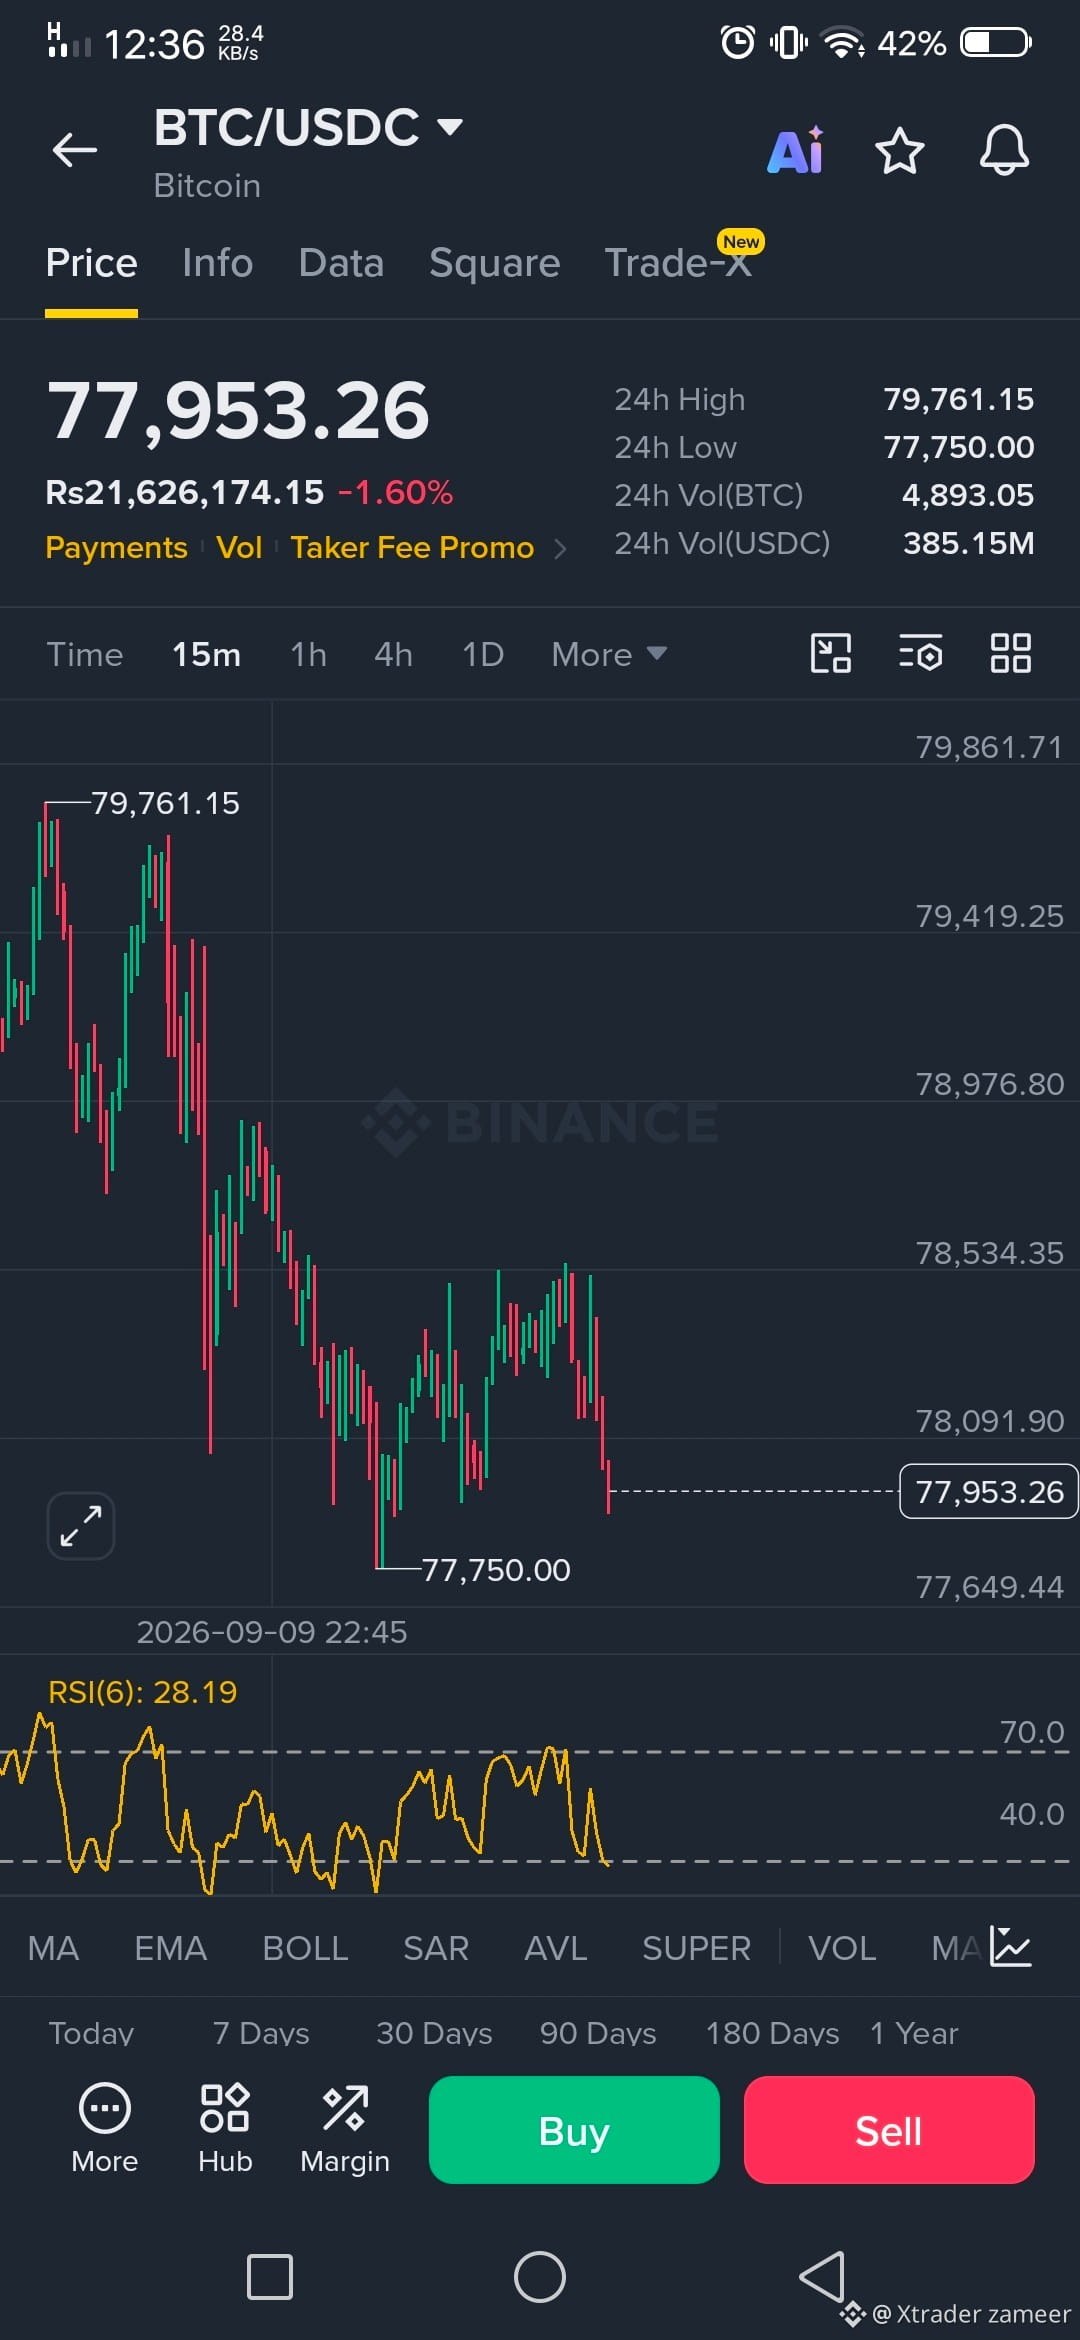
Bitcoin is currently trading around 77.9K USDC after facing strong selling pressure. 📉
The 15M RSI is near 28, showing an oversold short term condition. This could bring a relief bounce, but confirmation is important before entering any trade.
👀 Key Zone: 77,750
🔥 Resistance: 78,500/79,000
⚡ Watch the next move carefully!
Trade smart. Don’t chase the market. DYOR.
#Bitcoin #BTC #Binance #Crypto #Trading #BTCUSDC
🚨 BTC/USDC Update Buyers Ready?
Bitcoin is currently trading around 77.9K USDC after facing strong selling pressure. 📉
The 15M RSI is near 28, showing an oversold short term condition. This could bring a relief bounce, but confirmation is important before entering any trade.
👀 Key Zone: 77,750
🔥 Resistance: 78,500/79,000
⚡ Watch the next move carefully!
Trade smart. Don’t chase the market. DYOR.
#Bitcoin #BTC #Binance #Crypto #Trading #BTCUSDC
Bitcoin is currently trading around 77.9K USDC after facing strong selling pressure. 📉
The 15M RSI is near 28, showing an oversold short term condition. This could bring a relief bounce, but confirmation is important before entering any trade.
👀 Key Zone: 77,750
🔥 Resistance: 78,500/79,000
⚡ Watch the next move carefully!
Trade smart. Don’t chase the market. DYOR.
#Bitcoin #BTC #Binance #Crypto #Trading #BTCUSDC
59

·
--
$BTC USDC — URGENT MARKET UPDATE
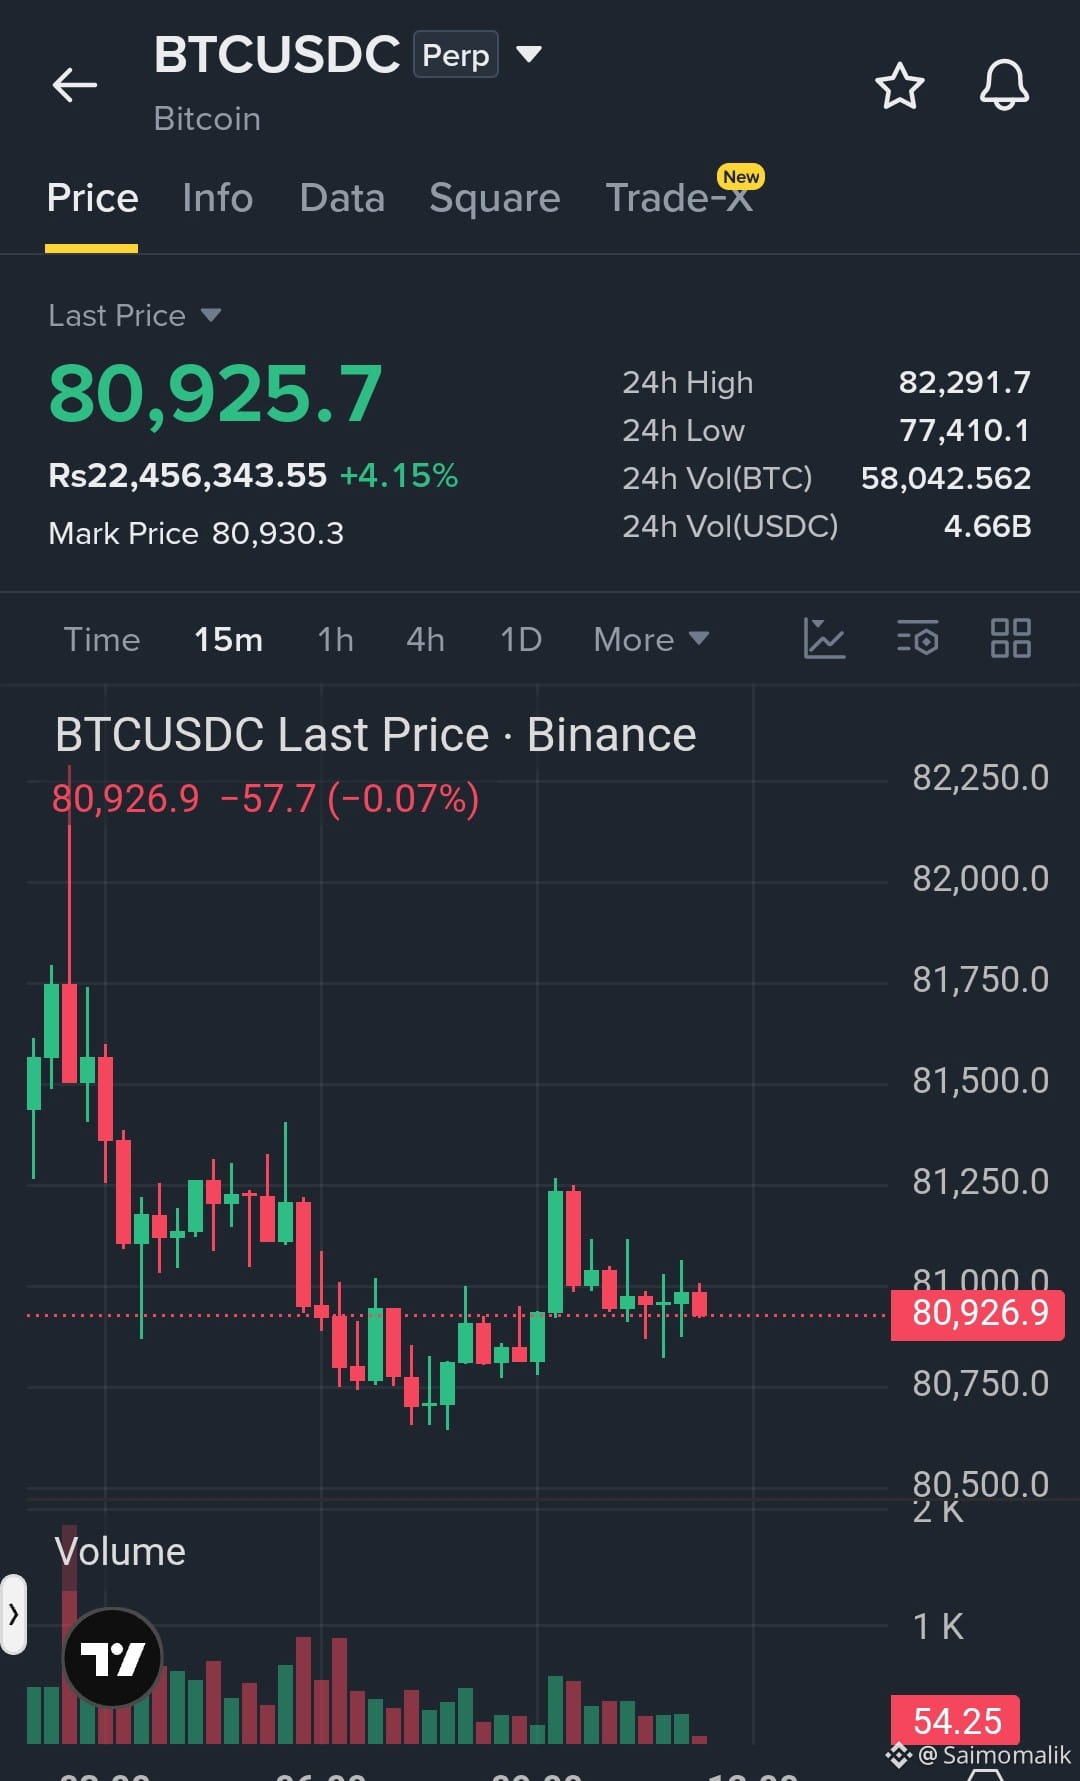
Bitcoin is holding near the 81K zone after a strong 24H rally. This matters because sustained buying could push BTC toward the 82K resistance, while rejection may trigger a sharp pullback and increased volatility across crypto markets.
TARGET: 82,000–82,250
#BTC #BTCUSDC #Bitcoin #CryptoMarkets t #Binance
$BTC USDC — URGENT MARKET UPDATE
Bitcoin is holding near the 81K zone after a strong 24H rally. This matters because sustained buying could push BTC toward the 82K resistance, while rejection may trigger a sharp pullback and increased volatility across crypto markets.
TARGET: 82,000–82,250
#BTC #BTCUSDC #Bitcoin #CryptoMarkets t #Binance
Bitcoin is holding near the 81K zone after a strong 24H rally. This matters because sustained buying could push BTC toward the 82K resistance, while rejection may trigger a sharp pullback and increased volatility across crypto markets.
TARGET: 82,000–82,250
#BTC #BTCUSDC #Bitcoin #CryptoMarkets t #Binance
1
81

$BTC
#BTCUSDC Long scalp opportunity near $78,743.1 as price holds above MA(99) support at $78,641.4, with underlying support from MA(7) at $78,368.5 and MA(25) at $78,167.0
Target: $78,936.2 to $79,548.3
Stop loss: below $78,360.0
Scalp setup only, maintain tight risk management 📈
$BTC
#BTCUSDC Long scalp opportunity near $78,743.1 as price holds above MA(99) support at $78,641.4, with underlying support from MA(7) at $78,368.5 and MA(25) at $78,167.0
Target: $78,936.2 to $79,548.3
Stop loss: below $78,360.0
Scalp setup only, maintain tight risk management 📈
#BTCUSDC Long scalp opportunity near $78,743.1 as price holds above MA(99) support at $78,641.4, with underlying support from MA(7) at $78,368.5 and MA(25) at $78,167.0
Target: $78,936.2 to $79,548.3
Stop loss: below $78,360.0
Scalp setup only, maintain tight risk management 📈
16

ບົດຄວາມ
📊 BTC/USDC — Full Market Analysis
Bitcoin (BTC/USDC) remains one of the most important trading pai📊 BTC/USDC — Full Market Analysis#BTCUSD
#Btcusdc Bitcoin (BTC/USDC) remains one of the most important trading pairs in the crypto market. On August 28, 2026, Bitcoin is trading around the $79,000–$80,500 area, after recently reaching above $81,000.
🔥 Current Market Trend#BTCUSD i8
The short-term trend for BTC appears bullish. Bitcoin has recently reclaimed the psychological $80,000 level, showing strong buying interest and positive momentum.
📈 Key Resistance Levels
- $80,000–$81,500: Major resistance zone
- $82,000: Important breakout confirmation level
- $83,000: Potential next target after a confirmed breakout
If BTC closes strongly above $82,000 with good trading volume, further bullish momentum could develop toward $83,000–$85,000.
🛡️ Key Support Levels
- $79,000–$78,000: First important support
- $77,000: Strong support zone
- $75,000: Major support level
A break below $77,000 could weaken the short-term bullish structure, while a decisive move below $75,000 could increase selling pressure.
🐂 Bullish Scenario
If Bitcoin continues to hold above $80,000 and breaks $82,000 with strong volume, the next potential targets could be $83,000 and $85,000. However, traders should watch for profit-taking near major resistance levels.
🐻 Bearish Scenario
If BTC fails to hold above $80,000 and falls below $78,000–$77,000, a short-term correction could develop. A breakdown below $75,000 would indicate increased bearish pressure.
⚠️ Risk Management
Bitcoin can experience sudden price movements and high volatility. Traders should avoid entering trades based only on predictions and should consider stop-losses, position sizing, and confirmation from price action and volume.
📝 Conclusion
BTC/USDC currently shows a bullish short-term structure, but the $80,000–$82,000 zone remains critical. A confirmed breakout above this area could open the door toward higher targets, while rejection could lead to a pullback toward the major support levels.
This is market analysis for informational purposes only, not a guaranteed trading signal or financial advice.
📊 BTC/USDC — Full Market Analysis Bitcoin (BTC/USDC) remains one of the most important trading pai
📊 BTC/USDC — Full Market Analysis#BTCUSD
#Btcusdc Bitcoin (BTC/USDC) remains one of the most important trading pairs in the crypto market. On August 28, 2026, Bitcoin is trading around the $79,000–$80,500 area, after recently reaching above $81,000.
🔥 Current Market Trend#BTCUSD i8
The short-term trend for BTC appears bullish. Bitcoin has recently reclaimed the psychological $80,000 level, showing strong buying interest and positive momentum.
📈 Key Resistance Levels
- $80,000–$81,500: Major resistance zone
- $82,000: Important breakout confirmation level
- $83,000: Potential next target after a confirmed breakout
If BTC closes strongly above $82,000 with good trading volume, further bullish momentum could develop toward $83,000–$85,000.
🛡️ Key Support Levels
- $79,000–$78,000: First important support
- $77,000: Strong support zone
- $75,000: Major support level
A break below $77,000 could weaken the short-term bullish structure, while a decisive move below $75,000 could increase selling pressure.
🐂 Bullish Scenario
If Bitcoin continues to hold above $80,000 and breaks $82,000 with strong volume, the next potential targets could be $83,000 and $85,000. However, traders should watch for profit-taking near major resistance levels.
🐻 Bearish Scenario
If BTC fails to hold above $80,000 and falls below $78,000–$77,000, a short-term correction could develop. A breakdown below $75,000 would indicate increased bearish pressure.
⚠️ Risk Management
Bitcoin can experience sudden price movements and high volatility. Traders should avoid entering trades based only on predictions and should consider stop-losses, position sizing, and confirmation from price action and volume.
📝 Conclusion
BTC/USDC currently shows a bullish short-term structure, but the $80,000–$82,000 zone remains critical. A confirmed breakout above this area could open the door toward higher targets, while rejection could lead to a pullback toward the major support levels.
This is market analysis for informational purposes only, not a guaranteed trading signal or financial advice.
#Btcusdc Bitcoin (BTC/USDC) remains one of the most important trading pairs in the crypto market. On August 28, 2026, Bitcoin is trading around the $79,000–$80,500 area, after recently reaching above $81,000.
🔥 Current Market Trend#BTCUSD i8
The short-term trend for BTC appears bullish. Bitcoin has recently reclaimed the psychological $80,000 level, showing strong buying interest and positive momentum.
📈 Key Resistance Levels
- $80,000–$81,500: Major resistance zone
- $82,000: Important breakout confirmation level
- $83,000: Potential next target after a confirmed breakout
If BTC closes strongly above $82,000 with good trading volume, further bullish momentum could develop toward $83,000–$85,000.
🛡️ Key Support Levels
- $79,000–$78,000: First important support
- $77,000: Strong support zone
- $75,000: Major support level
A break below $77,000 could weaken the short-term bullish structure, while a decisive move below $75,000 could increase selling pressure.
🐂 Bullish Scenario
If Bitcoin continues to hold above $80,000 and breaks $82,000 with strong volume, the next potential targets could be $83,000 and $85,000. However, traders should watch for profit-taking near major resistance levels.
🐻 Bearish Scenario
If BTC fails to hold above $80,000 and falls below $78,000–$77,000, a short-term correction could develop. A breakdown below $75,000 would indicate increased bearish pressure.
⚠️ Risk Management
Bitcoin can experience sudden price movements and high volatility. Traders should avoid entering trades based only on predictions and should consider stop-losses, position sizing, and confirmation from price action and volume.
📝 Conclusion
BTC/USDC currently shows a bullish short-term structure, but the $80,000–$82,000 zone remains critical. A confirmed breakout above this area could open the door toward higher targets, while rejection could lead to a pullback toward the major support levels.
This is market analysis for informational purposes only, not a guaranteed trading signal or financial advice.
36

·
--
ສັນຍານກະທິງ
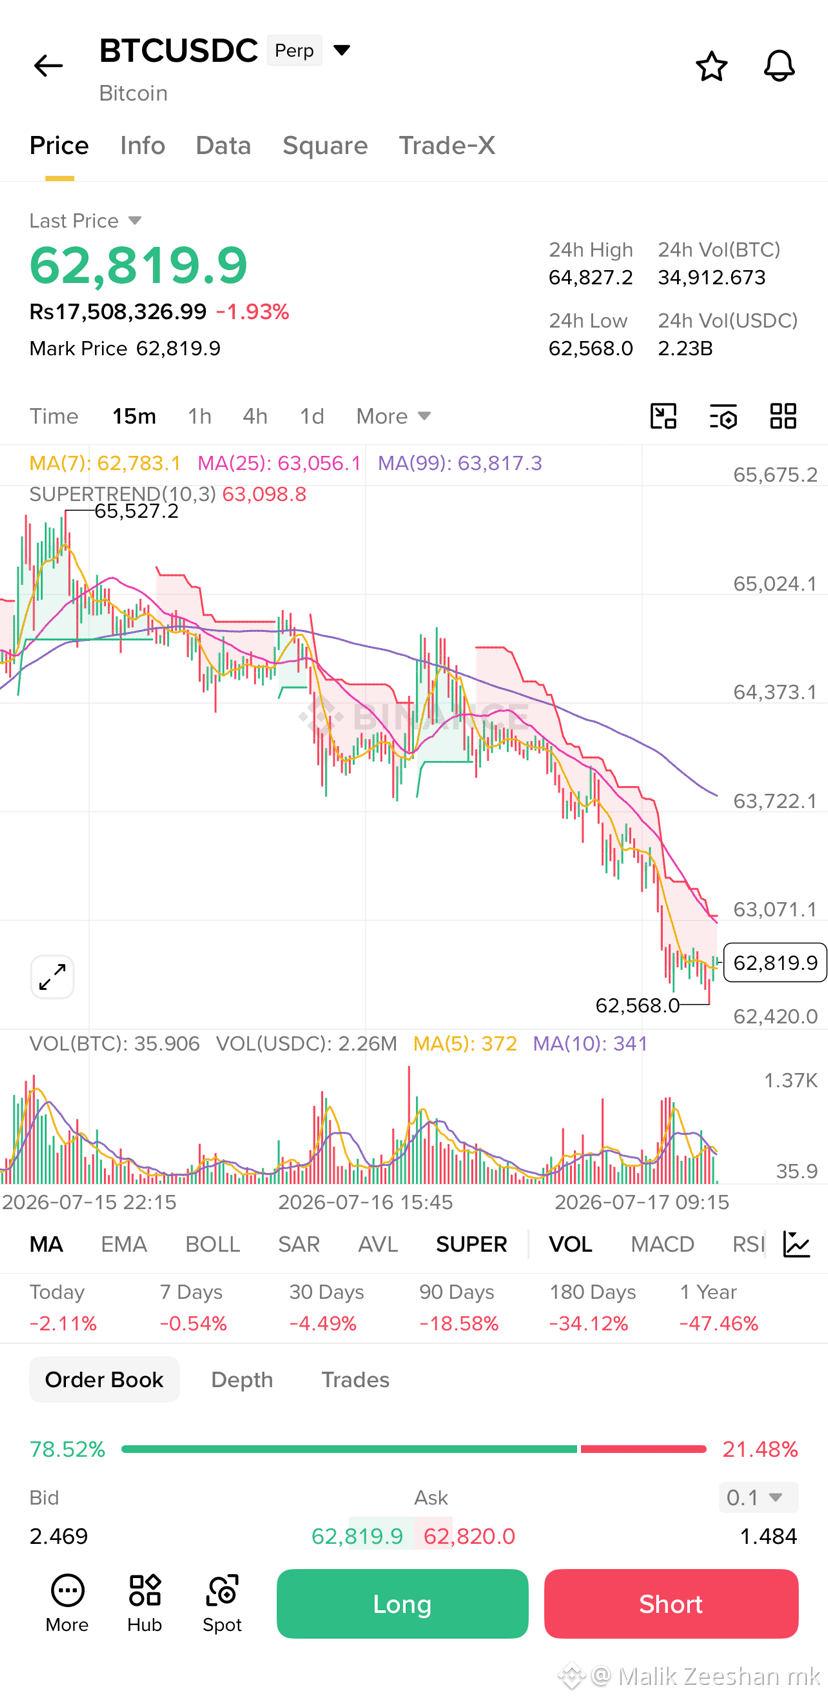
Bitcoin ($BTC ) is testing the patience of bulls today as the BTC/USDC perpetual contract slips to $62,819 (down nearly 2% in the short term). After rejection from the $65,527 local high, the bears have driven the momentum down, forcing the Supertrend to flip red with resistance currently sitting near $63,098.
What is your move here? Are you catching the falling knife, or waiting for a confirmed breakout? 👇 Let me know in the comments!
#bitcoin #BTCUSDC #TechnicalAnalysis #CryptoTrading #BinanceSquare
{spot}(BTCUSDT)
Bitcoin ($BTC ) is testing the patience of bulls today as the BTC/USDC perpetual contract slips to $62,819 (down nearly 2% in the short term). After rejection from the $65,527 local high, the bears have driven the momentum down, forcing the Supertrend to flip red with resistance currently sitting near $63,098.
What is your move here? Are you catching the falling knife, or waiting for a confirmed breakout? 👇 Let me know in the comments!
#bitcoin #BTCUSDC #TechnicalAnalysis #CryptoTrading #BinanceSquare
What is your move here? Are you catching the falling knife, or waiting for a confirmed breakout? 👇 Let me know in the comments!
#bitcoin #BTCUSDC #TechnicalAnalysis #CryptoTrading #BinanceSquare
96

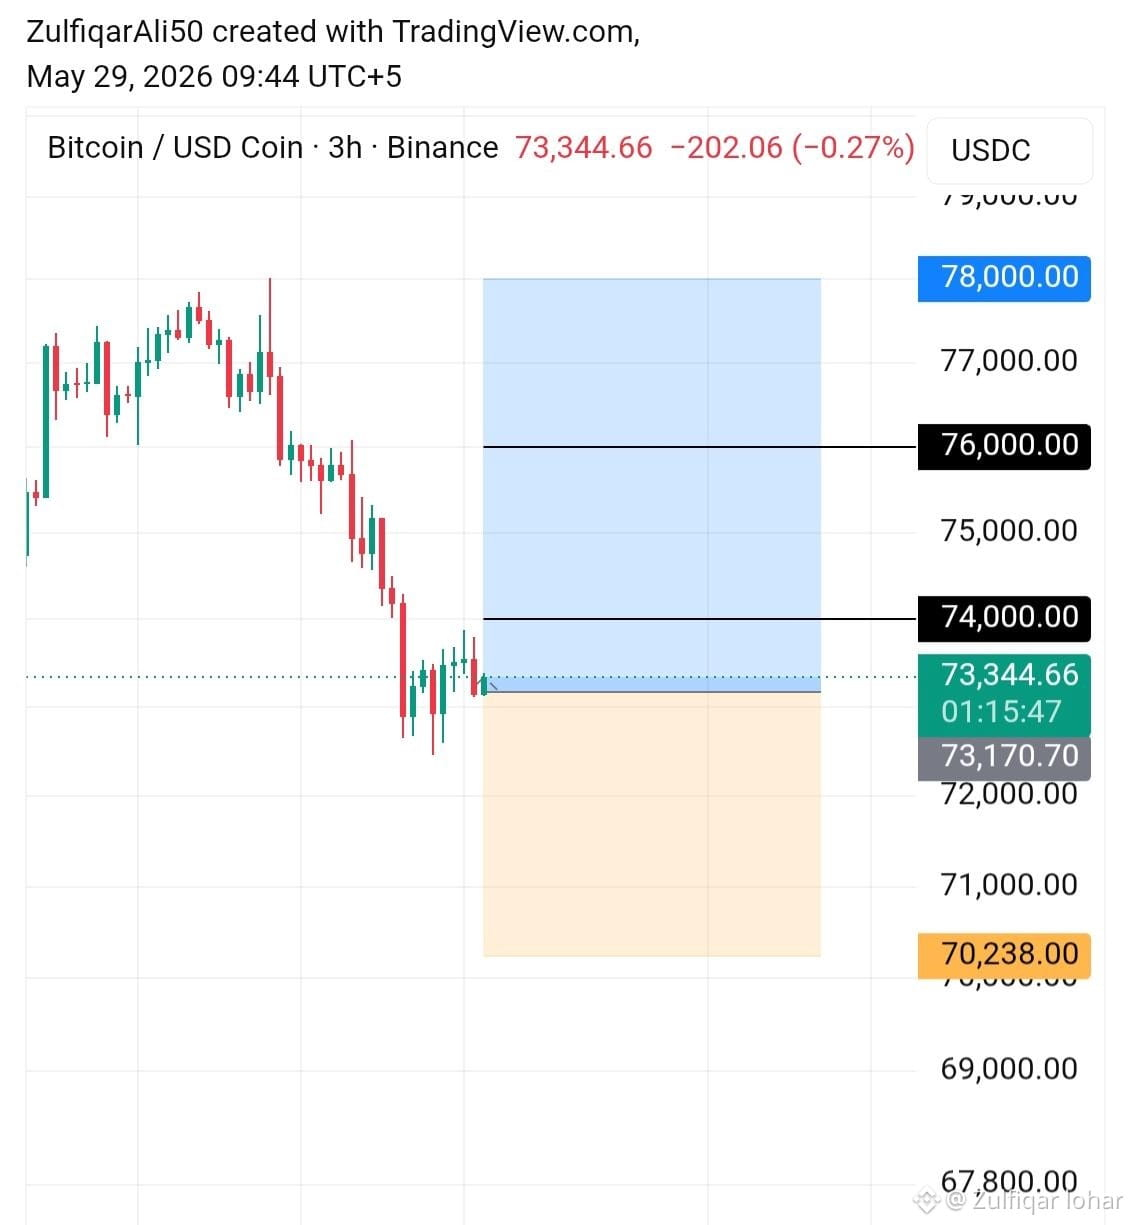
#Btcusdc
🟢LONG 20X 75X
ENTRY PRICE 73170 - 72975
{future}(BTCUSDT)
👇🏻TAKE-PROFIT
1) 74000
2) 76000
3) 78000
STOP-LOSS 70238
$BTC
#Btcusdc
🟢LONG 20X 75X
ENTRY PRICE 73170 - 72975
👇🏻TAKE-PROFIT
1) 74000
2) 76000
3) 78000
STOP-LOSS 70238
$BTC
🟢LONG 20X 75X
ENTRY PRICE 73170 - 72975
👇🏻TAKE-PROFIT
1) 74000
2) 76000
3) 78000
STOP-LOSS 70238
$BTC
1
120
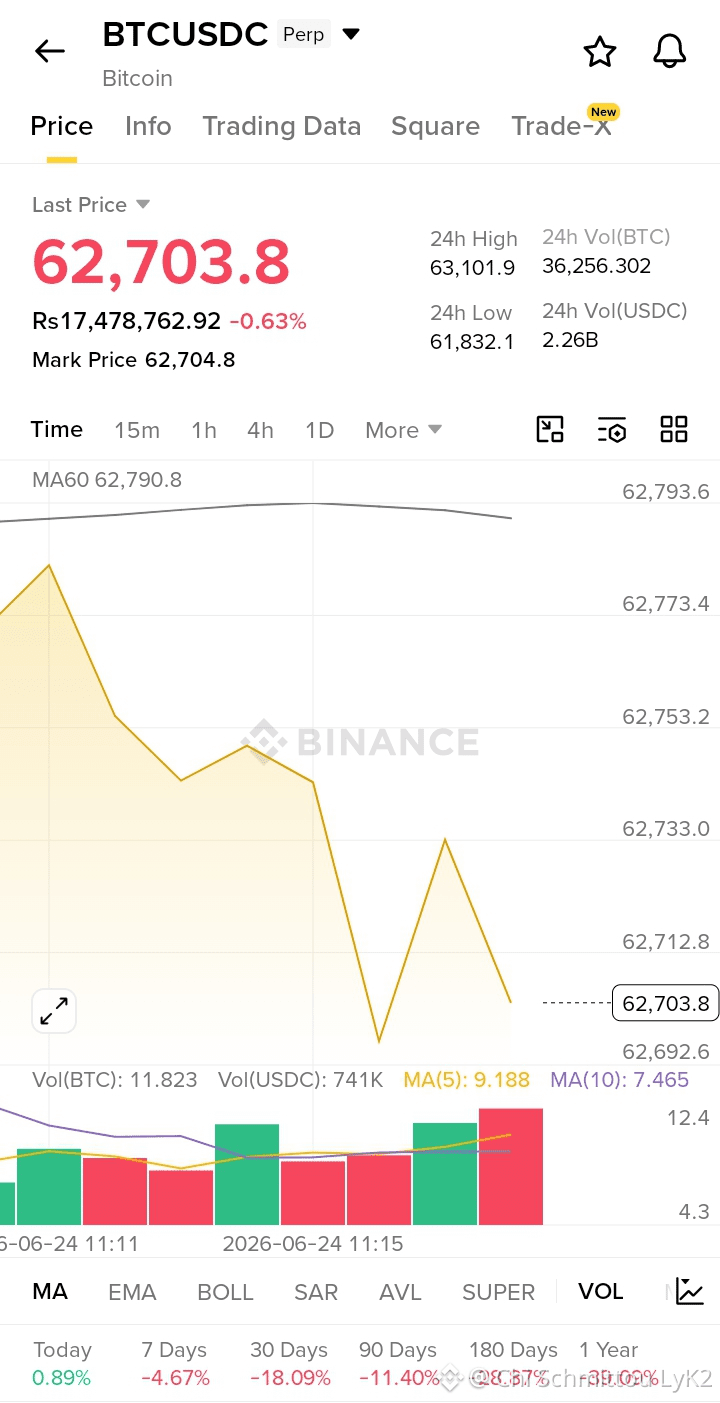
$NVDAB BTC/USDC Perp Market Update | 24 June 2026, 11:15 PKT*
*Coin*: Bitcoin $BTC Perp
*Current Price*: $62,703.8 (-0.63% 24h)
*Trend*: Bearish / MA60 Resistance
*Key Levels*
*Support*: $61,832.1 - 24h low
*Resistance*: $62,790.8 - MA60 + $63,101.9 - 24h high
*Trader Insight*:
BTC at $62,703.8, down -0.63% and capped under MA60 $62,790.8. Price wicked to $63,101.9 then rejected = sellers defending the moving average. 2.26B USDC volume on red candles = distribution, not dip-buying. MA5 9.188 > MA10 7.465 = short-term bounce fading.
Hold $61,832.1 low and we chop 61.8K-63.1K. Lose it and $60K psychological level gets tested. Flip MA60 $62,790.8 with 40K+ BTC volume and $63.1K retest opens. Until then, trend stays down.
Not financial advice. BTC dominance moves alts. Perp traders: watch funding + liquidations at range extremes.
#BTCUSDC #Bitcoin #PERPTrading #CryptoAnalysis"
$NVDAB BTC/USDC Perp Market Update | 24 June 2026, 11:15 PKT*
*Coin*: Bitcoin $BTC Perp
*Current Price*: $62,703.8 (-0.63% 24h)
*Trend*: Bearish / MA60 Resistance
*Key Levels*
*Support*: $61,832.1 - 24h low
*Resistance*: $62,790.8 - MA60 + $63,101.9 - 24h high
*Trader Insight*:
BTC at $62,703.8, down -0.63% and capped under MA60 $62,790.8. Price wicked to $63,101.9 then rejected = sellers defending the moving average. 2.26B USDC volume on red candles = distribution, not dip-buying. MA5 9.188 > MA10 7.465 = short-term bounce fading.
Hold $61,832.1 low and we chop 61.8K-63.1K. Lose it and $60K psychological level gets tested. Flip MA60 $62,790.8 with 40K+ BTC volume and $63.1K retest opens. Until then, trend stays down.
Not financial advice. BTC dominance moves alts. Perp traders: watch funding + liquidations at range extremes.
#BTCUSDC #Bitcoin #PERPTrading #CryptoAnalysis"
*Coin*: Bitcoin $BTC Perp
*Current Price*: $62,703.8 (-0.63% 24h)
*Trend*: Bearish / MA60 Resistance
*Key Levels*
*Support*: $61,832.1 - 24h low
*Resistance*: $62,790.8 - MA60 + $63,101.9 - 24h high
*Trader Insight*:
BTC at $62,703.8, down -0.63% and capped under MA60 $62,790.8. Price wicked to $63,101.9 then rejected = sellers defending the moving average. 2.26B USDC volume on red candles = distribution, not dip-buying. MA5 9.188 > MA10 7.465 = short-term bounce fading.
Hold $61,832.1 low and we chop 61.8K-63.1K. Lose it and $60K psychological level gets tested. Flip MA60 $62,790.8 with 40K+ BTC volume and $63.1K retest opens. Until then, trend stays down.
Not financial advice. BTC dominance moves alts. Perp traders: watch funding + liquidations at range extremes.
#BTCUSDC #Bitcoin #PERPTrading #CryptoAnalysis"
62
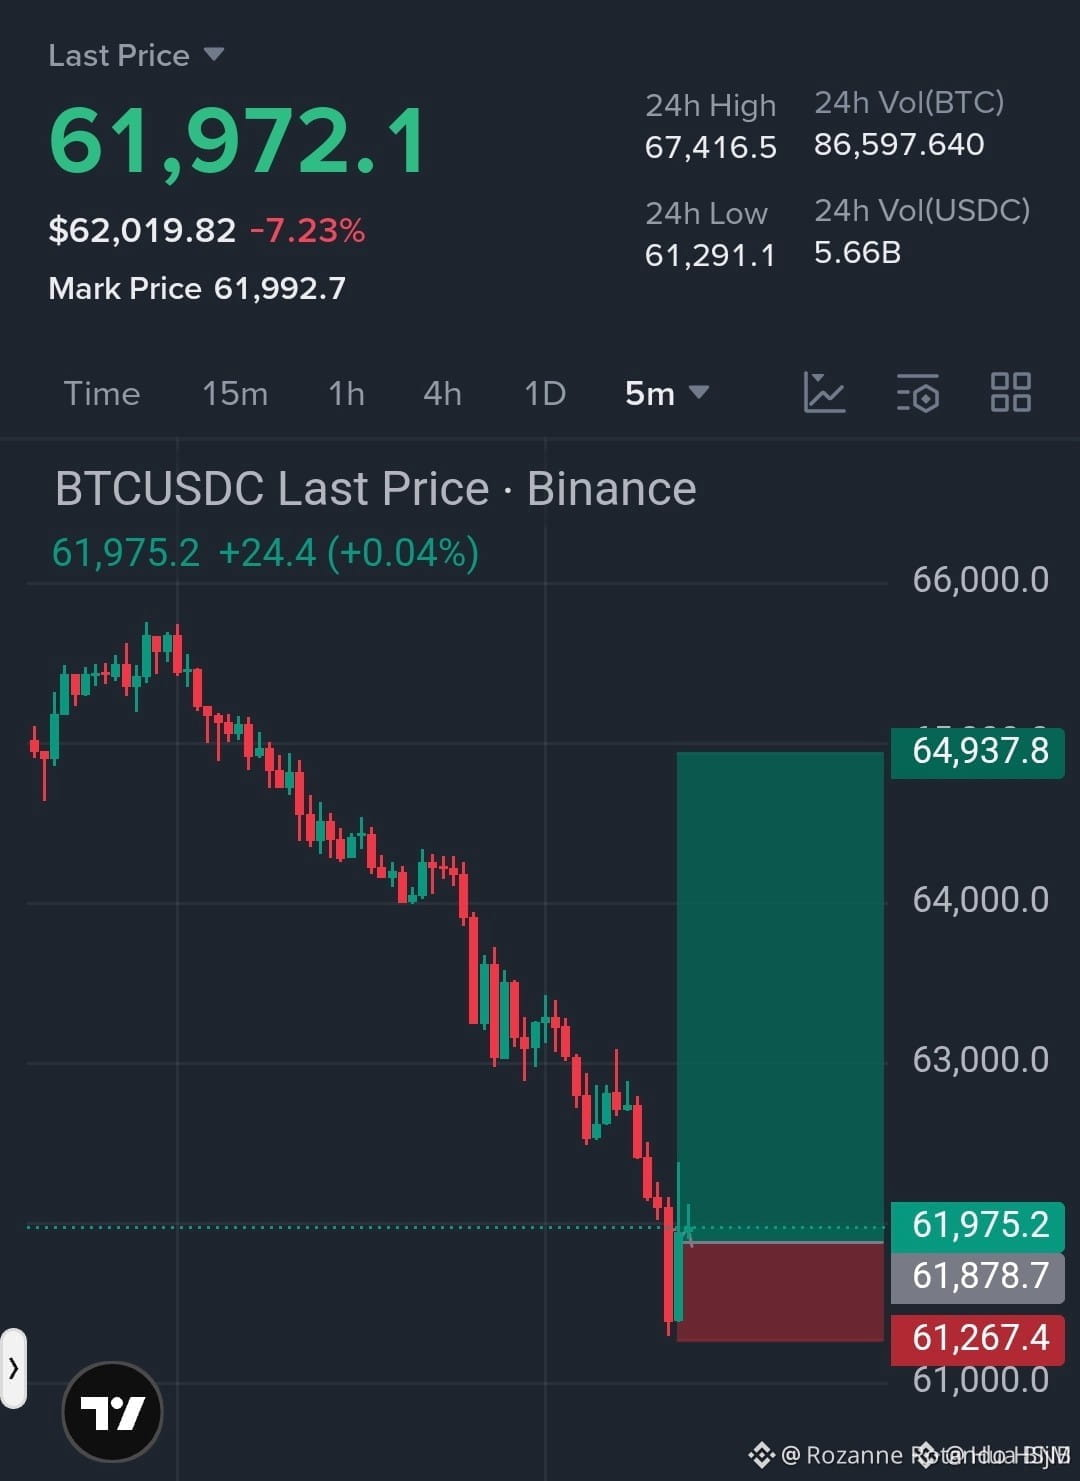
📉 Bitcoin just kissed a 24H LOW of $61,291 — but is the bounce coming?
On Binance, BTC/USDC is currently hovering at $61,972 after a -7.23% drop.
🧠 Key levels from @Hua BNB:
🔻 24H High: $67,416
🔻 24H Low: $61,291
📊 Volume: 86,597 BTC + 5.66B USDC → serious liquidity
🎯 Watch the zone: $61,800 – $61,900 holding for now.
A reclaim above $64,000 could flip sentiment.
⚡ Mark Price: $61,992 — spot and futures are nearly aligned.
👇 Is this a bear trap or more downside ahead?
Drop your chart predictions below!
Like & Repost if you’re watching this level closely.
#Binance #BTCUSDC #Bitcoin #CryptoMarket #HuaBNB
📉 Bitcoin just kissed a 24H LOW of $61,291 — but is the bounce coming?
On Binance, BTC/USDC is currently hovering at $61,972 after a -7.23% drop.
🧠 Key levels from @Hua BNB:
🔻 24H High: $67,416
🔻 24H Low: $61,291
📊 Volume: 86,597 BTC + 5.66B USDC → serious liquidity
🎯 Watch the zone: $61,800 – $61,900 holding for now.
A reclaim above $64,000 could flip sentiment.
⚡ Mark Price: $61,992 — spot and futures are nearly aligned.
👇 Is this a bear trap or more downside ahead?
Drop your chart predictions below!
Like & Repost if you’re watching this level closely.
#Binance #BTCUSDC #Bitcoin #CryptoMarket #HuaBNB
On Binance, BTC/USDC is currently hovering at $61,972 after a -7.23% drop.
🧠 Key levels from @Hua BNB:
🔻 24H High: $67,416
🔻 24H Low: $61,291
📊 Volume: 86,597 BTC + 5.66B USDC → serious liquidity
🎯 Watch the zone: $61,800 – $61,900 holding for now.
A reclaim above $64,000 could flip sentiment.
⚡ Mark Price: $61,992 — spot and futures are nearly aligned.
👇 Is this a bear trap or more downside ahead?
Drop your chart predictions below!
Like & Repost if you’re watching this level closely.
#Binance #BTCUSDC #Bitcoin #CryptoMarket #HuaBNB
1
201

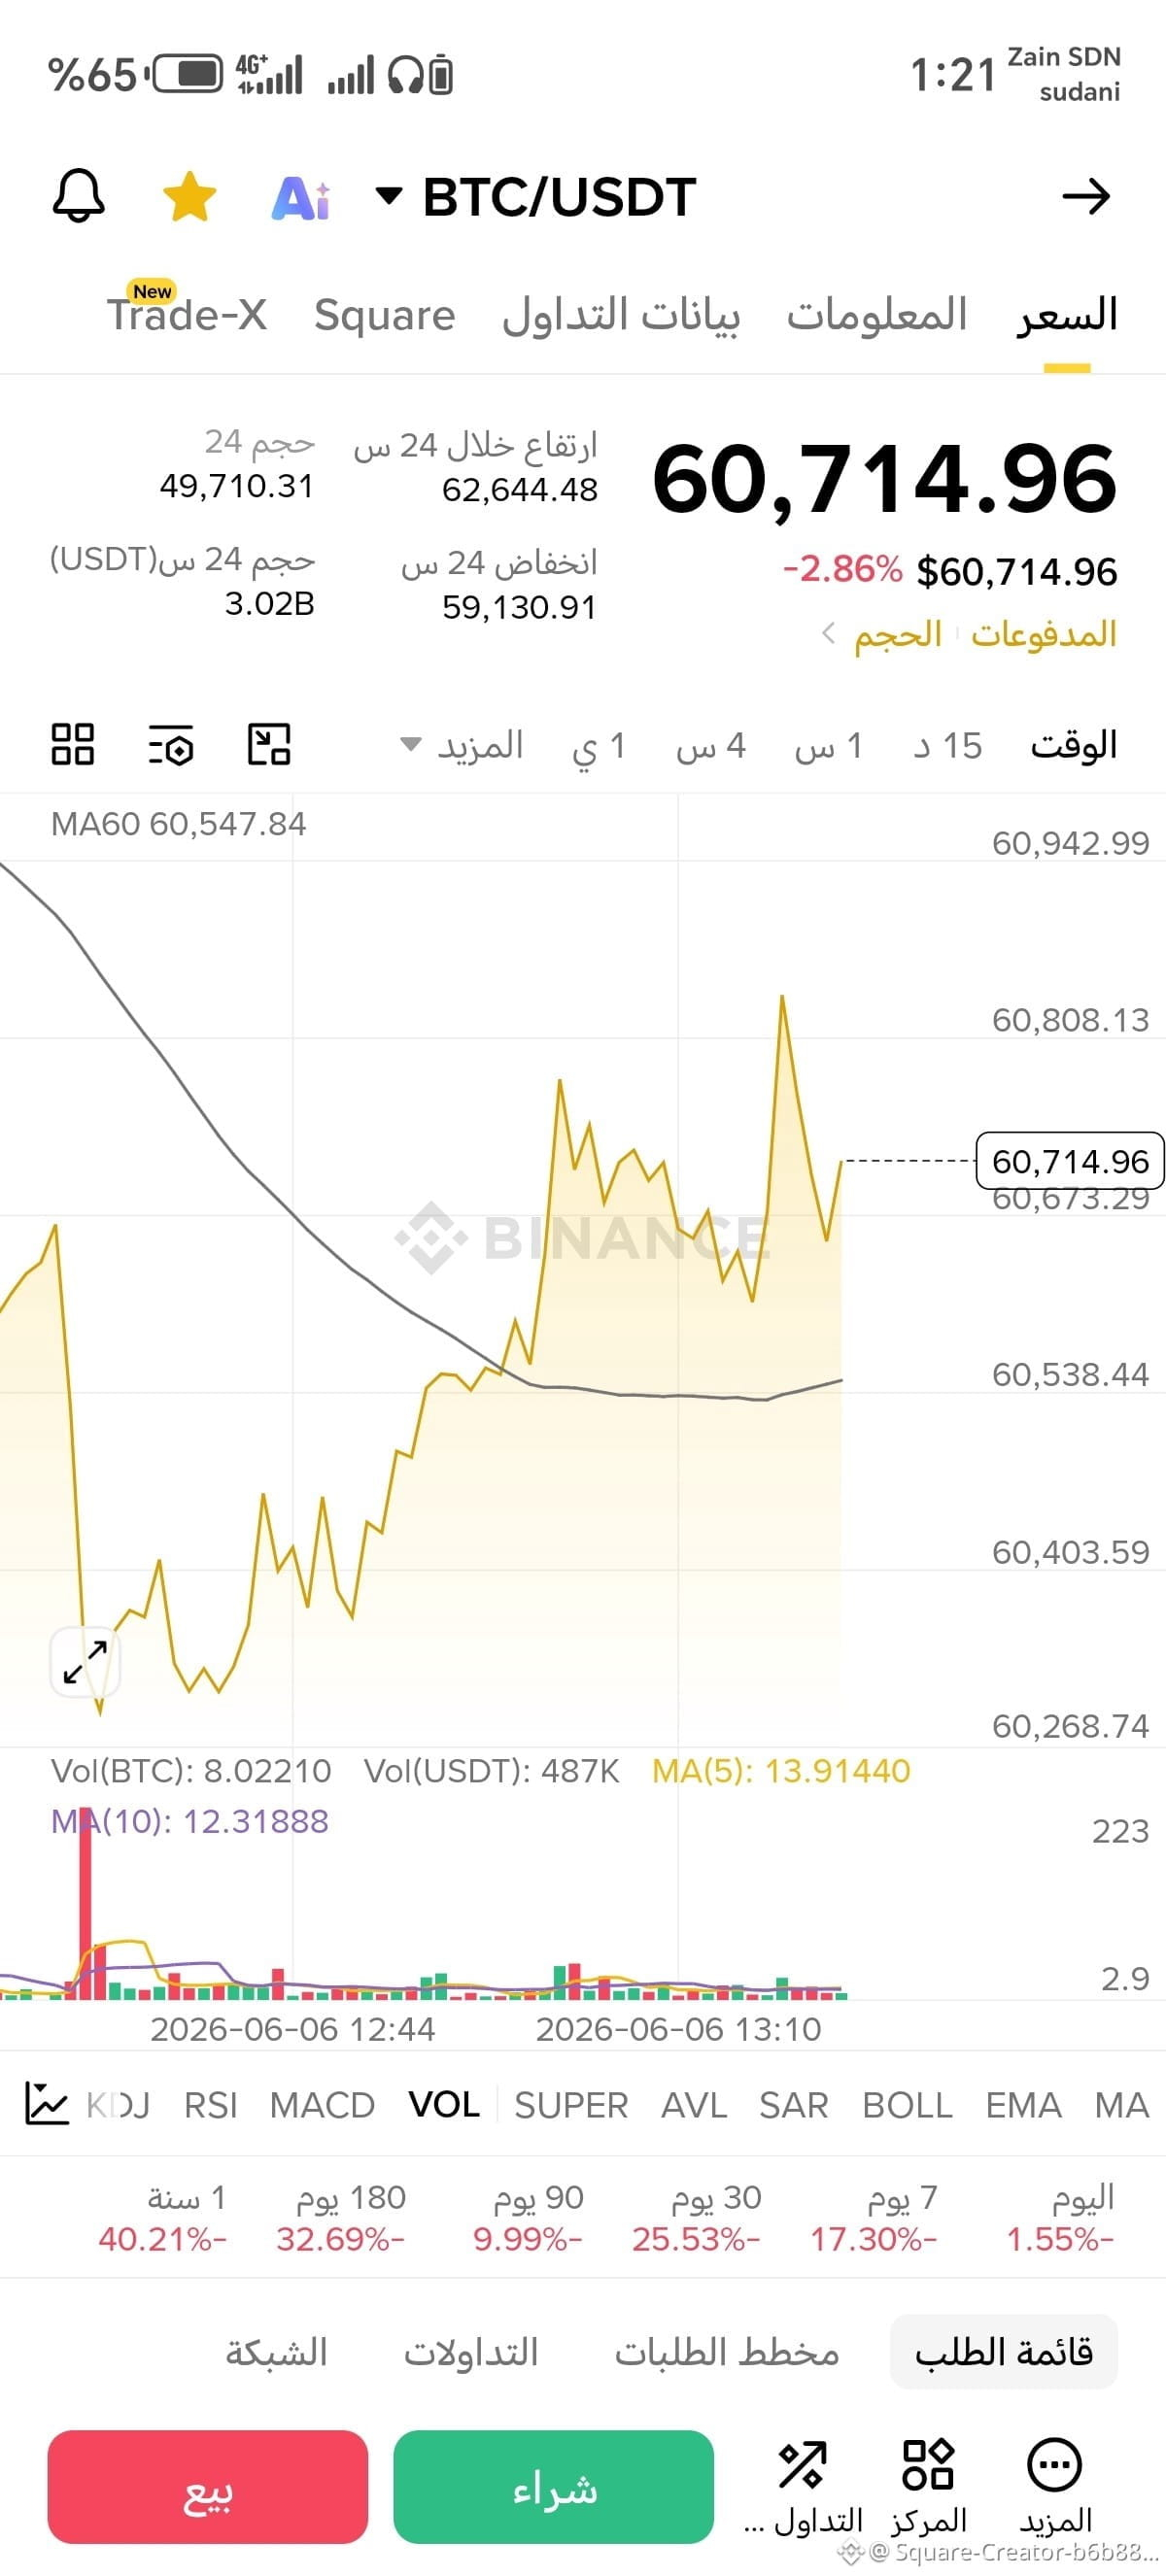
رؤية بعيدة المدى: لماذا أرى البيتكوين #BTC في طريقه نحو مستويات الـ 80,000 دولار؟ 🚀 قراءة في عمق السوق 📈🎯
بعد الارتداد الممتاز الأخير واختراق مستويات الـ 63,160 دولار بنجاح (بنسبة تجاوزت 4.14%+📊)، تشير القراءة العميقة للسيولة وتدفقات الأموال الذكية (Money Flow) إلى أن هذه مجرد البداية لموجة صعود ضخمة قادمة.
تحليلي الشخصي وتوقعاتي للفترة القادمة تتجاوز الحركات اللحظية؛ أنا أستهدف مستويات الـ 80K كهدف رئيسي للبيتكوين، وإليكم الأسباب:
1• السيطرة المستمرة للحيتان وأصحاب الطلبات الكبيرة (Large Orders) على صافي التدفق الشرائي، مما يعكس تجميعاً ذكياً طويل الأجل وليس مجرد مضاربة يومية.
2• تماسك السوق وجفافه من ضغط البيع عند مستويات الـ 60K أثبت أن القاع الحالي صلب جداً وجاهز لبناء قاعدة انطلاق تاريخية جديدة.
المستثمر الذكي وصانع المحتوى المحترف ينظر دائماً إلى الصورة الكبيرة (The Big Picture) ويتحرك مع اتجاه أموال الحيتان، فالقمم الشاهقة تُبنى بالصبر والرؤية الاستباقية الناجحة.
ما هي قراءتكم لهذا الهدف الطموح؟ هل ترون الـ 80,000 دولار مسألة وقت فقط، أم أن السوق سيمر بمحطات تصحيحية أولاً؟ شاركونا توقعاتكم في التعليقات! 👇🔥
#Binance #Bitcoin #CryptoTrading #BinanceSquare #BTCUSDC
رؤية بعيدة المدى: لماذا أرى البيتكوين #BTC في طريقه نحو مستويات الـ 80,000 دولار؟ 🚀 قراءة في عمق السوق 📈🎯
بعد الارتداد الممتاز الأخير واختراق مستويات الـ 63,160 دولار بنجاح (بنسبة تجاوزت 4.14%+📊)، تشير القراءة العميقة للسيولة وتدفقات الأموال الذكية (Money Flow) إلى أن هذه مجرد البداية لموجة صعود ضخمة قادمة.
تحليلي الشخصي وتوقعاتي للفترة القادمة تتجاوز الحركات اللحظية؛ أنا أستهدف مستويات الـ 80K كهدف رئيسي للبيتكوين، وإليكم الأسباب:
1• السيطرة المستمرة للحيتان وأصحاب الطلبات الكبيرة (Large Orders) على صافي التدفق الشرائي، مما يعكس تجميعاً ذكياً طويل الأجل وليس مجرد مضاربة يومية.
2• تماسك السوق وجفافه من ضغط البيع عند مستويات الـ 60K أثبت أن القاع الحالي صلب جداً وجاهز لبناء قاعدة انطلاق تاريخية جديدة.
المستثمر الذكي وصانع المحتوى المحترف ينظر دائماً إلى الصورة الكبيرة (The Big Picture) ويتحرك مع اتجاه أموال الحيتان، فالقمم الشاهقة تُبنى بالصبر والرؤية الاستباقية الناجحة.
ما هي قراءتكم لهذا الهدف الطموح؟ هل ترون الـ 80,000 دولار مسألة وقت فقط، أم أن السوق سيمر بمحطات تصحيحية أولاً؟ شاركونا توقعاتكم في التعليقات! 👇🔥
#Binance #Bitcoin #CryptoTrading #BinanceSquare #BTCUSDC
بعد الارتداد الممتاز الأخير واختراق مستويات الـ 63,160 دولار بنجاح (بنسبة تجاوزت 4.14%+📊)، تشير القراءة العميقة للسيولة وتدفقات الأموال الذكية (Money Flow) إلى أن هذه مجرد البداية لموجة صعود ضخمة قادمة.
تحليلي الشخصي وتوقعاتي للفترة القادمة تتجاوز الحركات اللحظية؛ أنا أستهدف مستويات الـ 80K كهدف رئيسي للبيتكوين، وإليكم الأسباب:
1• السيطرة المستمرة للحيتان وأصحاب الطلبات الكبيرة (Large Orders) على صافي التدفق الشرائي، مما يعكس تجميعاً ذكياً طويل الأجل وليس مجرد مضاربة يومية.
2• تماسك السوق وجفافه من ضغط البيع عند مستويات الـ 60K أثبت أن القاع الحالي صلب جداً وجاهز لبناء قاعدة انطلاق تاريخية جديدة.
المستثمر الذكي وصانع المحتوى المحترف ينظر دائماً إلى الصورة الكبيرة (The Big Picture) ويتحرك مع اتجاه أموال الحيتان، فالقمم الشاهقة تُبنى بالصبر والرؤية الاستباقية الناجحة.
ما هي قراءتكم لهذا الهدف الطموح؟ هل ترون الـ 80,000 دولار مسألة وقت فقط، أم أن السوق سيمر بمحطات تصحيحية أولاً؟ شاركونا توقعاتكم في التعليقات! 👇🔥
#Binance #Bitcoin #CryptoTrading #BinanceSquare #BTCUSDC
1
184

·
--
ສັນຍານໝີ
$BTC BTC/USDC Market Update 📊
BTC is trading under short-term moving averages after facing rejection near recent highs. The daily chart shows weakening momentum, with sellers maintaining control below key resistance. A strong move back above the short-term MAs would improve the outlook, but until then, caution is warranted as downside pressure remains.
Market Sentiment: Bearish 🐻
#BTCUSDC #CryptoTrends2024 #Technology #PriceShift #Bearish
$BTC BTC/USDC Market Update 📊
BTC is trading under short-term moving averages after facing rejection near recent highs. The daily chart shows weakening momentum, with sellers maintaining control below key resistance. A strong move back above the short-term MAs would improve the outlook, but until then, caution is warranted as downside pressure remains.
Market Sentiment: Bearish 🐻
#BTCUSDC #CryptoTrends2024 #Technology #PriceShift #Bearish
BTC is trading under short-term moving averages after facing rejection near recent highs. The daily chart shows weakening momentum, with sellers maintaining control below key resistance. A strong move back above the short-term MAs would improve the outlook, but until then, caution is warranted as downside pressure remains.
Market Sentiment: Bearish 🐻
#BTCUSDC #CryptoTrends2024 #Technology #PriceShift #Bearish
22

·
--
📊 BTC 4H Setup: What Could Happen Next?
$BTC is currently trading around $66.1K and showing short-term strength.
🔹 Bullish Scenario: If BTC holds above the $65.5K–$65.0K area and breaks the recent $66.3K high with strong volume, the next move could target the $66.8K–$67.5K zone.
🔻 Bearish Scenario: If BTC gets rejected near $66.3K and loses the $65.5K support area, a pullback toward $64.6K could be possible.
👀 My key levels for the next 4H: Support: $65.5K / $64.6K Resistance: $66.3K
What do you think? 🚀 BTC breakout or 4H pullback?
#bitcoin.” #Crypto_Jobs🎯 #Btcusdc #trading
📊 BTC 4H Setup: What Could Happen Next?
$BTC is currently trading around $66.1K and showing short-term strength.
🔹 Bullish Scenario: If BTC holds above the $65.5K–$65.0K area and breaks the recent $66.3K high with strong volume, the next move could target the $66.8K–$67.5K zone.
🔻 Bearish Scenario: If BTC gets rejected near $66.3K and loses the $65.5K support area, a pullback toward $64.6K could be possible.
👀 My key levels for the next 4H: Support: $65.5K / $64.6K Resistance: $66.3K
What do you think? 🚀 BTC breakout or 4H pullback?
#bitcoin.” #Crypto_Jobs🎯 #Btcusdc #trading
$BTC is currently trading around $66.1K and showing short-term strength.
🔹 Bullish Scenario: If BTC holds above the $65.5K–$65.0K area and breaks the recent $66.3K high with strong volume, the next move could target the $66.8K–$67.5K zone.
🔻 Bearish Scenario: If BTC gets rejected near $66.3K and loses the $65.5K support area, a pullback toward $64.6K could be possible.
👀 My key levels for the next 4H: Support: $65.5K / $64.6K Resistance: $66.3K
What do you think? 🚀 BTC breakout or 4H pullback?
#bitcoin.” #Crypto_Jobs🎯 #Btcusdc #trading
1
75

·
--
ສັນຍານກະທິງ
$BTC $USDC
{spot}(USDCUSDT)
is trading around $63,366, currently showing a slight -0.26% move. The order book shows noticeable selling pressure near the current price, so the next breakout or rejection could be important. I’m watching the $63K zone closely for confirmation. A strong move with volume could set the next direction. Trade carefully and manage risk. 📊
#BTC☀ #Bitcoin❗ #Crypto #TradingCommunity #Btcusdc
$BTC $USDC
is trading around $63,366, currently showing a slight -0.26% move. The order book shows noticeable selling pressure near the current price, so the next breakout or rejection could be important. I’m watching the $63K zone closely for confirmation. A strong move with volume could set the next direction. Trade carefully and manage risk. 📊
#BTC☀ #Bitcoin❗ #Crypto #TradingCommunity #Btcusdc
is trading around $63,366, currently showing a slight -0.26% move. The order book shows noticeable selling pressure near the current price, so the next breakout or rejection could be important. I’m watching the $63K zone closely for confirmation. A strong move with volume could set the next direction. Trade carefully and manage risk. 📊
#BTC☀ #Bitcoin❗ #Crypto #TradingCommunity #Btcusdc
29
·
--
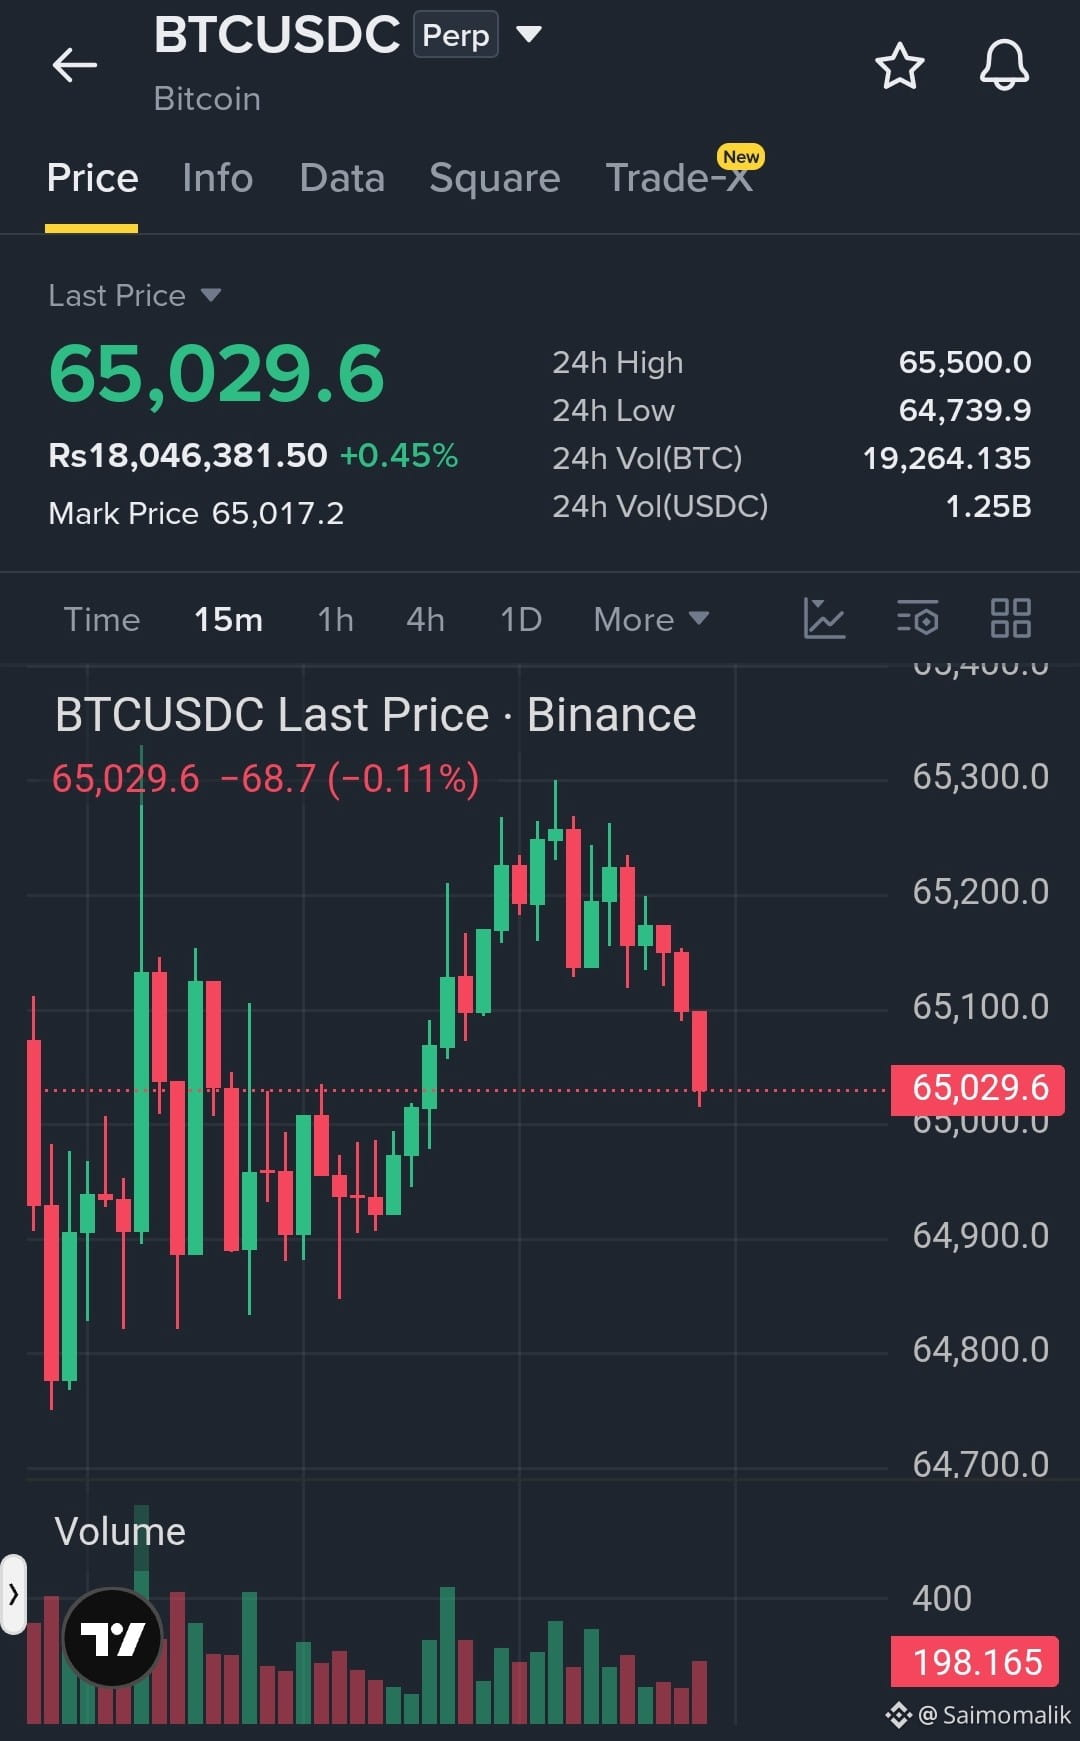
$BTC USDC — BEARISH MOMENTUM WATCH 📉
$AAPLB BTCUSDC is showing short-term weakness after pulling back from the 65,500 resistance zone. Sellers are defending the upper range, while 65,000 remains a key psychological level. A break below nearby support could open the way toward the 64,740 area.
📊 KEY LEVELS
Support: 65,000 / 64,800 / 64,740
Resistance: 65,200 / 65,500
🎯 MARKET OUTLOOK
A sustained move below 65,000 could increase selling pressure toward 64,800 and 64,740. Reclaiming 65,200 would improve the short-term structure and could bring 65,500 back into focus.
⚠️ Stay disciplined, wait for confirmation, and manage risk carefully.
#BTCUSDC #Bitcoin #TechnicalAnalysis
$BTC USDC — BEARISH MOMENTUM WATCH 📉
$AAPLB BTCUSDC is showing short-term weakness after pulling back from the 65,500 resistance zone. Sellers are defending the upper range, while 65,000 remains a key psychological level. A break below nearby support could open the way toward the 64,740 area.
📊 KEY LEVELS
Support: 65,000 / 64,800 / 64,740
Resistance: 65,200 / 65,500
🎯 MARKET OUTLOOK
A sustained move below 65,000 could increase selling pressure toward 64,800 and 64,740. Reclaiming 65,200 would improve the short-term structure and could bring 65,500 back into focus.
⚠️ Stay disciplined, wait for confirmation, and manage risk carefully.
#BTCUSDC #Bitcoin #TechnicalAnalysis
$AAPLB BTCUSDC is showing short-term weakness after pulling back from the 65,500 resistance zone. Sellers are defending the upper range, while 65,000 remains a key psychological level. A break below nearby support could open the way toward the 64,740 area.
📊 KEY LEVELS
Support: 65,000 / 64,800 / 64,740
Resistance: 65,200 / 65,500
🎯 MARKET OUTLOOK
A sustained move below 65,000 could increase selling pressure toward 64,800 and 64,740. Reclaiming 65,200 would improve the short-term structure and could bring 65,500 back into focus.
⚠️ Stay disciplined, wait for confirmation, and manage risk carefully.
#BTCUSDC #Bitcoin #TechnicalAnalysis
1
37

·
--
ສັນຍານກະທິງ
🚨 BTC JUST BROKE ABOVE $80K — BUT I’M NOT CHASING
Bitcoin has pushed above the $80,000 level after a strong move, and momentum is clearly back. 🚀
But the real question now is:
👉 Is this the start of a bigger breakout — or are we about to see a pullback?
📈 Bullish scenario:
If BTC holds above $80K and buyers continue defending the breakout, I’d expect the market to target higher levels.
📉 Bearish scenario:
If BTC quickly loses $80K, this breakout could turn into a fakeout, opening the door for a deeper retracement.
🎯 For me, the key isn’t predicting the exact top.
It’s watching how Bitcoin behaves after breaking $80K.
No FOMO. No chasing. Just watching the price action. 👀
I’ll be tracking the next move closely.
What do you think — 🚀 continuation or 🔻 pullback?
$BTC #BTC☀️ #btcusdc #BitcoinRises23.6%Weekly
{future}(BTCUSDT)
Not financial advice. Always DYOR.$
🚨 BTC JUST BROKE ABOVE $80K — BUT I’M NOT CHASING
Bitcoin has pushed above the $80,000 level after a strong move, and momentum is clearly back. 🚀
But the real question now is:
👉 Is this the start of a bigger breakout — or are we about to see a pullback?
📈 Bullish scenario:
If BTC holds above $80K and buyers continue defending the breakout, I’d expect the market to target higher levels.
📉 Bearish scenario:
If BTC quickly loses $80K, this breakout could turn into a fakeout, opening the door for a deeper retracement.
🎯 For me, the key isn’t predicting the exact top.
It’s watching how Bitcoin behaves after breaking $80K.
No FOMO. No chasing. Just watching the price action. 👀
I’ll be tracking the next move closely.
What do you think — 🚀 continuation or 🔻 pullback?
$BTC #BTC☀️ #btcusdc #BitcoinRises23.6%Weekly
Not financial advice. Always DYOR.$
Bitcoin has pushed above the $80,000 level after a strong move, and momentum is clearly back. 🚀
But the real question now is:
👉 Is this the start of a bigger breakout — or are we about to see a pullback?
📈 Bullish scenario:
If BTC holds above $80K and buyers continue defending the breakout, I’d expect the market to target higher levels.
📉 Bearish scenario:
If BTC quickly loses $80K, this breakout could turn into a fakeout, opening the door for a deeper retracement.
🎯 For me, the key isn’t predicting the exact top.
It’s watching how Bitcoin behaves after breaking $80K.
No FOMO. No chasing. Just watching the price action. 👀
I’ll be tracking the next move closely.
What do you think — 🚀 continuation or 🔻 pullback?
$BTC #BTC☀️ #btcusdc #BitcoinRises23.6%Weekly
Not financial advice. Always DYOR.$
100

·
--
ສັນຍານກະທິງ
🔥 Is $BTC
{future}(BTCUSDT)
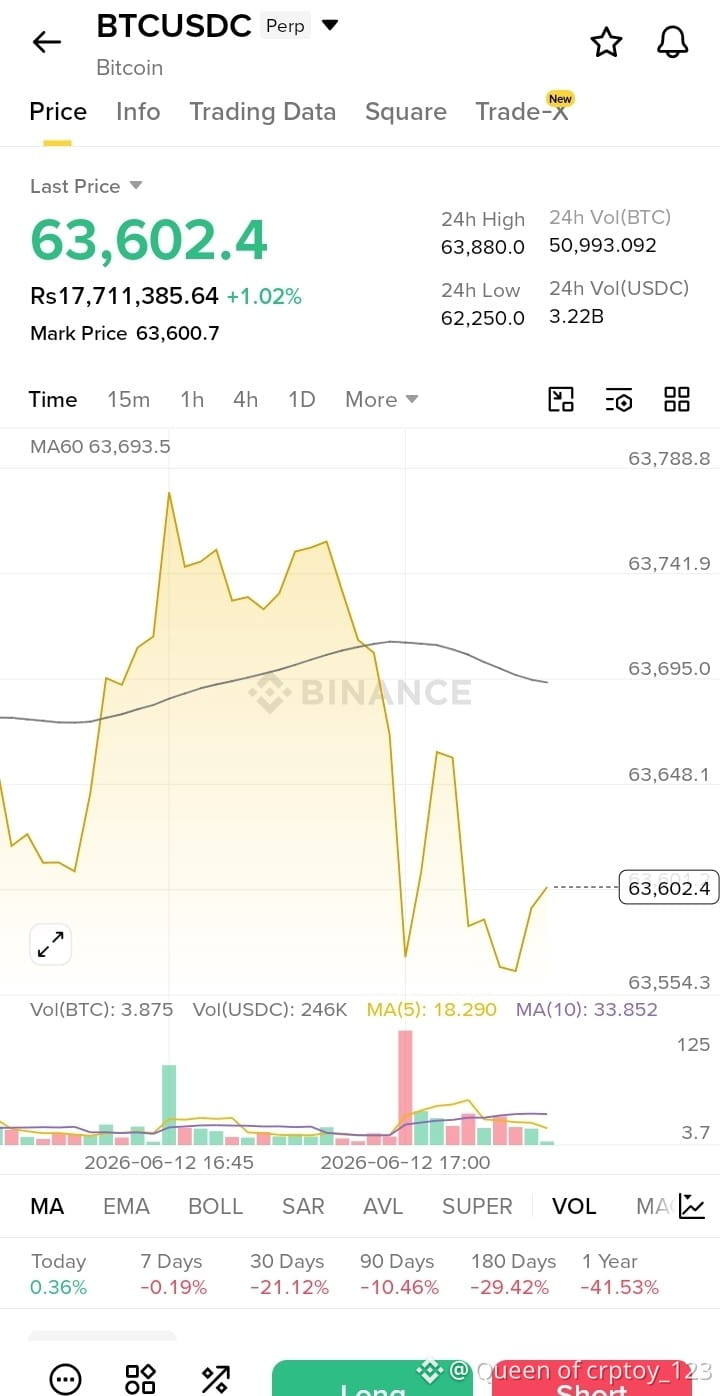
Gearing Up for a Strong Breakout Past $63.6K? 📈
The BTCUSDC perpetual chart shows Bitcoin successfully absorbing selling pressure and forming a solid local double-bottom structure around the $63,554 level. With the price showing an upward bias (+1.02%) and holding tightly, a move to clear overhead resistance is brewing.
Here is the strategic setup:
🔹 Entry Price: Around $63,602.4
🎯 Take Profit 1 (TP1): $63,690.0
🎯 Take Profit 2 (TP2): $63,780.0
🎯 Take Profit 3 (TP3): $63,880.0
🛑 Stop Loss (SL): $63,450.0
💡 Reason for Trade:
$BTC has printed a bullish local recovery structure right above its immediate intraday low. It is currently trading just below the MA60 line ($63,693.5). Reclaiming this MA60 level will serve as the primary trigger to fuel a momentum run toward the 24-hour high of $63,880. Volume indicators show a decrease in selling pressure, favoring a long continuation play.
#Crypto #Trading #Bitcoin #BTCUSDC
🔥 Is $BTC
Gearing Up for a Strong Breakout Past $63.6K? 📈
The BTCUSDC perpetual chart shows Bitcoin successfully absorbing selling pressure and forming a solid local double-bottom structure around the $63,554 level. With the price showing an upward bias (+1.02%) and holding tightly, a move to clear overhead resistance is brewing.
Here is the strategic setup:
🔹 Entry Price: Around $63,602.4
🎯 Take Profit 1 (TP1): $63,690.0
🎯 Take Profit 2 (TP2): $63,780.0
🎯 Take Profit 3 (TP3): $63,880.0
🛑 Stop Loss (SL): $63,450.0
💡 Reason for Trade:
$BTC has printed a bullish local recovery structure right above its immediate intraday low. It is currently trading just below the MA60 line ($63,693.5). Reclaiming this MA60 level will serve as the primary trigger to fuel a momentum run toward the 24-hour high of $63,880. Volume indicators show a decrease in selling pressure, favoring a long continuation play.
#Crypto #Trading #Bitcoin #BTCUSDC
Gearing Up for a Strong Breakout Past $63.6K? 📈
The BTCUSDC perpetual chart shows Bitcoin successfully absorbing selling pressure and forming a solid local double-bottom structure around the $63,554 level. With the price showing an upward bias (+1.02%) and holding tightly, a move to clear overhead resistance is brewing.
Here is the strategic setup:
🔹 Entry Price: Around $63,602.4
🎯 Take Profit 1 (TP1): $63,690.0
🎯 Take Profit 2 (TP2): $63,780.0
🎯 Take Profit 3 (TP3): $63,880.0
🛑 Stop Loss (SL): $63,450.0
💡 Reason for Trade:
$BTC has printed a bullish local recovery structure right above its immediate intraday low. It is currently trading just below the MA60 line ($63,693.5). Reclaiming this MA60 level will serve as the primary trigger to fuel a momentum run toward the 24-hour high of $63,880. Volume indicators show a decrease in selling pressure, favoring a long continuation play.
#Crypto #Trading #Bitcoin #BTCUSDC
35
التحليل الرقمي يثبت صحته مجدداً: هكذا تتحرك السيولة وتصعد القمم! 📊 قراءة استباقية ناجحة 🚀🎯
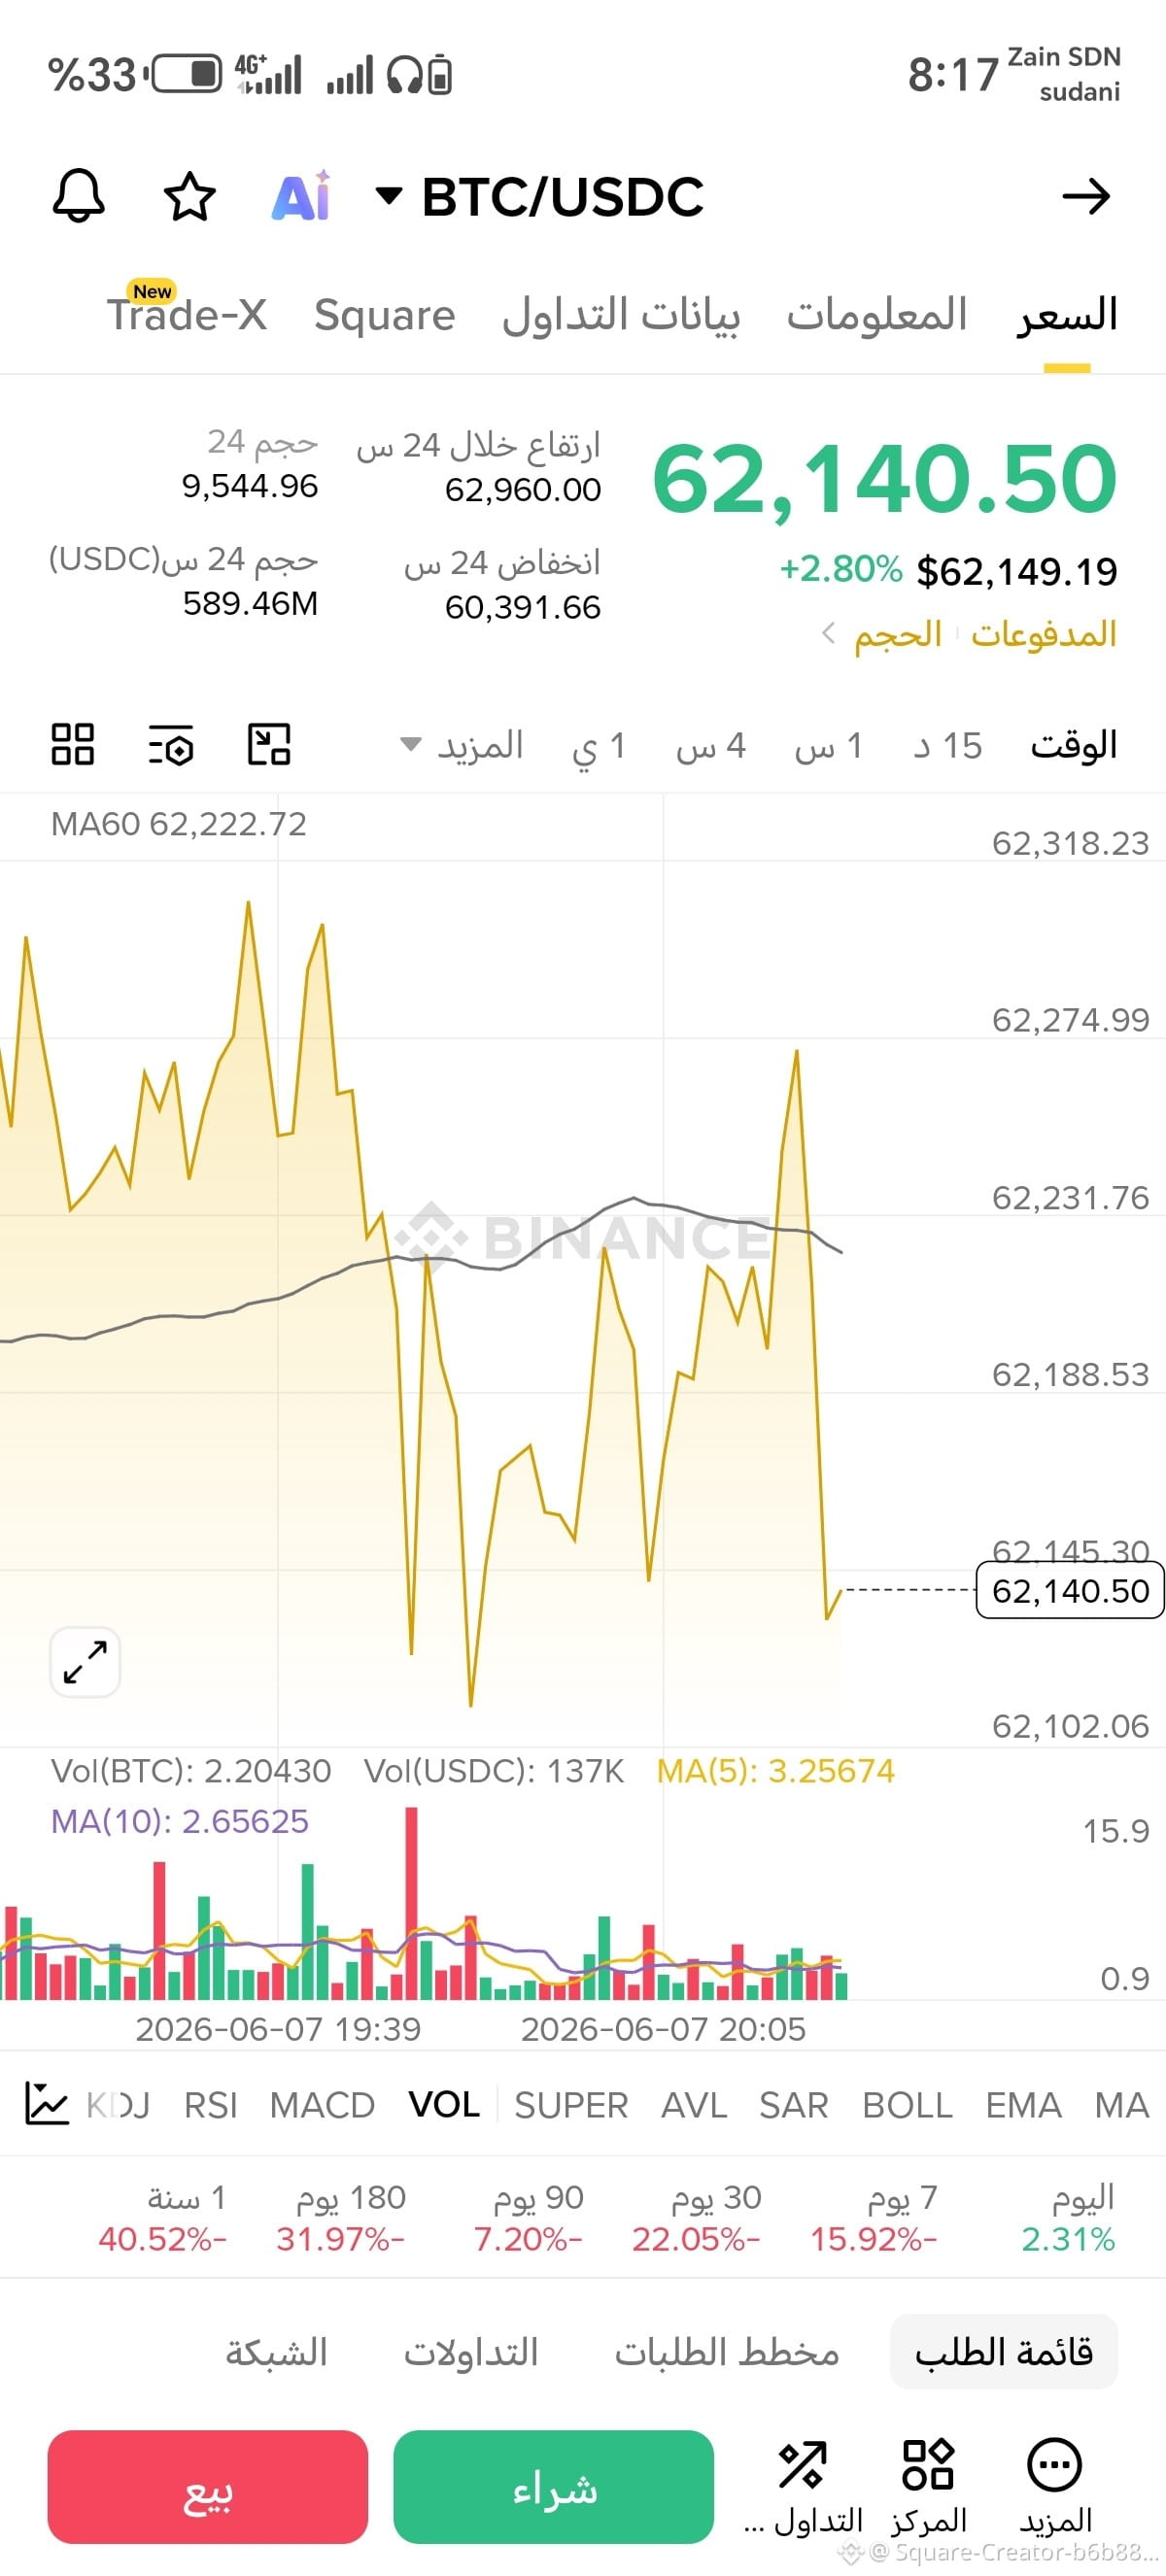
في منشورنا السابق، عندما كان البيتكوين يمر بمرحلة تصحيح وضغط بيعي، أكدنا بثقة أن مناطق التماسك والدعم هي الفرصة الذهبية التي ينتظرها كبار المتداولين للتجميع الذكي.
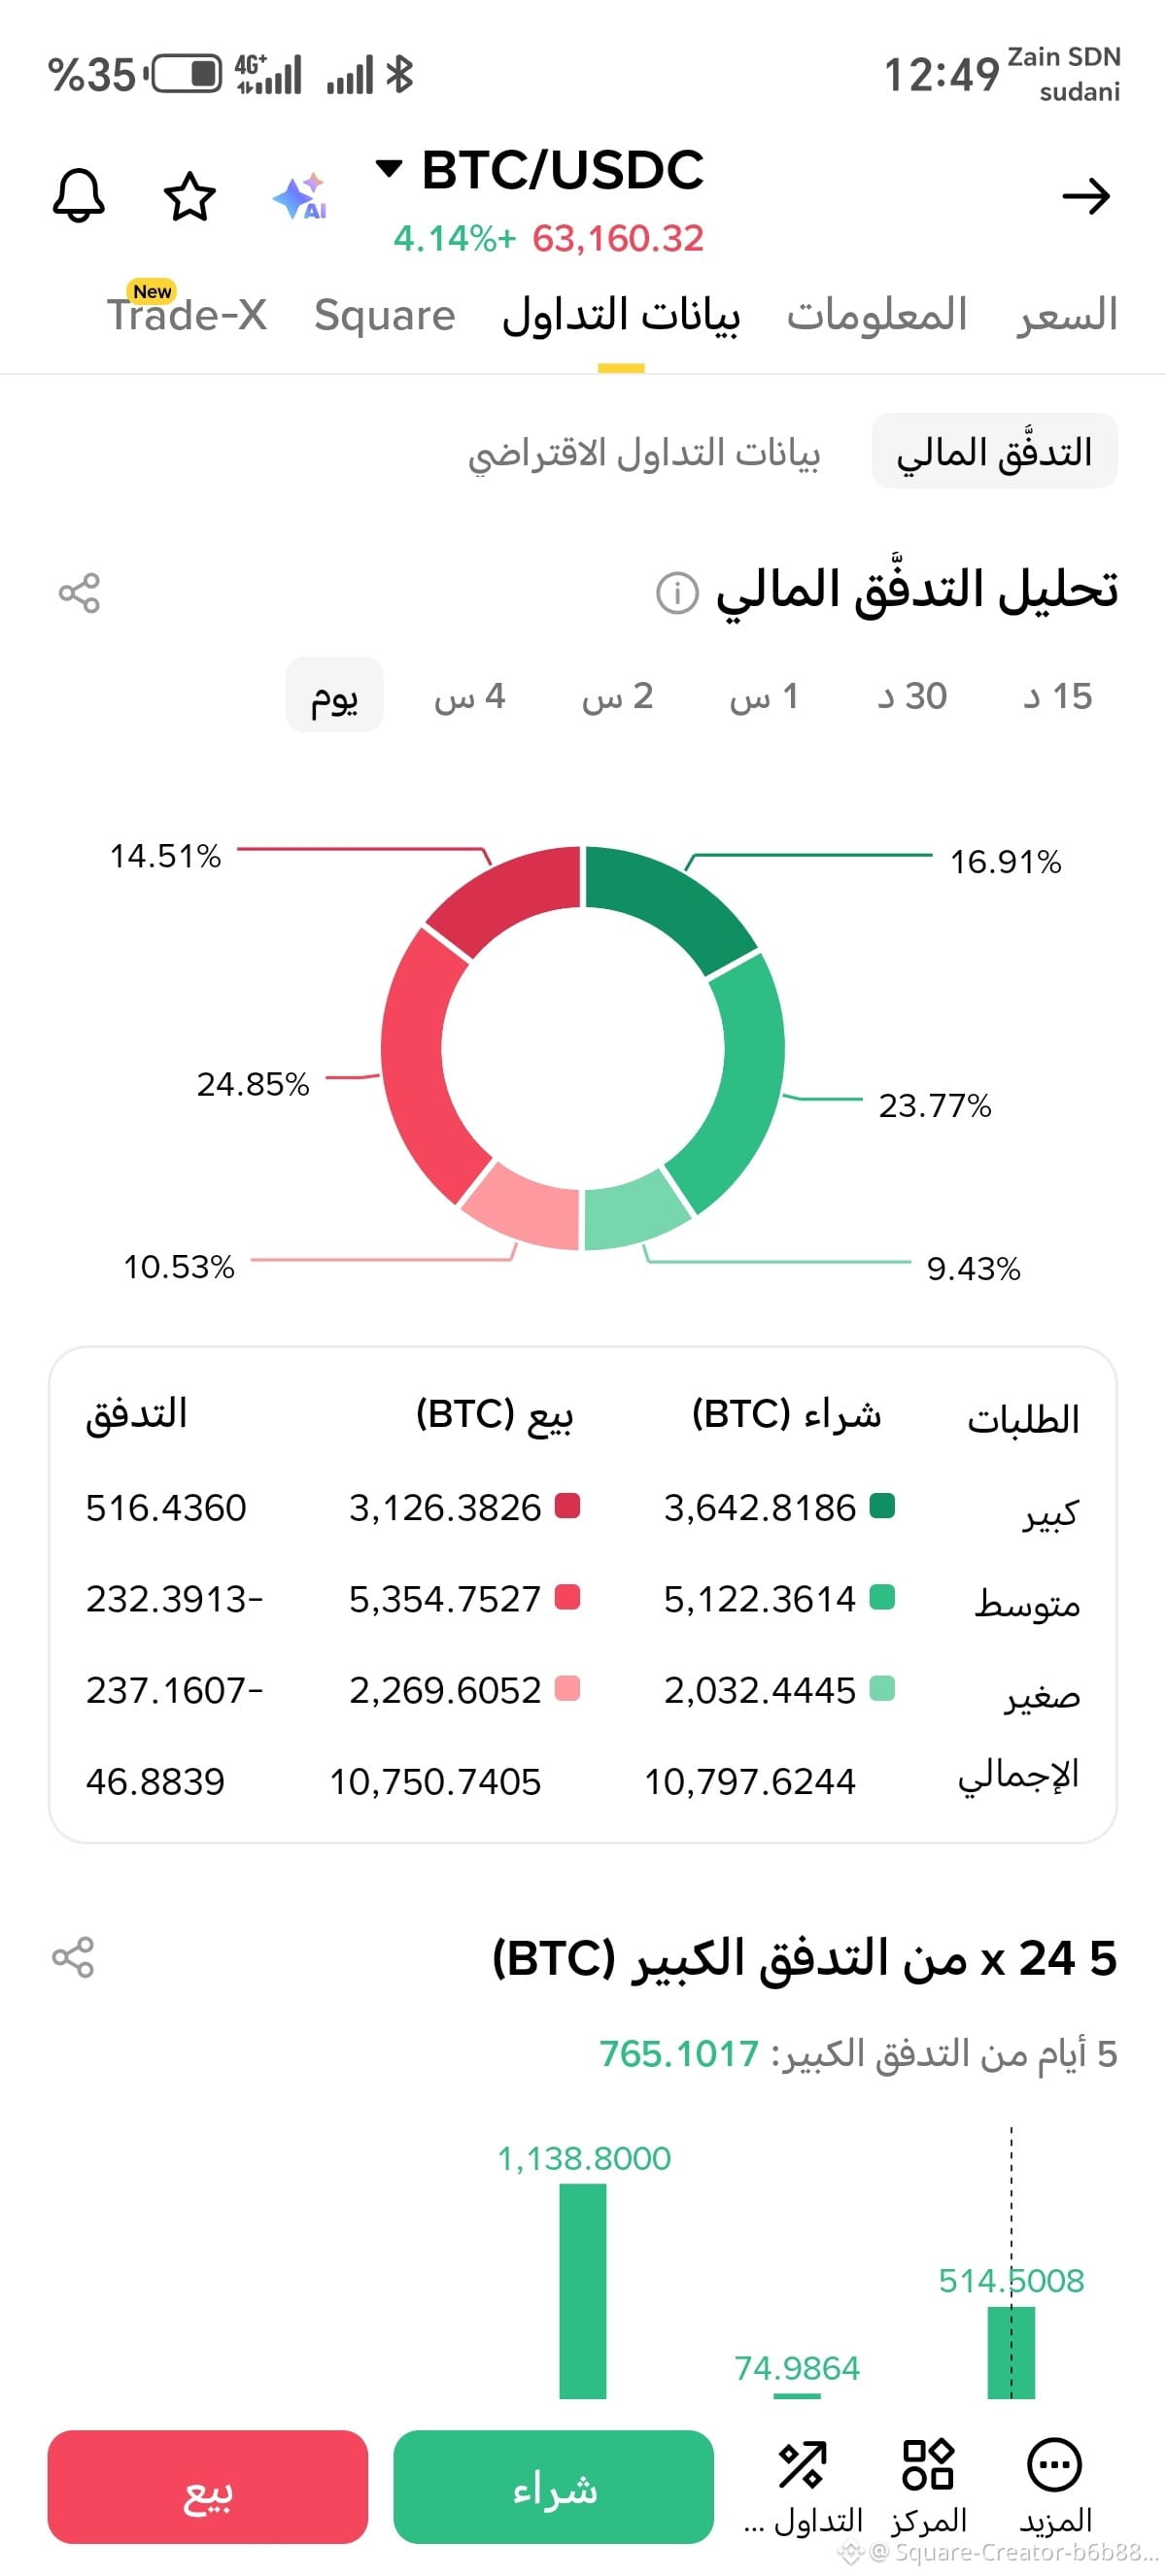
واليوم، تثبت الشاشة دقة قراءتنا للمؤشرات؛ حيث يرتد البيتكوين #BTC بقوة ليتجاوز مستويات 62,224 دولار محققاً ارتفاعاً بنسبة 2.67%+ 📈. الأهم من حركة السعر هو ما يحدث خلف الكواليس في "تحليل التدفق المالي":
• التدفق الإجمالي تحول بالكامل إلى اللون الأخضر الإيجابي (صافي 279.13) ⚖️.
• الحيتان وأصحاب الطلبات الكبيرة (Large Orders) يقودون الزخم الآن بدخول سيولة شرائية ضخمة تجاوزت الـ 514 نقطة في الصافي 🐳.
هذا هو الفارق الحقيقي بين التداول العاطفي وبين صناعة المحتوى القائمة على التحليل الفني ومراقبة حركة أموال الحيتان (Money Flow). صانع المحتوى المحترف يقرأ المؤشرات قبل أن تنعكس على الشارت.
توقعاتنا القادمة تشير إلى استمرار الزخم طالما استقرت السيولة الكبيرة في الجانب الأخضر. ما هي نظرتكم الفنية للمستويات القادمة؟ هل نحن في الطريق لاختبار المقاومة التالية؟ شاركونا في التعليقات!👇
#Binance #Bitcoin #CryptoTrading #BinanceSquare #BTCUSDC
التحليل الرقمي يثبت صحته مجدداً: هكذا تتحرك السيولة وتصعد القمم! 📊 قراءة استباقية ناجحة 🚀🎯
في منشورنا السابق، عندما كان البيتكوين يمر بمرحلة تصحيح وضغط بيعي، أكدنا بثقة أن مناطق التماسك والدعم هي الفرصة الذهبية التي ينتظرها كبار المتداولين للتجميع الذكي.
واليوم، تثبت الشاشة دقة قراءتنا للمؤشرات؛ حيث يرتد البيتكوين #BTC بقوة ليتجاوز مستويات 62,224 دولار محققاً ارتفاعاً بنسبة 2.67%+ 📈. الأهم من حركة السعر هو ما يحدث خلف الكواليس في "تحليل التدفق المالي":
• التدفق الإجمالي تحول بالكامل إلى اللون الأخضر الإيجابي (صافي 279.13) ⚖️.
• الحيتان وأصحاب الطلبات الكبيرة (Large Orders) يقودون الزخم الآن بدخول سيولة شرائية ضخمة تجاوزت الـ 514 نقطة في الصافي 🐳.
هذا هو الفارق الحقيقي بين التداول العاطفي وبين صناعة المحتوى القائمة على التحليل الفني ومراقبة حركة أموال الحيتان (Money Flow). صانع المحتوى المحترف يقرأ المؤشرات قبل أن تنعكس على الشارت.
توقعاتنا القادمة تشير إلى استمرار الزخم طالما استقرت السيولة الكبيرة في الجانب الأخضر. ما هي نظرتكم الفنية للمستويات القادمة؟ هل نحن في الطريق لاختبار المقاومة التالية؟ شاركونا في التعليقات!👇
#Binance #Bitcoin #CryptoTrading #BinanceSquare #BTCUSDC
في منشورنا السابق، عندما كان البيتكوين يمر بمرحلة تصحيح وضغط بيعي، أكدنا بثقة أن مناطق التماسك والدعم هي الفرصة الذهبية التي ينتظرها كبار المتداولين للتجميع الذكي.
واليوم، تثبت الشاشة دقة قراءتنا للمؤشرات؛ حيث يرتد البيتكوين #BTC بقوة ليتجاوز مستويات 62,224 دولار محققاً ارتفاعاً بنسبة 2.67%+ 📈. الأهم من حركة السعر هو ما يحدث خلف الكواليس في "تحليل التدفق المالي":
• التدفق الإجمالي تحول بالكامل إلى اللون الأخضر الإيجابي (صافي 279.13) ⚖️.
• الحيتان وأصحاب الطلبات الكبيرة (Large Orders) يقودون الزخم الآن بدخول سيولة شرائية ضخمة تجاوزت الـ 514 نقطة في الصافي 🐳.
هذا هو الفارق الحقيقي بين التداول العاطفي وبين صناعة المحتوى القائمة على التحليل الفني ومراقبة حركة أموال الحيتان (Money Flow). صانع المحتوى المحترف يقرأ المؤشرات قبل أن تنعكس على الشارت.
توقعاتنا القادمة تشير إلى استمرار الزخم طالما استقرت السيولة الكبيرة في الجانب الأخضر. ما هي نظرتكم الفنية للمستويات القادمة؟ هل نحن في الطريق لاختبار المقاومة التالية؟ شاركونا في التعليقات!👇
#Binance #Bitcoin #CryptoTrading #BinanceSquare #BTCUSDC
1
153
ເຂົ້າສູ່ລະບົບເພື່ອສຳຫຼວດເນື້ອຫາເພີ່ມເຕີມ
ເຂົ້າຮ່ວມກຸ່ມຜູ້ໃຊ້ຄຣິບໂຕທົ່ວໂລກໃນ Binance Square.
⚡️ ໄດ້ຮັບຂໍ້ມູນຫຼ້າສຸດ ແລະ ທີ່ມີປະໂຫຍດກ່ຽວກັບຄຣິບໂຕ.
💬 ໄດ້ຮັບຄວາມໄວ້ວາງໃຈຈາກຕະຫຼາດແລກປ່ຽນຄຣິບໂຕທີ່ໃຫຍ່ທີ່ສຸດໃນໂລກ.
👍 ຄົ້ນຫາຂໍ້ມູນເຊີງເລິກທີ່ແທ້ຈາກນັກສ້າງທີ່ໄດ້ຮັບການຢືນຢັນ.
ອີເມວ / ເບີໂທລະສັບ
ຫົວຂໍ້ທີ່ກໍາລັງນິຍົມ
1
#UKFCAWinsCourtOrderToRecover851400Pounds
15,427 views
602 ກຳລັງສົນທະນາ
2
#ChainlinkLaunchesCCIP2WithEnterpriseVerification
29,592 views
811 ກຳລັງສົນທະນາ
3
#GoldFallsTo$4144
11,004 views
136 ກຳລັງສົນທະນາ
4
#QNTFallsOver40%FromMorningHigh
68,840 views
1,235 ກຳລັງສົນທະນາ
5
#USDTAdds845900HoldersInPast7Days
10,403 views
348 ກຳລັງສົນທະນາ
6
#KospiFalls2.7%SamsungSKHynixDropOver5%
19,845 views
525 ກຳລັງສົນທະນາ
7
#BitgetCEOConfirms$388MStolenInHack
4,662 views
41 ກຳລັງສົນທະນາ
8
#BTCFallsBelow$83000
27,095 views
160 ກຳລັງສົນທະນາ
9
#BitgetDetailsSecurityIncidentTimeline
37,480 views
672 ກຳລັງສົນທະນາ
10
#BitcoinSpotETFs$2.39BWeeklyNetInflow
12,526 views
47 ກຳລັງສົນທະນາ