

#ethereumclassic
ethereumclassic
302,078 ຄັ້ງທີ່ເບິ່ງ
1,027 ກຳລັງສົນທະນາ
ມາແຮງ
ຫຼ້າສຸດ

·
--
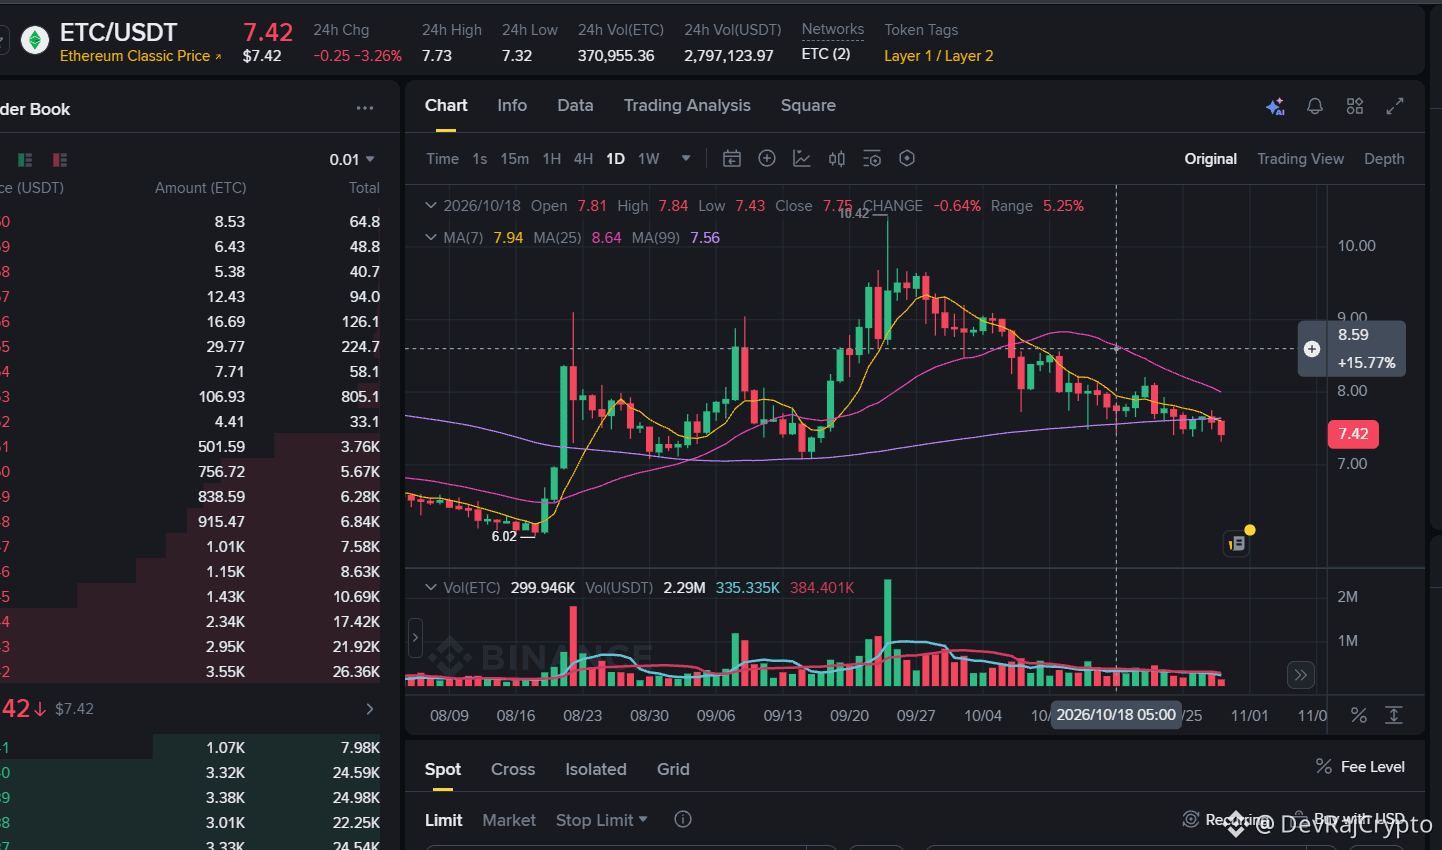
Ethereum Classic is trading near $7.42. The more important question is whether buyers can stop the trend of lower prices.
ETC has given back a significant portion of its September rally. The daily chart now shows a clear shift from aggressive buying to persistent selling pressure.
Here's what stands out to me.
📉 1. The trend has changed.
After reaching above $10 in September, ETC entered a sustained decline. Recent rebounds have struggled to regain the ground lost, suggesting buyers have yet to establish control.
📊 2. The $7.30 area is the immediate level to watch.
ETC's reported 24-hour low is $7.32. If buyers defend this zone, the market could attempt a short-term recovery.
But if price breaks below it decisively, the next area to watch is around $7.00, a previous chart region where price consolidated.
🟢 3. Recovery needs confirmation.
The $7.70 to $8.00 region is the first resistance zone I'm watching. Reclaiming it would be an initial improvement, but one green candle wouldn't confirm a trend reversal.
My biggest observation?
A falling price doesn't automatically make an asset undervalued.
ETC needs more than a bounce. Buyers need to demonstrate sustained demand, stronger price structure and the ability to reclaim resistance.
Until that happens, I would treat any recovery as a potential relief rally rather than assume a new uptrend has begun.
The levels that matter next:
• Support: $7.30, then around $7.00
• Resistance: $7.70 to $8.00
• Current price in the screenshot: $7.42
These are chart-based reference zones, not guaranteed turning points.
What's your view on $ETC? Is this a potential accumulation zone, or does the chart suggest more downside before a durable recovery?
#EthereumClassic #CryptoAnalysis #BinanceSquare
Technical analysis based on the Binance ETC/USDT chart screenshot dated October 29, 2026. Price levels can change quickly. This is market commentary, not financial advice.
$ETC
{spot}(ETCUSDT)
Ethereum Classic is trading near $7.42. The more important question is whether buyers can stop the trend of lower prices.
ETC has given back a significant portion of its September rally. The daily chart now shows a clear shift from aggressive buying to persistent selling pressure.
Here's what stands out to me.
📉 1. The trend has changed.
After reaching above $10 in September, ETC entered a sustained decline. Recent rebounds have struggled to regain the ground lost, suggesting buyers have yet to establish control.
📊 2. The $7.30 area is the immediate level to watch.
ETC's reported 24-hour low is $7.32. If buyers defend this zone, the market could attempt a short-term recovery.
But if price breaks below it decisively, the next area to watch is around $7.00, a previous chart region where price consolidated.
🟢 3. Recovery needs confirmation.
The $7.70 to $8.00 region is the first resistance zone I'm watching. Reclaiming it would be an initial improvement, but one green candle wouldn't confirm a trend reversal.
My biggest observation?
A falling price doesn't automatically make an asset undervalued.
ETC needs more than a bounce. Buyers need to demonstrate sustained demand, stronger price structure and the ability to reclaim resistance.
Until that happens, I would treat any recovery as a potential relief rally rather than assume a new uptrend has begun.
The levels that matter next:
• Support: $7.30, then around $7.00
• Resistance: $7.70 to $8.00
• Current price in the screenshot: $7.42
These are chart-based reference zones, not guaranteed turning points.
What's your view on $ETC ? Is this a potential accumulation zone, or does the chart suggest more downside before a durable recovery?
#EthereumClassic #CryptoAnalysis #BinanceSquare
Technical analysis based on the Binance ETC/USDT chart screenshot dated October 29, 2026. Price levels can change quickly. This is market commentary, not financial advice.
$ETC
1
71

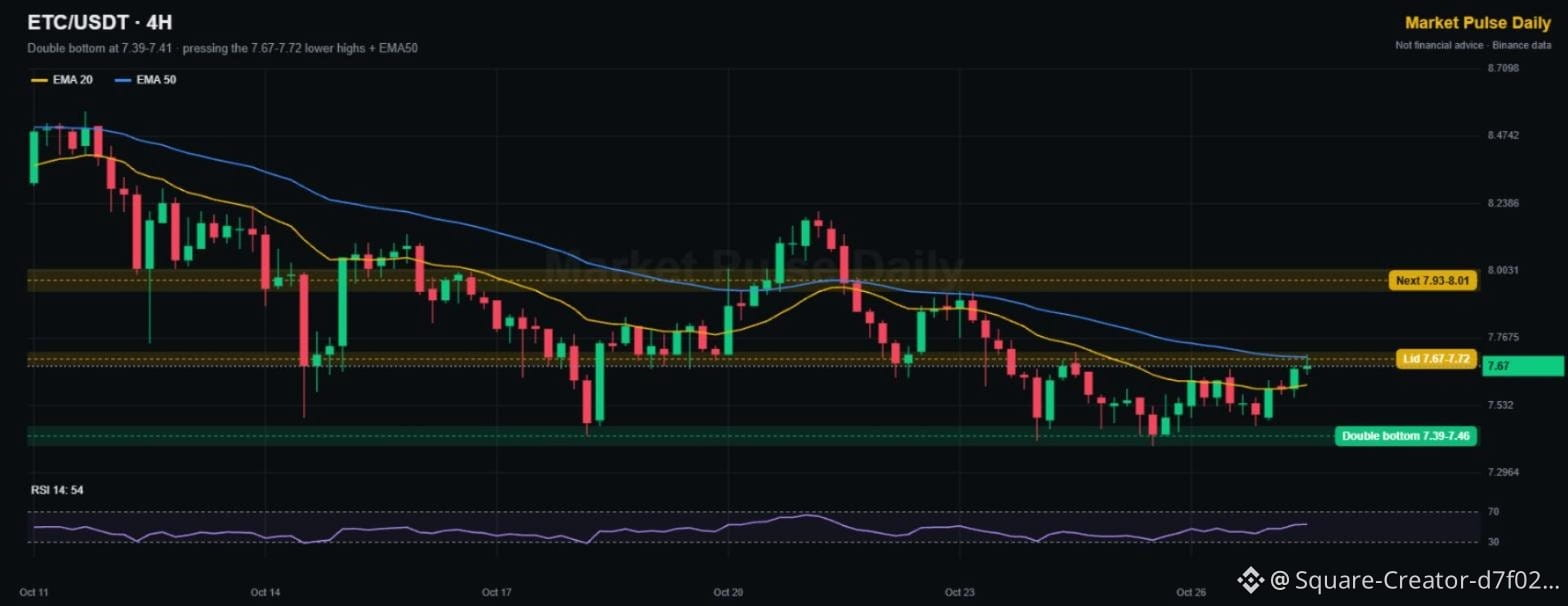
$ETC is pressing the lid after a double bottom 🟢
Ethereum Classic held 7.39-7.46 twice since Oct 24, and the last two 4H candles pushed right into the 7.67-7.72 zone, where the lower highs and the EMA50 meet.
🟢 Double bottom: 7.39-7.46
🔴 Lid: 7.67-7.72
🎯 Next: 7.93-8.01
A 4H close above 7.72 breaks the week-long downtrend. Rejection here would mean another trip to the bottom of the range.
👉 Tap $ETC
for the live chart. NFA
Break or reject? 👇
#EthereumClassic #Altcoins #FOMCWatch
No Binance account yet? Get 20% of your trading fees back 👉 [Sign up on Binance](https://www.binance.com/register?ref=TGCSTKKM)
{spot}(ETCUSDT)
$ETC is pressing the lid after a double bottom 🟢
Ethereum Classic held 7.39-7.46 twice since Oct 24, and the last two 4H candles pushed right into the 7.67-7.72 zone, where the lower highs and the EMA50 meet.
🟢 Double bottom: 7.39-7.46
🔴 Lid: 7.67-7.72
🎯 Next: 7.93-8.01
A 4H close above 7.72 breaks the week-long downtrend. Rejection here would mean another trip to the bottom of the range.
👉 Tap $ETC
for the live chart. NFA
Break or reject? 👇
#EthereumClassic #Altcoins #FOMCWatch
No Binance account yet? Get 20% of your trading fees back 👉 Sign up on Binance
1
27
$ETC has a clean triple bottom at 7.40. Here's the setup 📌
Structure (4H):
• Lows: 7.41 → 7.39 → 7.46. Buyers defend 7.40 every time
• Lower highs: 7.72 → 7.67. Sellers still active above
• Price 7.59, exactly on EMA 20. EMA 50 at 7.70
• RSI 48. Only -3.7% on the week, better than most alts
The 7.67 to 7.72 zone is where this gets decided.
Levels for $ETC :
🟢 4H close above 7.72 → triple bottom confirmed, 7.93 next
🔴 4H close below 7.39 → floor breaks, 7.20 next
Tight stop idea for longs: under 7.35.
Long or short $ETC here? 👇
NFA
#EthereumClassic #Altcoins #TradingSignals
No Binance account yet? Get 20% of your trading fees back 👉 [Sign up on Binance](https://www.binance.com/register?ref=TGCSTKKM)
$ETC has a clean triple bottom at 7.40. Here's the setup 📌
Structure (4H):
• Lows: 7.41 → 7.39 → 7.46. Buyers defend 7.40 every time
• Lower highs: 7.72 → 7.67. Sellers still active above
• Price 7.59, exactly on EMA 20. EMA 50 at 7.70
• RSI 48. Only -3.7% on the week, better than most alts
The 7.67 to 7.72 zone is where this gets decided.
Levels for $ETC :
🟢 4H close above 7.72 → triple bottom confirmed, 7.93 next
🔴 4H close below 7.39 → floor breaks, 7.20 next
Tight stop idea for longs: under 7.35.
Long or short $ETC here? 👇
NFA
#EthereumClassic #Altcoins #TradingSignals
No Binance account yet? Get 20% of your trading fees back 👉 Sign up on Binance
18

🔥 لماذا عادت عملة $ETC إلى دائرة الاهتمام؟ 👀
عملة Ethereum Classic (ETC) ظهرت ضمن العملات الأكثر بحثًا على منصة Binance، وهذا يفتح بابًا لسؤال مهم: هل تستحق المتابعة في الفترة القادمة؟ 📊
🔹 مشروع له تاريخ طويل في عالم البلوكشين.
🔹 تستحق حركة السعر وحجم التداول مراقبة دقيقة.
🔹 الأهم هو البحث عن أسباب الاهتمام، وليس الانجراف وراء الضجة.
⚠️ تذكّر: كثرة البحث لا تعني أن السعر سيرتفع، ولا يوجد ضمان للربح. التحليل وإدارة المخاطر أهم من الحماس.
#crypto #Binance #EthereumClassic #ETC
{future}(ETCUSDT)
🔥 لماذا عادت عملة $ETC إلى دائرة الاهتمام؟ 👀
عملة Ethereum Classic (ETC) ظهرت ضمن العملات الأكثر بحثًا على منصة Binance، وهذا يفتح بابًا لسؤال مهم: هل تستحق المتابعة في الفترة القادمة؟ 📊
🔹 مشروع له تاريخ طويل في عالم البلوكشين.
🔹 تستحق حركة السعر وحجم التداول مراقبة دقيقة.
🔹 الأهم هو البحث عن أسباب الاهتمام، وليس الانجراف وراء الضجة.
⚠️ تذكّر: كثرة البحث لا تعني أن السعر سيرتفع، ولا يوجد ضمان للربح. التحليل وإدارة المخاطر أهم من الحماس.
#crypto #Binance #EthereumClassic #ETC
1
97

·
--
$ETC — BREAKDOWN SETUP
ETC is appearing in Binance Square's Most Searched list. High attention can bring volatility in both directions.
📉 My Bias: SHORT
Entry trigger:
• Wait for a clean 15-minute support breakdown.
• Look for a failed retest before entering.
• Stop-loss: Above the retest high.
• Target: The next support zone.
No confirmed breakdown? Stay out.
⚠️ Trending doesn't automatically mean bullish.
#ETC #EthereumClassic #altcoins #BİNANCESQUARE
2
107

·
--
ສັນຍານໝີ
📉 ETC — TIGHT RANGE COMPRESSION & TESTING THE LOCAL SUPPORT FLOOR! 🔻
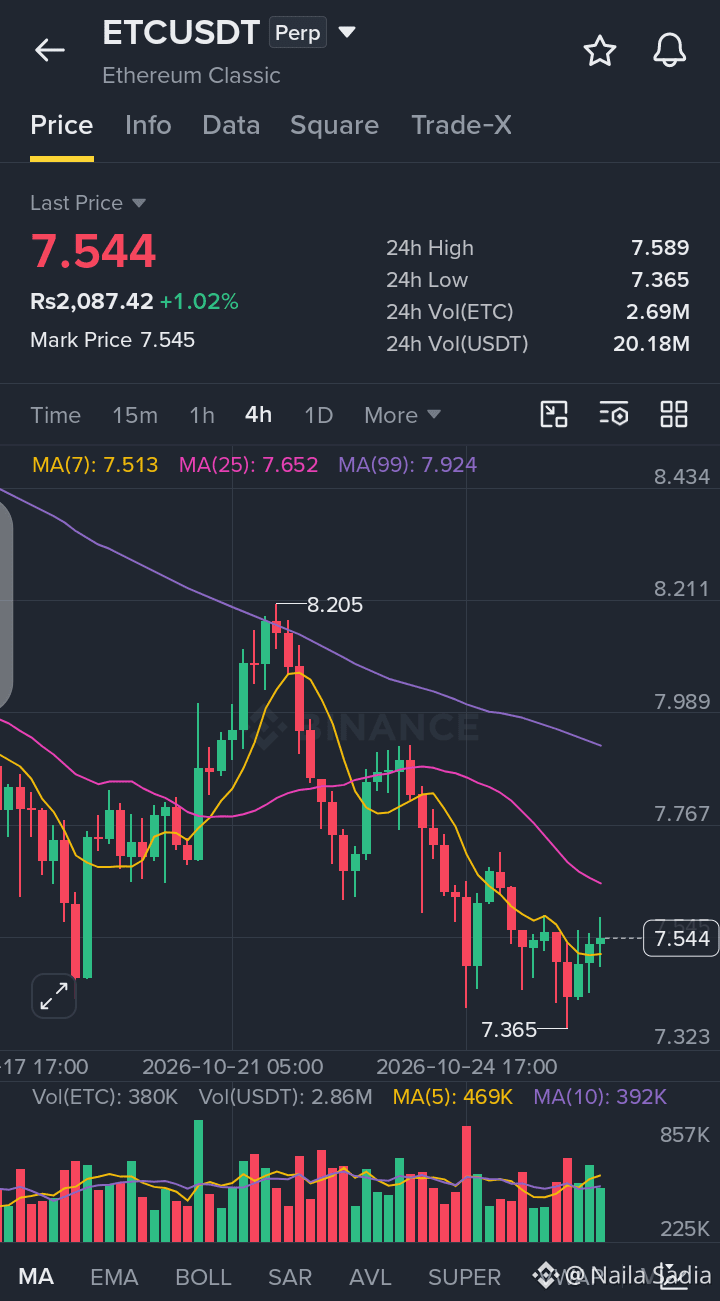
$ETC is trading higher at 7.544 (+1.02%, or roughly Rs2,087.42), moving within an active 24-hour range between a high of 7.589 and a low of 7.365. Price action on this 4-hour chart reflects a localized consolidation phase following the rejection from the 8.205 swing peak, currently hugging just below the fast MA(7) (7.513), MA(25) (7.652), and macro structural MA(99) (7.924) lines.
📊 QUICK TRADE PLAN — 4H
🟢 LONG ENTRY: 7.200–7.500 (on volume absorption and confirmed defense of local support floors)
🛑 STOP LOSS: 7.000
🎯 TP1: 8.000
🎯 TP2: 8.500
Are you watching for Ethereum Classic to hold this baseline support and push back toward the moving average cluster, or waiting for deeper continuation signals? Let's discuss below! 👇
👉 Trade: $ETC
{future}(ETCUSDT)
#EthereumClassic #ETC #cryptotrading #BinanceSquare #bearish
📉 ETC — TIGHT RANGE COMPRESSION & TESTING THE LOCAL SUPPORT FLOOR! 🔻
$ETC is trading higher at 7.544 (+1.02%, or roughly Rs2,087.42), moving within an active 24-hour range between a high of 7.589 and a low of 7.365. Price action on this 4-hour chart reflects a localized consolidation phase following the rejection from the 8.205 swing peak, currently hugging just below the fast MA(7) (7.513), MA(25) (7.652), and macro structural MA(99) (7.924) lines.
📊 QUICK TRADE PLAN — 4H
🟢 LONG ENTRY: 7.200–7.500 (on volume absorption and confirmed defense of local support floors)
🛑 STOP LOSS: 7.000
🎯 TP1: 8.000
🎯 TP2: 8.500
Are you watching for Ethereum Classic to hold this baseline support and push back toward the moving average cluster, or waiting for deeper continuation signals? Let's discuss below! 👇
👉 Trade: $ETC
#EthereumClassic #ETC #cryptotrading #BinanceSquare #bearish
93

·
--
ສັນຍານກະທິງ
ETC/USDT: Can Ethereum Classic Turn This Pullback Into a Bullish Reversal? 🚀
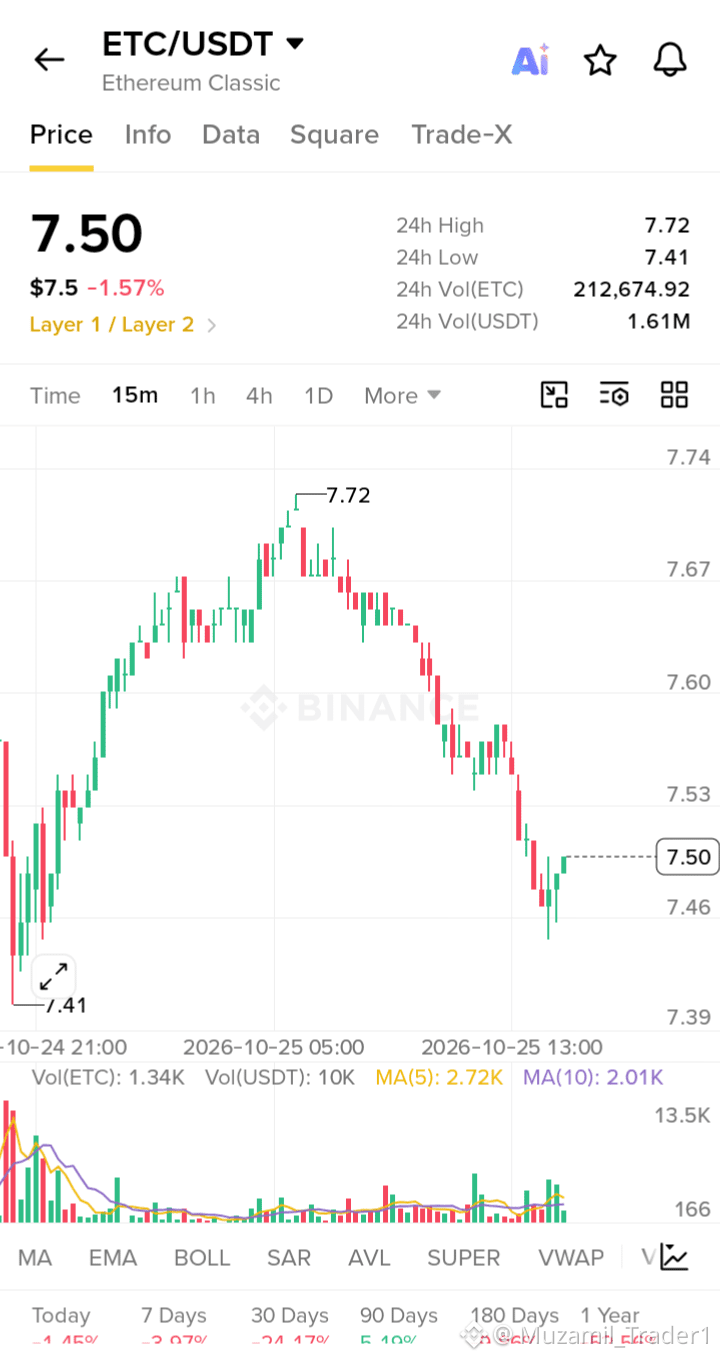
$ETC is approaching an important moment. After recent selling pressure, ETC is trading around $7.50, with buyers watching closely for signs of a recovery.
The interesting part is its supply story. In September 2026, ETC completed its fifth block reward reduction, cutting miner rewards by 20%. This reduces the rate at which new $ETC enters circulation, although it does not guarantee higher prices.
📊 Key levels to watch
- Support: $7.40–$7.45
- Resistance: $7.60, then $7.80–$8.00
- Bullish confirmation: A strong breakout above resistance with rising volume
- Invalidation: A sustained breakdown below support
{future}(ETCUSDT)
If buyers defend the current support zone and trading volume improves, ETC could attempt a recovery toward $8.00. A broader crypto market rebound would strengthen that possibility.
The risk is still real: $ETC has faced recent weakness, and a bounce without buying volume could quickly fade.
My view: ETC has a potential recovery setup, but confirmation matters more than predictions. Watch how price reacts around support before assuming the next move will be upward.
Do you think ETC can reclaim $8 soon, or will sellers push it lower first?
#ETC #EthereumClassic #ETCUSDT #CryptoAnalysis #BinanceSquare
ETC/USDT: Can Ethereum Classic Turn This Pullback Into a Bullish Reversal? 🚀
$ETC is approaching an important moment. After recent selling pressure, ETC is trading around $7.50, with buyers watching closely for signs of a recovery.
The interesting part is its supply story. In September 2026, ETC completed its fifth block reward reduction, cutting miner rewards by 20%. This reduces the rate at which new $ETC enters circulation, although it does not guarantee higher prices.
📊 Key levels to watch
- Support: $7.40–$7.45
- Resistance: $7.60, then $7.80–$8.00
- Bullish confirmation: A strong breakout above resistance with rising volume
- Invalidation: A sustained breakdown below support
If buyers defend the current support zone and trading volume improves, ETC could attempt a recovery toward $8.00. A broader crypto market rebound would strengthen that possibility.
The risk is still real: $ETC has faced recent weakness, and a bounce without buying volume could quickly fade.
My view: ETC has a potential recovery setup, but confirmation matters more than predictions. Watch how price reacts around support before assuming the next move will be upward.
Do you think ETC can reclaim $8 soon, or will sellers push it lower first?
#ETC #EthereumClassic #ETCUSDT #CryptoAnalysis #BinanceSquare

111

$ETC READY FOR A SURPRISE BREAKOUT? 🚀
Ethereum Classic is back on traders' radar!
🔹 Potential: Proof-of-work blockchain with a fixed supply.
🔹 Bullish: Rising volume could fuel a breakout.
🔹 Risk: Weak momentum could trigger another dip.
📊 My Take: Worth watching, but confirmation beats FOMO!
🔥 Tap $ETC to check the live chart!
{future}(ETCUSDT)
#ETC #EthereumClassic #EarningsSeason #BinanceSquare
$ETC READY FOR A SURPRISE BREAKOUT? 🚀
Ethereum Classic is back on traders' radar!
🔹 Potential: Proof-of-work blockchain with a fixed supply.
🔹 Bullish: Rising volume could fuel a breakout.
🔹 Risk: Weak momentum could trigger another dip.
📊 My Take: Worth watching, but confirmation beats FOMO!
🔥 Tap $ETC to check the live chart!
#ETC #EthereumClassic #EarningsSeason #BinanceSquare
1
110

$ETC
{spot}(ETCUSDT)
"Code is Law. Decentralized. Immutable. Unstoppable." 🛡️🚀
ETC continues to hold the line as the original, uncompromised Ethereum chain.
📊 Current Price: ~$7.49 USD
Are you holding the original legacy? 💎🙌
#ETC #EthereumClassic #Crypto #CryptoNews #HODL
$ETC
"Code is Law. Decentralized. Immutable. Unstoppable." 🛡️🚀
ETC continues to hold the line as the original, uncompromised Ethereum chain.
📊 Current Price: ~$7.49 USD
Are you holding the original legacy? 💎🙌
#ETC #EthereumClassic #Crypto #CryptoNews #HODL
"Code is Law. Decentralized. Immutable. Unstoppable." 🛡️🚀
ETC continues to hold the line as the original, uncompromised Ethereum chain.
📊 Current Price: ~$7.49 USD
Are you holding the original legacy? 💎🙌
#ETC #EthereumClassic #Crypto #CryptoNews #HODL
1
83

·
--
🚨 ETC UPDATE: CAN ETHEREUM CLASSIC MAKE A COMEBACK?
Ethereum Classic ($ETC ) is showing signs of weakness as traders watch key support levels and wait for a stronger recovery. 📉📊
🔥 Here’s what matters right now:
💰 Support: Around $7.44
🎯 Resistance: $8.10–$8.20
⛏️ Supply update: $ETC block rewards were cut by 20% in August, slowing the creation of new coins.
📊 A rebound above resistance with strong volume could improve the short-term outlook. But if support breaks, further downside remains possible.
⚠️ There is no guaranteed breakout, so watch Bitcoin’s direction and trading volume before making decisions.
💬 YOUR TURN: Can $ETC reclaim $8.20, or will sellers push it lower?
#ETC #EthereumClassic
{spot}(ETCUSDT)
🚨 ETC UPDATE: CAN ETHEREUM CLASSIC MAKE A COMEBACK?
Ethereum Classic ($ETC ) is showing signs of weakness as traders watch key support levels and wait for a stronger recovery. 📉📊
🔥 Here’s what matters right now:
💰 Support: Around $7.44
🎯 Resistance: $8.10–$8.20
⛏️ Supply update: $ETC block rewards were cut by 20% in August, slowing the creation of new coins.
📊 A rebound above resistance with strong volume could improve the short-term outlook. But if support breaks, further downside remains possible.
⚠️ There is no guaranteed breakout, so watch Bitcoin’s direction and trading volume before making decisions.
💬 YOUR TURN: Can $ETC reclaim $8.20, or will sellers push it lower?
#ETC #EthereumClassic

87

📊 Current Market Snapshot
Trading Pair: $ETC /USDT
Current Price Range: ~$7.50 – $7.80 USD
Market Sentiment: Neutral / Short-Term Consolidation
📈 Technical Analysis & Key Levels
Resistance Levels:
Immediate Resistance: $8.20
Major Breakout Zone: $8.50 (A confirmed 4-hour close above $8.20 with solid volume targets this zone).
Support Levels:
Immediate Support: $7.50 – $7.75
Strong Support / Invalid Zone: $7.20 – $7.40
Indicators & Momentum:
RSI (14): Sitting near the neutral ~50–55 range, reflecting sideways movement before a potential directional leg.
Moving Averages: ETC is consolidating near its local support level. Holding above $7.50 keeps the immediate market structure safe from further deep retracements.
.
💡 Trade Setup & Plan
Entry Options:
Accumulation Entry: $7.50 – $7.70 (on minor retests)
Breakout Entry: Enter on a confirmed 4H candle close above $8.20.
Take-Profit (TP) Targets:
Target 1: $8.20
Target 2: $8.80
Target 3 (Mid-term): $9.50+
Stop Loss (SL):
Strict SL below $7.20 to control risk.
📌 Binance Square Post Format (Direct Copy-Paste)
🚨 $ETC / USDT TRADE UPDATE TODAY 🚨
$ETC is currently consolidating around the $7.60 - $7.80 range. Indicators show a neutral structure holding above local support.
🎯 Buy Zone: $7.50 – $7.70
🎯 Target 1: $8.20
🎯 Target 2: $8.80
🎯 Target 3: $9.50+
🛑 Stop Loss: $7.20
#EthereumClassic #ETC #BinanceSquare #CryptoSignals #TradingUpdate
{spot}(ETCUSDT)
📊 Current Market Snapshot
Trading Pair: $ETC /USDT
Current Price Range: ~$7.50 – $7.80 USD
Market Sentiment: Neutral / Short-Term Consolidation
📈 Technical Analysis & Key Levels
Resistance Levels:
Immediate Resistance: $8.20
Major Breakout Zone: $8.50 (A confirmed 4-hour close above $8.20 with solid volume targets this zone).
Support Levels:
Immediate Support: $7.50 – $7.75
Strong Support / Invalid Zone: $7.20 – $7.40
Indicators & Momentum:
RSI (14): Sitting near the neutral ~50–55 range, reflecting sideways movement before a potential directional leg.
Moving Averages: ETC is consolidating near its local support level. Holding above $7.50 keeps the immediate market structure safe from further deep retracements.
.
💡 Trade Setup & Plan
Entry Options:
Accumulation Entry: $7.50 – $7.70 (on minor retests)
Breakout Entry: Enter on a confirmed 4H candle close above $8.20.
Take-Profit (TP) Targets:
Target 1: $8.20
Target 2: $8.80
Target 3 (Mid-term): $9.50+
Stop Loss (SL):
Strict SL below $7.20 to control risk.
📌 Binance Square Post Format (Direct Copy-Paste)
🚨 $ETC / USDT TRADE UPDATE TODAY 🚨
$ETC is currently consolidating around the $7.60 - $7.80 range. Indicators show a neutral structure holding above local support.
🎯 Buy Zone: $7.50 – $7.70
🎯 Target 1: $8.20
🎯 Target 2: $8.80
🎯 Target 3: $9.50+
🛑 Stop Loss: $7.20
#EthereumClassic #ETC #BinanceSquare #CryptoSignals #TradingUpdate

58

·
--
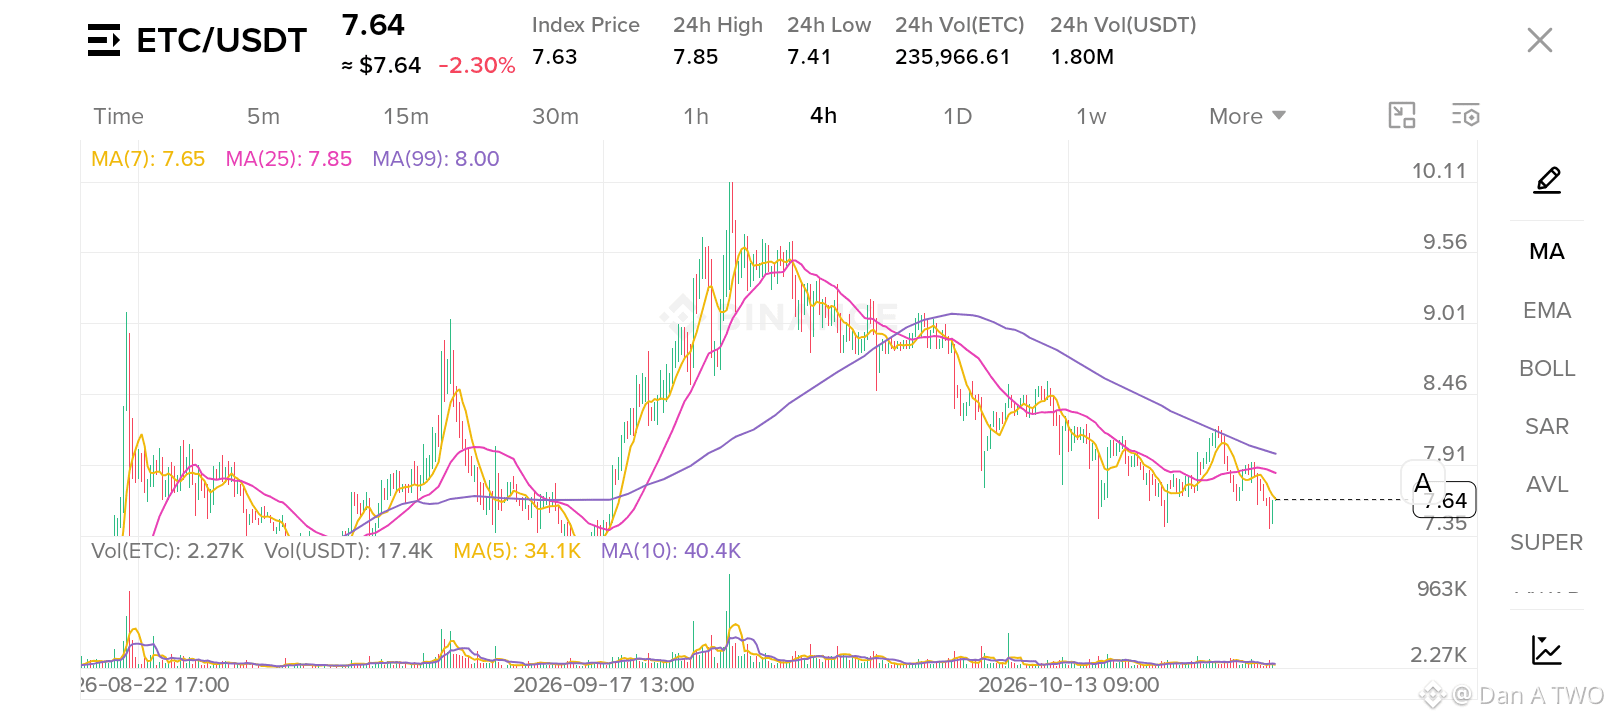
ETC: From Its $176 Peak to Much Lower Levels… What Happened?
Ethereum Classic once reached around $176 during the 2021 bull market. Today, it trades far below that level.
So, what happened? 🤔
1. 📉 The bull market ended.
When the crypto market turned bearish, ETC faced significant selling pressure.
⚔️ 2. Competition got tougher.
Ethereum and other smart-contract platforms attracted developers, users, and capital.
📊 3. A strong history doesn't guarantee demand.
ETC still has its own place in crypto, but it must compete for attention and adoption.
💡 My take: Being far below its all-time high doesn't automatically mean ETC is undervalued. A real recovery needs stronger demand and sustained market momentum.
👇 Your turn: Do you think ETC can make a comeback, or has the market moved on?
#ETC #EthereumClassic #ALTCOİNS #BinanceSquare $ETC #DanATWO $SOL $ETH

72

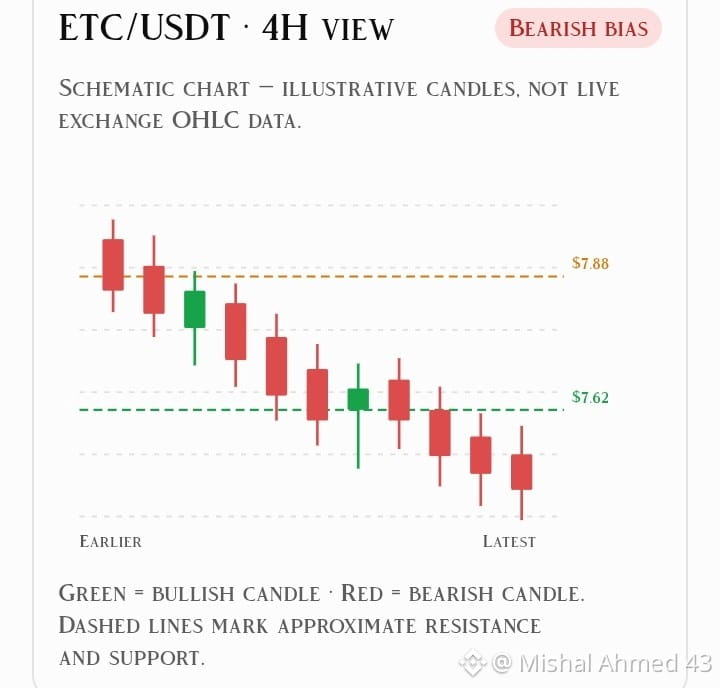
📊 $ETC /USDT Quick Analysis 🕯️
🔴 Trend: Bearish
🟢 Support: $7.62 / $7.35
🔴 Resistance: $7.88 / $8.26
📈 Resistance breakout = Bullish chance
📉 Support breakdown = More downside possible
⚠️ Wait for candle confirmation. DYOR!
#ETC #EthereumClassic #Crypto #trading
{future}(ETCUSDT)
📊 $ETC /USDT Quick Analysis 🕯️
🔴 Trend: Bearish
🟢 Support: $7.62 / $7.35
🔴 Resistance: $7.88 / $8.26
📈 Resistance breakout = Bullish chance
📉 Support breakdown = More downside possible
⚠️ Wait for candle confirmation. DYOR!
#ETC #EthereumClassic #Crypto #trading
🔴 Trend: Bearish
🟢 Support: $7.62 / $7.35
🔴 Resistance: $7.88 / $8.26
📈 Resistance breakout = Bullish chance
📉 Support breakdown = More downside possible
⚠️ Wait for candle confirmation. DYOR!
#ETC #EthereumClassic #Crypto #trading
2
115

·
--
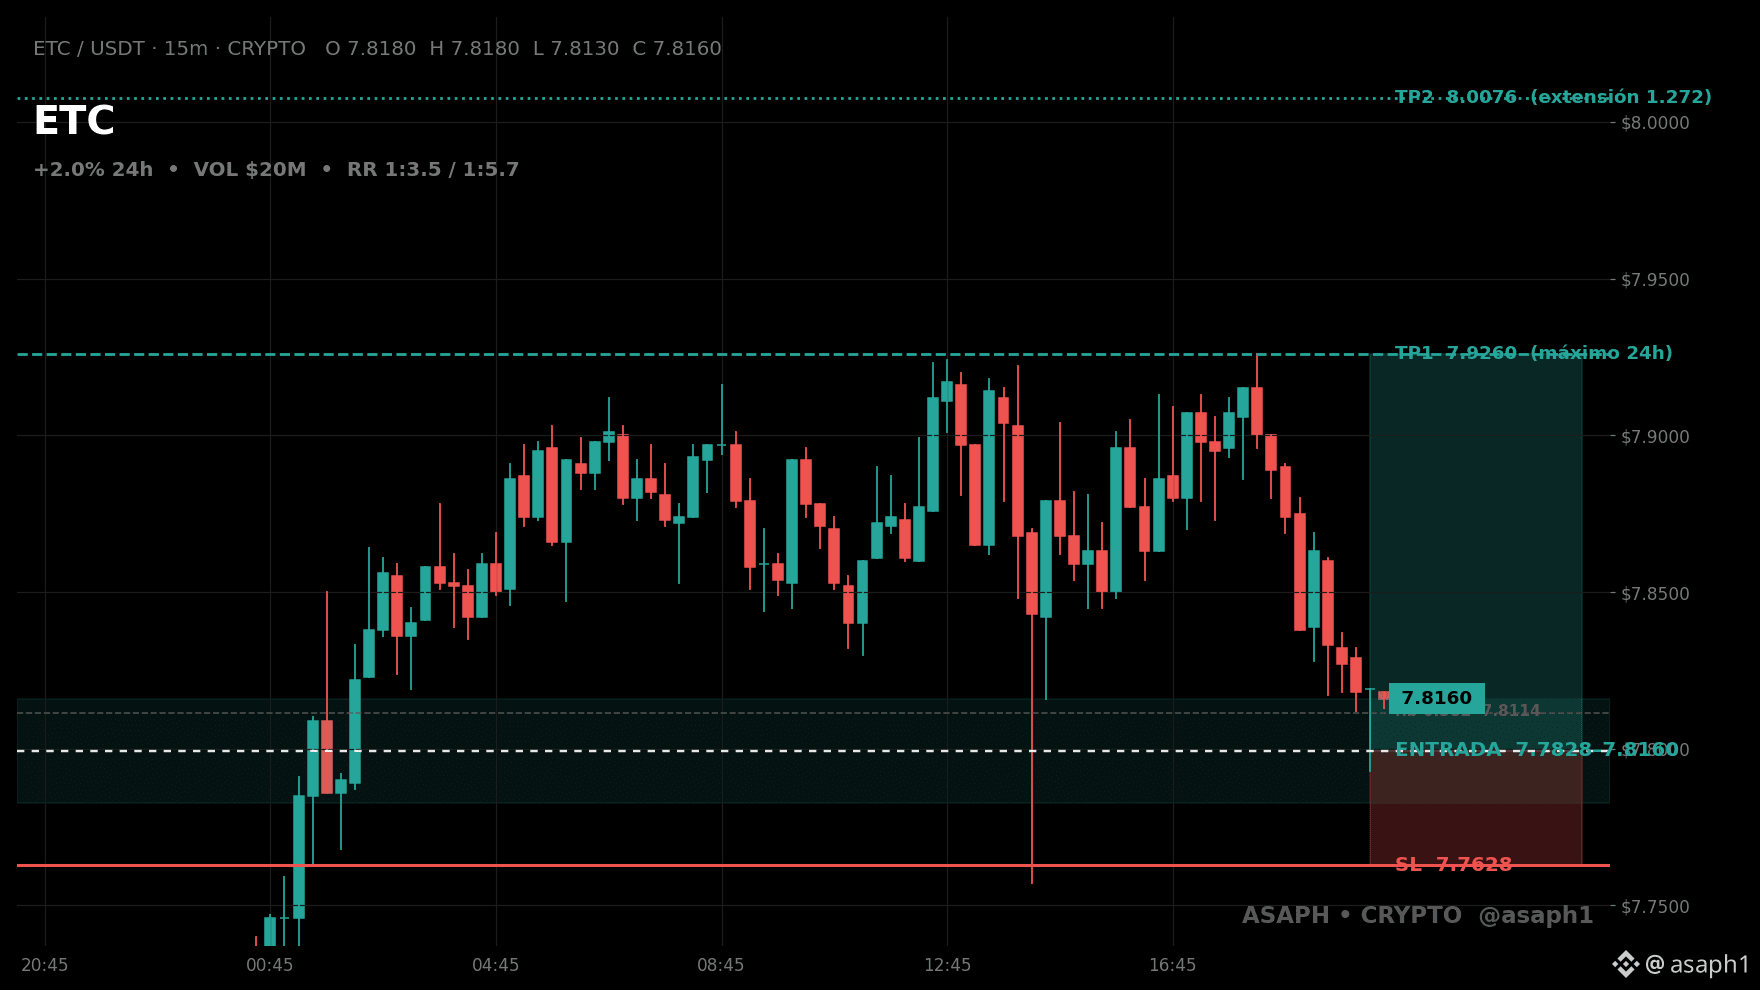
⛏️ $ETC despierta mientras BTC domina — compro el rebote clásico
La dominancia de BTC tocó 60%, máximo desde mayo: el capital rota fuera de las alts. Y aun así ETC sube +2% hoy.
- el interés abierto sube +2.4% ($19.7M) junto al precio: la subida trae gente, no es humo
- RSI 15m en 38.3: queda aire antes de la sobrecompra
- el volumen está -10.8% vs ayer: el movimiento aún no llamó a la multitud
- la red BTC cobra 2 sat/vB (Mempool): nadie tiene prisa, el mercado respira
Con el interés abierto subiendo junto al precio, la zona es donde el rebote se confirma.
📊 Señal LONG ETC
📍 Precio ahora: $7.816
🎯 Zona: $7.78275–$7.816 (dist. 0.0%)
La entrada va con orden límite, mitad y mitad en la zona.
🛑 Stop: $7.7628 (-0.47% desde la media, confirmado ANTES de entrar)
Riesgo por trade: 2% del capital.
✅ TP1: $7.926, el máximo de 24h: cobro el 50% y subo el stop a break-even.
🏁 TP2: $8.0076, la extensión 1.272 que sigue si el máximo cede.
R/R: 1:3.46 · 1:5.69
⏳ Válida: próximas 6h / mientras aguante $7.7628
¿ETC rompe los $7.926 o la EMA50 de 4h lo frena y me saca?
Vota en comentarios — precio en vivo aquí 👇 ETC
ETC #ETC #EthereumClassic #Crypto
Esto es un plan, no consejo financiero.
81
·
--
ສັນຍານກະທິງ
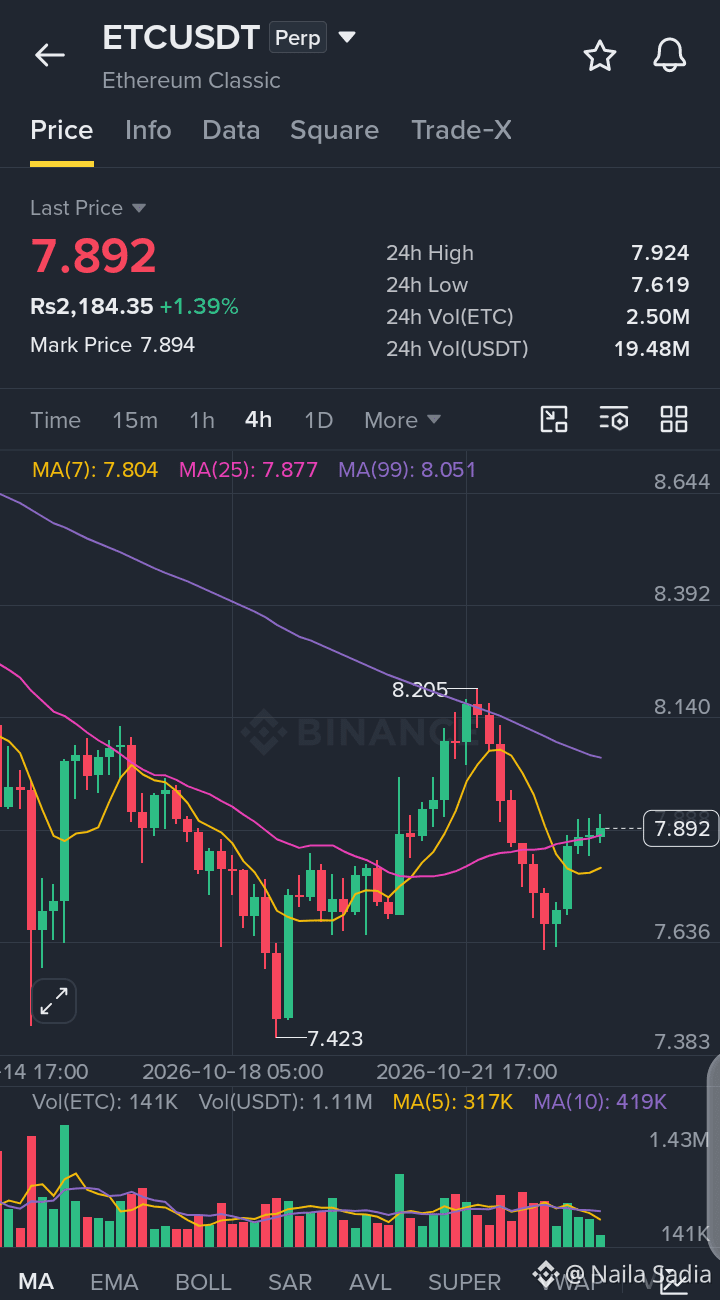
🟢 ETC — BULLISH RECOVERY & RECLAMATION OF SHORT-TERM MOVING AVERAGES! 📈
$ETC is trading higher at 7.892 (+1.39%, or roughly Rs2,184.35), moving within an active 24-hour range between a high of 7.924 and a low of 7.619. Price action on this 4-hour chart displays a positive recovery bounce following a successful defense of the local swing low at 7.423, pushing back up to cross right above the fast MA(7) (7.804) and MA(25) (7.877) lines while pressing near the macro structural MA(99) (8.051) band.
📊 QUICK TRADE PLAN — 4H
🟢 LONG ENTRY: 7.600–7.880 (on intraday pullbacks or successful support retests near the fast MA cluster)
🛑 STOP LOSS: 7.350
🎯 TP1: 8.200
🎯 TP2: 8.600
Are you watching for Ethereum Classic to sustain this momentum above the moving averages and push past the 8.20 resistance zone, or waiting for a retest? Let's discuss below! 👇
👉 Trade: $ETC
{future}(ETCUSDT)
#EthereumClassic #ETC #cryptotrading #BinanceSquare #bullish
🟢 ETC — BULLISH RECOVERY & RECLAMATION OF SHORT-TERM MOVING AVERAGES! 📈
$ETC is trading higher at 7.892 (+1.39%, or roughly Rs2,184.35), moving within an active 24-hour range between a high of 7.924 and a low of 7.619. Price action on this 4-hour chart displays a positive recovery bounce following a successful defense of the local swing low at 7.423, pushing back up to cross right above the fast MA(7) (7.804) and MA(25) (7.877) lines while pressing near the macro structural MA(99) (8.051) band.
📊 QUICK TRADE PLAN — 4H
🟢 LONG ENTRY: 7.600–7.880 (on intraday pullbacks or successful support retests near the fast MA cluster)
🛑 STOP LOSS: 7.350
🎯 TP1: 8.200
🎯 TP2: 8.600
Are you watching for Ethereum Classic to sustain this momentum above the moving averages and push past the 8.20 resistance zone, or waiting for a retest? Let's discuss below! 👇
👉 Trade: $ETC
#EthereumClassic #ETC #cryptotrading #BinanceSquare #bullish
54

·
--
ສັນຍານໝີ
$ETC : OLD SCHOOL CRYPTO, BUT IS IT BEING UNDERRATED?
While everyone is chasing the latest AI token and meme coin, Ethereum Classic ($ETC) is still sticking to its original philosophy: code is law, and immutability matters.
ETC doesn’t need to reinvent itself every market cycle to have an interesting story. It has a distinct identity in crypto — a proof-of-work blockchain that continues to attract attention from people who value a more traditional approach to decentralization.
👀 Why I’m watching $ETC:
🔹 Proof of Work — a different proposition from proof-of-stake networks.
🔹 Fixed monetary policy — ETC has a capped supply of roughly 210.7 million coins.
🔹 Established history — it’s a long-running blockchain with a clear philosophy.
🔹 Market opportunity — if interest returns to established PoW coins, ETC could get another look from traders.
Of course, being an established project doesn’t guarantee strong returns. Adoption, network security, liquidity, and overall market conditions still matter.
📊 My take? Don’t judge every crypto project by the hype surrounding it today. Sometimes the interesting question is whether an older project can regain market attention.
Is $ETC an overlooked PoW coin, or has the market moved on? 👇
#ETC #EthereumClassic #ProofOfWork #Crypto #Altcoins #BinanceSquare
{future}(ETCUSDT)
$ETC : OLD SCHOOL CRYPTO, BUT IS IT BEING UNDERRATED?
While everyone is chasing the latest AI token and meme coin, Ethereum Classic ($ETC ) is still sticking to its original philosophy: code is law, and immutability matters.
ETC doesn’t need to reinvent itself every market cycle to have an interesting story. It has a distinct identity in crypto — a proof-of-work blockchain that continues to attract attention from people who value a more traditional approach to decentralization.
👀 Why I’m watching $ETC :
🔹 Proof of Work — a different proposition from proof-of-stake networks.
🔹 Fixed monetary policy — ETC has a capped supply of roughly 210.7 million coins.
🔹 Established history — it’s a long-running blockchain with a clear philosophy.
🔹 Market opportunity — if interest returns to established PoW coins, ETC could get another look from traders.
Of course, being an established project doesn’t guarantee strong returns. Adoption, network security, liquidity, and overall market conditions still matter.
📊 My take? Don’t judge every crypto project by the hype surrounding it today. Sometimes the interesting question is whether an older project can regain market attention.
Is $ETC an overlooked PoW coin, or has the market moved on? 👇
#ETC #EthereumClassic #ProofOfWork #Crypto #Altcoins #BinanceSquare
40

·
--
#ETC (Ethereum Classic) is trading near $7.90, moving sideways in a tight range. 📊
The price is still down about 10% over the past month, so the bigger trend remains weak for now.
Watch $7.70 support and $8.00 resistance closely. Not financial advice. #EthereumClassic #TeslaSlides5%PreMarket
#ETC (Ethereum Classic) is trading near $7.90, moving sideways in a tight range. 📊
The price is still down about 10% over the past month, so the bigger trend remains weak for now.
Watch $7.70 support and $8.00 resistance closely. Not financial advice. #EthereumClassic #TeslaSlides5%PreMarket
The price is still down about 10% over the past month, so the bigger trend remains weak for now.
Watch $7.70 support and $8.00 resistance closely. Not financial advice. #EthereumClassic #TeslaSlides5%PreMarket

120
·
--
ETC is holding near $7.80. But is this a base forming, or just a pause before another leg down?
I'm watching Ethereum Classic because its daily chart is approaching an important decision point.
Here’s what stands out to me:
📉 1. The trend is still under pressure.
ETC is trading around $7.83, down 3.33% over 24 hours in my screenshot. After reaching roughly $9.50 in late September, the price has been making lower highs.
That tells me sellers still have something to prove before I consider the trend bullish.
📊 2. The moving averages tell two different stories.
The 7-day moving average is around $7.88, while the 25-day sits near $8.39. Price is below both, showing short-term weakness.
However, the 99-day average is near $7.60. That makes the $7.60-$7.80 area worth watching for a potential support reaction.
3. My bullish and bearish scenarios
🟢 Bullish: ETC holds above $7.60-$7.80, reclaims $8.00, and breaks through $8.40 with stronger buying volume. A sustained move could open a path toward $8.80-$9.00.
🔴 Bearish: ETC loses $7.60 and fails to reclaim it. That could expose the $7.40 area, followed by lower levels if selling accelerates.
These are scenarios, not guaranteed price targets.
My view: I'm not calling a bottom yet. I want to see buyers defend support and reclaim resistance with convincing volume. A bounce alone isn't confirmation.
The question is whether ETC can turn this support zone into a base, rather than simply delaying another decline.
💬 What do you think? Is ETC preparing for a recovery, or do you expect another move lower?
#EthereumClassic #CryptoAnalysis #altcoins #BinanceSquare
$ETC
{spot}(ETCUSDT)
Not financial advice. These levels are based on the chart provided and can change as market conditions evolve.
ETC is holding near $7.80. But is this a base forming, or just a pause before another leg down?
I'm watching Ethereum Classic because its daily chart is approaching an important decision point.
Here’s what stands out to me:
📉 1. The trend is still under pressure.
ETC is trading around $7.83, down 3.33% over 24 hours in my screenshot. After reaching roughly $9.50 in late September, the price has been making lower highs.
That tells me sellers still have something to prove before I consider the trend bullish.
📊 2. The moving averages tell two different stories.
The 7-day moving average is around $7.88, while the 25-day sits near $8.39. Price is below both, showing short-term weakness.
However, the 99-day average is near $7.60. That makes the $7.60-$7.80 area worth watching for a potential support reaction.
3. My bullish and bearish scenarios
🟢 Bullish: ETC holds above $7.60-$7.80, reclaims $8.00, and breaks through $8.40 with stronger buying volume. A sustained move could open a path toward $8.80-$9.00.
🔴 Bearish: ETC loses $7.60 and fails to reclaim it. That could expose the $7.40 area, followed by lower levels if selling accelerates.
These are scenarios, not guaranteed price targets.
My view: I'm not calling a bottom yet. I want to see buyers defend support and reclaim resistance with convincing volume. A bounce alone isn't confirmation.
The question is whether ETC can turn this support zone into a base, rather than simply delaying another decline.
💬 What do you think? Is ETC preparing for a recovery, or do you expect another move lower?
#EthereumClassic #CryptoAnalysis #altcoins #BinanceSquare
$ETC
Not financial advice. These levels are based on the chart provided and can change as market conditions evolve.
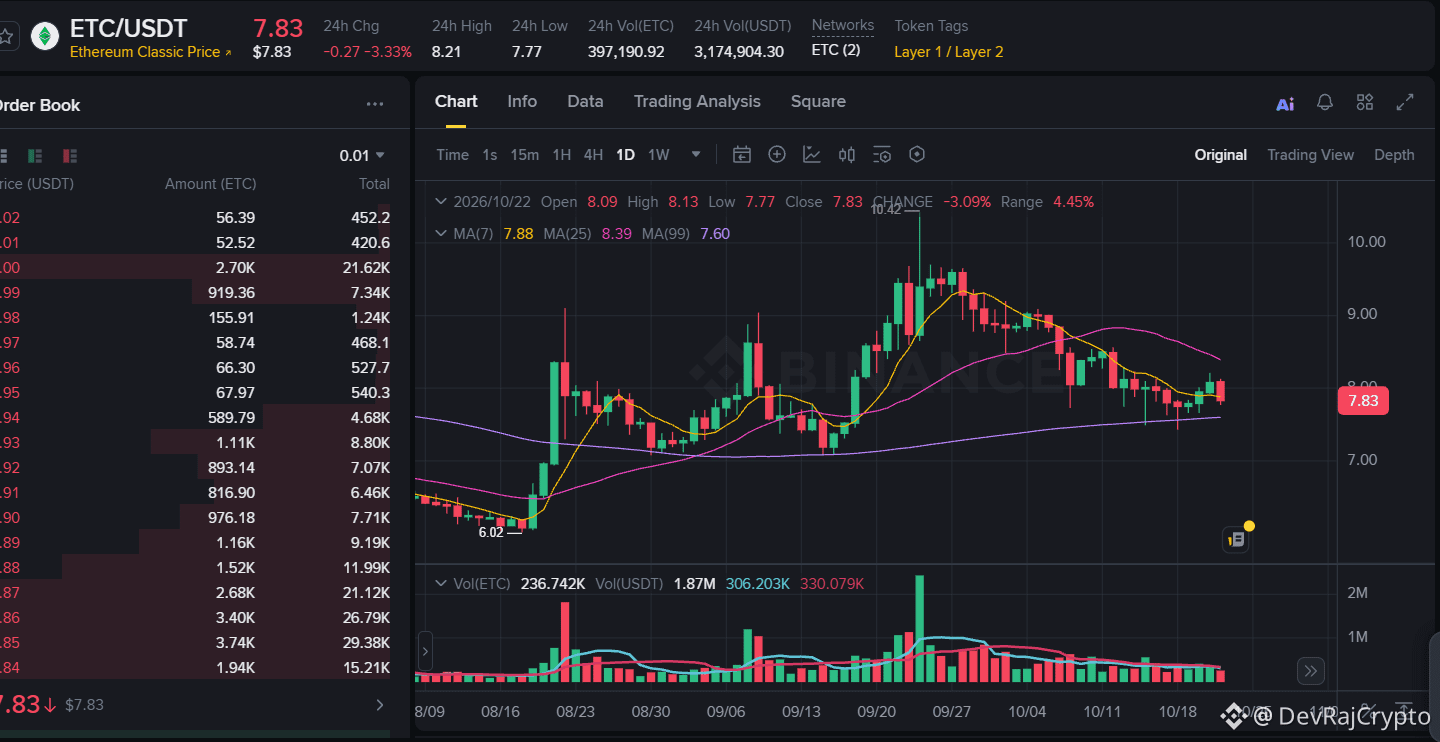
1
170

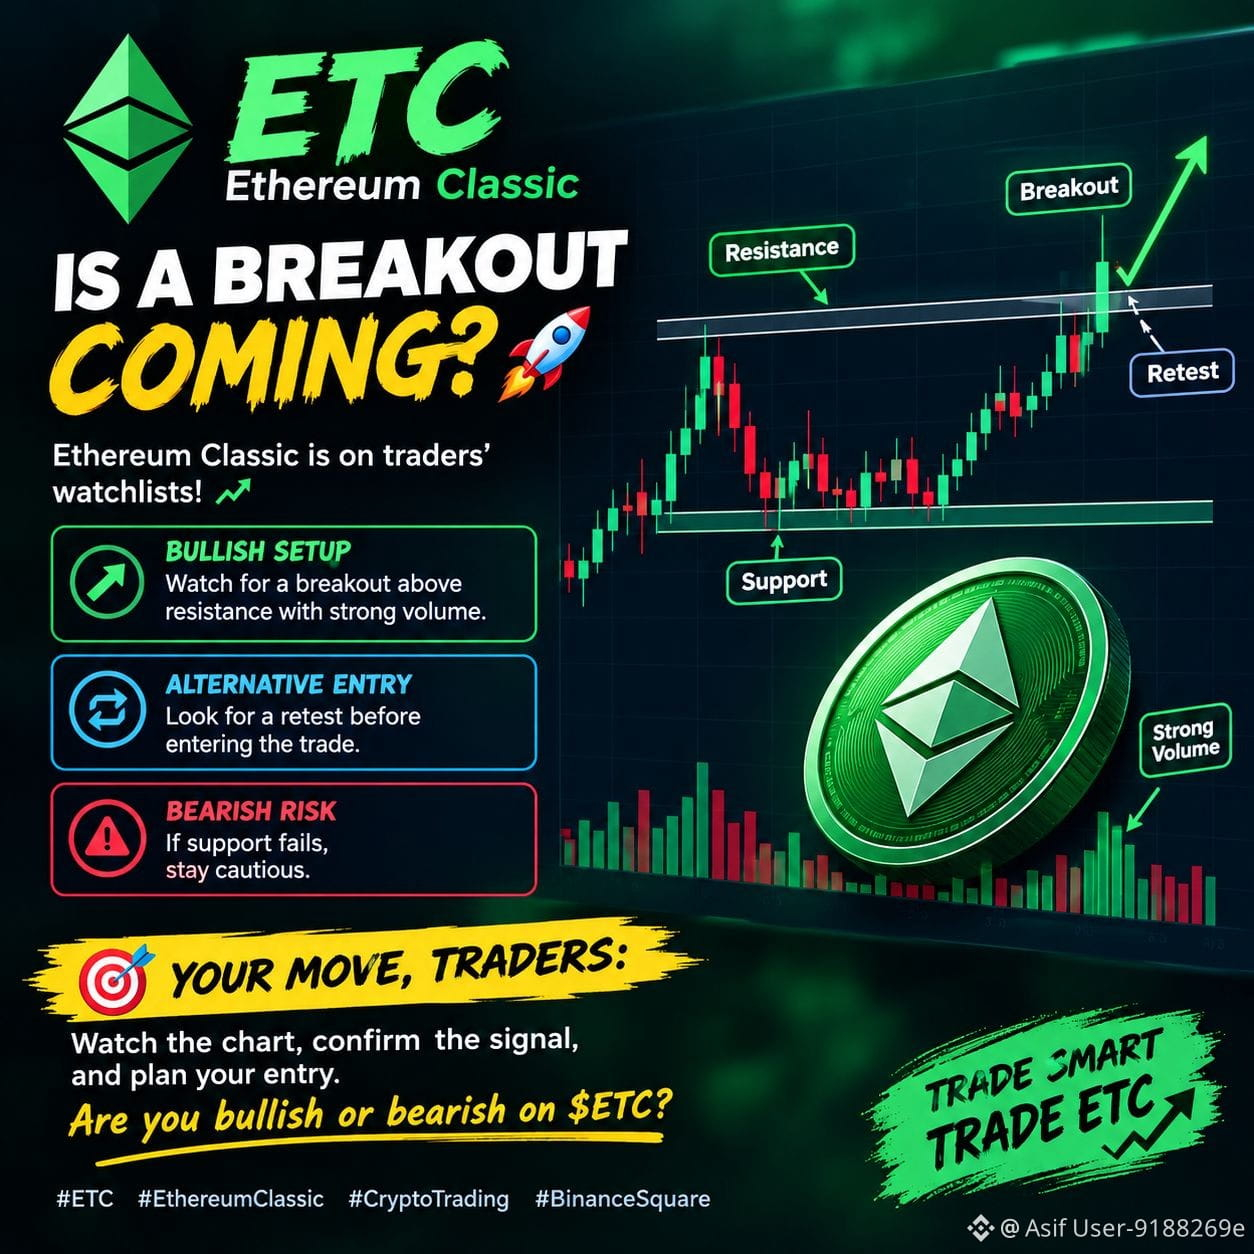
$ETC : Is a Breakout Coming? 🚀
Ethereum Classic is on traders’ watchlists! 📈 Watch for a breakout above resistance with strong volume, or a retest before entering. If support fails, stay cautious.
🎯 Your move, traders: Watch the chart, confirm the signal, and plan your entry. Are you bullish or bearish on $ETC?
#ETC #EthereumClassic #CryptoTrading #BinanceSquare
{spot}(ETCUSDT)
$ETC : Is a Breakout Coming? 🚀
Ethereum Classic is on traders’ watchlists! 📈 Watch for a breakout above resistance with strong volume, or a retest before entering. If support fails, stay cautious.
🎯 Your move, traders: Watch the chart, confirm the signal, and plan your entry. Are you bullish or bearish on $ETC ?
#ETC #EthereumClassic #CryptoTrading #BinanceSquare
81
·
--
ສັນຍານກະທິງ
ETC Bulls Are Back in the Game — Can Ethereum Classic Push Toward $8.00? 🚀
Ethereum Classic $ETC is showing signs of recovery, and the price action is becoming interesting again.
On October 21, ETC traded around $7.96, gaining approximately 2.44% over 24 hours. Recent market data also pointed to rising trading volume and improving short-term momentum, giving bulls a reason to watch this setup closely.
Why $ETC Could Have More Room to Run
Ethereum Classic remains a proof-of-work blockchain with a fixed maximum supply of 210.7 million $ETC . Its scheduled September 2026 block-reward reduction also lowered new issuance, adding a potential long-term supply narrative. However, reduced issuance alone does not guarantee higher prices.
Key Levels to Watch
{future}(ETCUSDT)
- $7.80–$7.83: Important near-term support area.
- $8.00–$8.10: Resistance zone where sellers could return.
- Above $8.10: A convincing breakout with strong volume could strengthen the bullish case.
- Below $7.74: A loss of support would weaken the recovery setup.
My Take
ETC has an opportunity to build on its recent rebound, but the next move needs confirmation. If buyers defend support and push through resistance, a move toward higher levels could become more realistic. If momentum fades, another pullback remains possible.
The opportunity is interesting, but confirmation matters more than hype.
💬 Do you think ETC can break above $8.00 and continue toward $8.50, or will sellers stop the rally?
#ETC #EthereumClassic #ETCUSDT #CryptoAnalysis #BinanceSquare
ETC Bulls Are Back in the Game — Can Ethereum Classic Push Toward $8.00? 🚀
Ethereum Classic $ETC is showing signs of recovery, and the price action is becoming interesting again.
On October 21, ETC traded around $7.96, gaining approximately 2.44% over 24 hours. Recent market data also pointed to rising trading volume and improving short-term momentum, giving bulls a reason to watch this setup closely.
Why $ETC Could Have More Room to Run
Ethereum Classic remains a proof-of-work blockchain with a fixed maximum supply of 210.7 million $ETC . Its scheduled September 2026 block-reward reduction also lowered new issuance, adding a potential long-term supply narrative. However, reduced issuance alone does not guarantee higher prices.
Key Levels to Watch
- $7.80–$7.83: Important near-term support area.
- $8.00–$8.10: Resistance zone where sellers could return.
- Above $8.10: A convincing breakout with strong volume could strengthen the bullish case.
- Below $7.74: A loss of support would weaken the recovery setup.
My Take
ETC has an opportunity to build on its recent rebound, but the next move needs confirmation. If buyers defend support and push through resistance, a move toward higher levels could become more realistic. If momentum fades, another pullback remains possible.
The opportunity is interesting, but confirmation matters more than hype.
💬 Do you think ETC can break above $8.00 and continue toward $8.50, or will sellers stop the rally?
#ETC #EthereumClassic #ETCUSDT #CryptoAnalysis #BinanceSquare

47
ເຂົ້າສູ່ລະບົບເພື່ອສຳຫຼວດເນື້ອຫາເພີ່ມເຕີມ
ເຂົ້າຮ່ວມກຸ່ມຜູ້ໃຊ້ຄຣິບໂຕທົ່ວໂລກໃນ Binance Square.
⚡️ ໄດ້ຮັບຂໍ້ມູນຫຼ້າສຸດ ແລະ ທີ່ມີປະໂຫຍດກ່ຽວກັບຄຣິບໂຕ.
💬 ໄດ້ຮັບຄວາມໄວ້ວາງໃຈຈາກຕະຫຼາດແລກປ່ຽນຄຣິບໂຕທີ່ໃຫຍ່ທີ່ສຸດໃນໂລກ.
👍 ຄົ້ນຫາຂໍ້ມູນເຊີງເລິກທີ່ແທ້ຈາກນັກສ້າງທີ່ໄດ້ຮັບການຢືນຢັນ.
ອີເມວ / ເບີໂທລະສັບ
ຫົວຂໍ້ທີ່ກໍາລັງນິຍົມ
1
#CanMicrosoftDeliverOnAI
638,975 ຄັ້ງທີ່ເບິ່ງ
4,237 ກຳລັງສົນທະນາ
2
#CanGoogleDefindItsCore
393,507 ຄັ້ງທີ່ເບິ່ງ
2,995 ກຳລັງສົນທະນາ
3
#FedWatch
16.1M ຄັ້ງທີ່ເບິ່ງ
37,315 ກຳລັງສົນທະນາ
4
#BitcoinCore32.1RaisesPeerConnectionLimit
4,398 ຄັ້ງທີ່ເບິ່ງ
151 ກຳລັງສົນທະນາ
5
#RussiaPlansStandardizedTestForCryptoInvestors
139 ຄັ້ງທີ່ເບິ່ງ
41 ກຳລັງສົນທະນາ
6
#EarningsSeason
6.1M ຄັ້ງທີ່ເບິ່ງ
30,397 ກຳລັງສົນທະນາ
7
#BitcoinCoreIdentifiesThreeVulnerabilities
14,446 ຄັ້ງທີ່ເບິ່ງ
307 ກຳລັງສົນທະນາ
8
#RippleExpects$900MAnnualizedProductRevenueRunRate
1,600 ຄັ້ງທີ່ເບິ່ງ
11 ກຳລັງສົນທະນາ
9
#GoogleToPreviewCryptoCustodySecuritySystem
4,480 ຄັ້ງທີ່ເບິ່ງ
112 ກຳລັງສົນທະນາ
10
#FedToBeginShrinkingRateSettingCalendarIn2027
5,284 ຄັ້ງທີ່ເບິ່ງ
67 ກຳລັງສົນທະນາ