

#0xftbr
0xftbr
482 views
4 ກຳລັງສົນທະນາ
ມາແຮງ
ຫຼ້າສຸດ
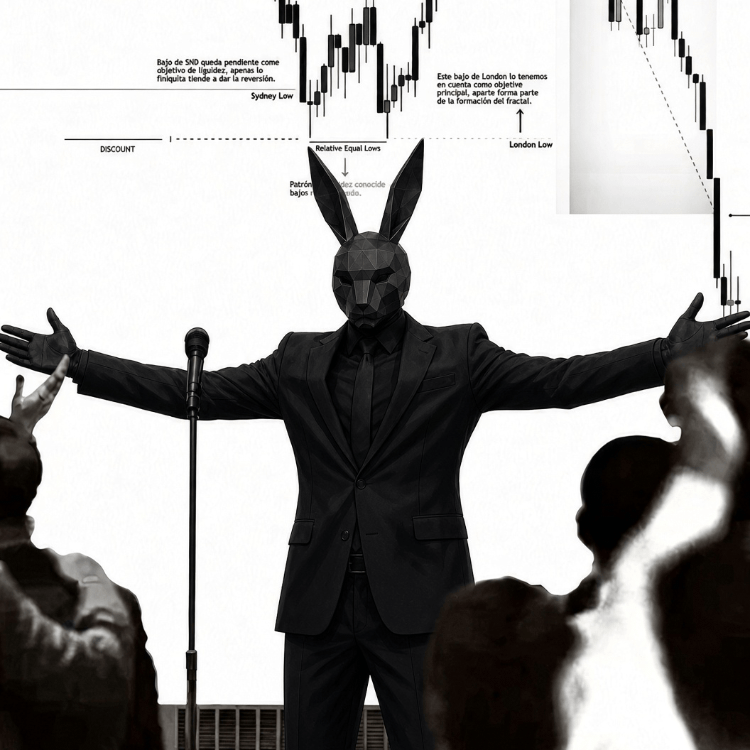
🐰 waiting for $RIVER lower
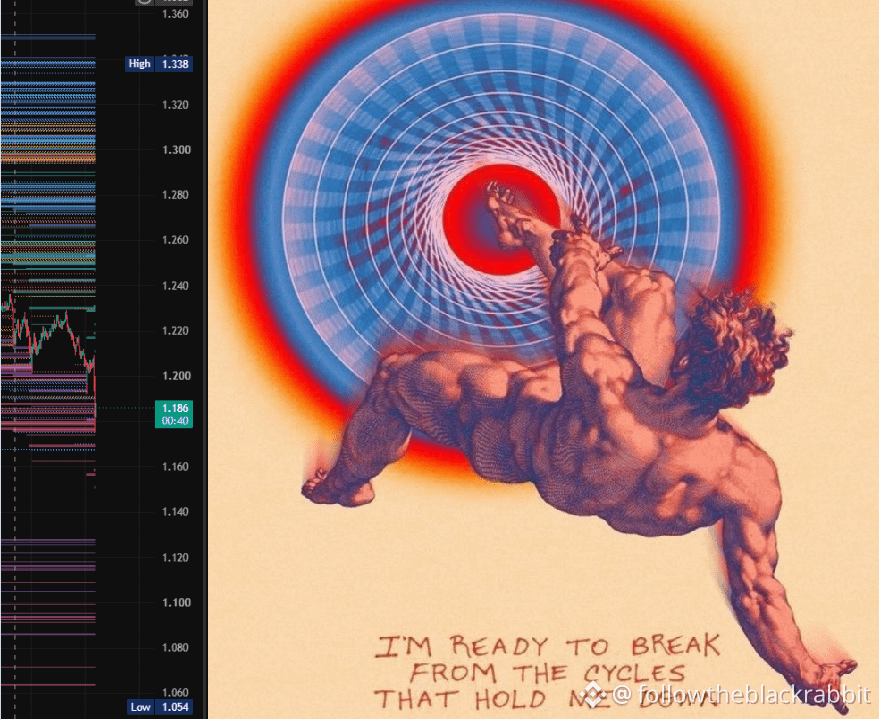
if it follows its usual pattern, it could sweep lower and bounce back up as usual. it doesn’t really look like it wants to push much higher, and the more time passes, the less likely it is to revisit those previous levels due to supply.
I’ll try a limit at 1.151, with full entry at 1.094. #RIVER #0xFTBR
{future}(RIVERUSDT)
🐰 waiting for $RIVER lower
if it follows its usual pattern, it could sweep lower and bounce back up as usual. it doesn’t really look like it wants to push much higher, and the more time passes, the less likely it is to revisit those previous levels due to supply.
I’ll try a limit at 1.151, with full entry at 1.094. #RIVER #0xFTBR
if it follows its usual pattern, it could sweep lower and bounce back up as usual. it doesn’t really look like it wants to push much higher, and the more time passes, the less likely it is to revisit those previous levels due to supply.
I’ll try a limit at 1.151, with full entry at 1.094. #RIVER #0xFTBR
3
732

ບົດຄວາມ
INDICATORS: THE RABBIT HOLE | RSIIndicators are like the seven deadly sins: believe in them or not, you probably know most of them.
There’s no limit to how many indicators you can learn. In fact, many traders create their own, and if they make them public, we can find them too. Most of the time, they’re combinations of different indicators, adapted to a specific strategy.
But without going down the rabbit hole of custom indicators, which is something we can get into later, there’s one thing worth understanding: less is more.
More information can be useful, but it can also work against you. Knowledge is power, but too much information creates confusion, and if you’re new to trading, it can leave you with more questions than answers.
And in trading, those doubts can cost you money.
There’s no indicator that can tell you exactly where to buy and where to sell without ever being wrong.
Most indicators are based on price action, so they’re constantly changing as price moves.
I’m starting with one indicator as the foundation of this series.
From here, we’ll look at different ways to use it and bring in more indicators along the way.
1. RSI
RSI stands for Relative Strength Index. It helps us understand the strength behind the current price move.
It compares recent gains with recent losses, giving us a way to measure momentum.
RSI moves between 0 and 100. As a general reference, when RSI is above 70, the asset is considered overbought (green line), while below 30, it is considered oversold (red line).
But overbought doesn’t automatically mean “sell,” and oversold doesn’t automatically mean “buy.” No indicator gives us a perfect entry or exit.
For this one, we’re using the standard 14-period setting. Don’t rush into changing it. Once you understand how it works, you can start experimenting. Using the standard values first is one of the best ways to actually test what you’re learning.
One thing worth paying attention to: RSI can stay overbought for quite a while when buying pressure is strong. It doesn’t have to reverse just because it crossed 70.
The same idea applies to oversold conditions in a strong downtrend.
Markets need to breathe, but RSI is better used as context than as a simple reversal signal.
A few RSI tips & curiosities 🐰
• J. Welles Wilder Jr. is the creator of the RSI.
• The formula is RSI = 100 − (100 / (1 + RS)), where RS compares average gains to average losses.
• Don’t assume that overbought = dump. In a strong uptrend, RSI can stay above 70 for a long time. The same applies to oversold conditions in a strong downtrend.
• A simple way to look at RSI is buying low and selling high, but I wouldn’t use it that way by itself. I like keeping the 50 level as a reference and watching whether RSI actually loses it before making a decision.
The main point: RSI alone is not enough. It can give plenty of false signals. But if 3 different indicators are pointing in the same direction, you have more arguments to check and test your hypothesis.
If you made it this far and you’re new to trading, you’re probably wondering: “How do I add this to my chart?”
Here you go 👇
To add the 50 line, click on the RSI like in the image below and press Alt + H.
Or use the side menu and click the horizontal line tool.
Click the line you just created, set the coordinate to 50, and that’s it. You now have your first argument available.
I’ll be building this little library step by step, so if you’re not following yet, feel free to join me and stay updated.
The pinned post is the [INDEX](https://www.binance.com/en/square/post/370913765509186) , where I’ll be collecting this kind of content so it doesn’t get lost between the daily trades, updates, and everything else I share.
Stay tuned. 🐰
#0xFTBR #BINANCE
INDICATORS: THE RABBIT HOLE | RSI
Indicators are like the seven deadly sins: believe in them or not, you probably know most of them.
There’s no limit to how many indicators you can learn. In fact, many traders create their own, and if they make them public, we can find them too. Most of the time, they’re combinations of different indicators, adapted to a specific strategy.
But without going down the rabbit hole of custom indicators, which is something we can get into later, there’s one thing worth understanding: less is more.
More information can be useful, but it can also work against you. Knowledge is power, but too much information creates confusion, and if you’re new to trading, it can leave you with more questions than answers.
And in trading, those doubts can cost you money.
There’s no indicator that can tell you exactly where to buy and where to sell without ever being wrong.
Most indicators are based on price action, so they’re constantly changing as price moves.
I’m starting with one indicator as the foundation of this series.
From here, we’ll look at different ways to use it and bring in more indicators along the way.
1. RSI
RSI stands for Relative Strength Index. It helps us understand the strength behind the current price move.
It compares recent gains with recent losses, giving us a way to measure momentum.
RSI moves between 0 and 100. As a general reference, when RSI is above 70, the asset is considered overbought (green line), while below 30, it is considered oversold (red line).
But overbought doesn’t automatically mean “sell,” and oversold doesn’t automatically mean “buy.” No indicator gives us a perfect entry or exit.
For this one, we’re using the standard 14-period setting. Don’t rush into changing it. Once you understand how it works, you can start experimenting. Using the standard values first is one of the best ways to actually test what you’re learning.
One thing worth paying attention to: RSI can stay overbought for quite a while when buying pressure is strong. It doesn’t have to reverse just because it crossed 70.
The same idea applies to oversold conditions in a strong downtrend.
Markets need to breathe, but RSI is better used as context than as a simple reversal signal.
A few RSI tips & curiosities 🐰
• J. Welles Wilder Jr. is the creator of the RSI.
• The formula is RSI = 100 − (100 / (1 + RS)), where RS compares average gains to average losses.
• Don’t assume that overbought = dump. In a strong uptrend, RSI can stay above 70 for a long time. The same applies to oversold conditions in a strong downtrend.
• A simple way to look at RSI is buying low and selling high, but I wouldn’t use it that way by itself. I like keeping the 50 level as a reference and watching whether RSI actually loses it before making a decision.
The main point: RSI alone is not enough. It can give plenty of false signals. But if 3 different indicators are pointing in the same direction, you have more arguments to check and test your hypothesis.
If you made it this far and you’re new to trading, you’re probably wondering: “How do I add this to my chart?”
Here you go 👇
To add the 50 line, click on the RSI like in the image below and press Alt + H.
Or use the side menu and click the horizontal line tool.
Click the line you just created, set the coordinate to 50, and that’s it. You now have your first argument available.
I’ll be building this little library step by step, so if you’re not following yet, feel free to join me and stay updated.
The pinned post is the INDEX , where I’ll be collecting this kind of content so it doesn’t get lost between the daily trades, updates, and everything else I share.
Stay tuned. 🐰
#0xFTBR #BINANCE
There’s no limit to how many indicators you can learn. In fact, many traders create their own, and if they make them public, we can find them too. Most of the time, they’re combinations of different indicators, adapted to a specific strategy.
But without going down the rabbit hole of custom indicators, which is something we can get into later, there’s one thing worth understanding: less is more.
More information can be useful, but it can also work against you. Knowledge is power, but too much information creates confusion, and if you’re new to trading, it can leave you with more questions than answers.
And in trading, those doubts can cost you money.
There’s no indicator that can tell you exactly where to buy and where to sell without ever being wrong.
Most indicators are based on price action, so they’re constantly changing as price moves.
I’m starting with one indicator as the foundation of this series.
From here, we’ll look at different ways to use it and bring in more indicators along the way.
1. RSI
RSI stands for Relative Strength Index. It helps us understand the strength behind the current price move.
It compares recent gains with recent losses, giving us a way to measure momentum.
RSI moves between 0 and 100. As a general reference, when RSI is above 70, the asset is considered overbought (green line), while below 30, it is considered oversold (red line).
But overbought doesn’t automatically mean “sell,” and oversold doesn’t automatically mean “buy.” No indicator gives us a perfect entry or exit.
For this one, we’re using the standard 14-period setting. Don’t rush into changing it. Once you understand how it works, you can start experimenting. Using the standard values first is one of the best ways to actually test what you’re learning.
One thing worth paying attention to: RSI can stay overbought for quite a while when buying pressure is strong. It doesn’t have to reverse just because it crossed 70.
The same idea applies to oversold conditions in a strong downtrend.
Markets need to breathe, but RSI is better used as context than as a simple reversal signal.
A few RSI tips & curiosities 🐰
• J. Welles Wilder Jr. is the creator of the RSI.
• The formula is RSI = 100 − (100 / (1 + RS)), where RS compares average gains to average losses.
• Don’t assume that overbought = dump. In a strong uptrend, RSI can stay above 70 for a long time. The same applies to oversold conditions in a strong downtrend.
• A simple way to look at RSI is buying low and selling high, but I wouldn’t use it that way by itself. I like keeping the 50 level as a reference and watching whether RSI actually loses it before making a decision.
The main point: RSI alone is not enough. It can give plenty of false signals. But if 3 different indicators are pointing in the same direction, you have more arguments to check and test your hypothesis.
If you made it this far and you’re new to trading, you’re probably wondering: “How do I add this to my chart?”
Here you go 👇
To add the 50 line, click on the RSI like in the image below and press Alt + H.
Or use the side menu and click the horizontal line tool.
Click the line you just created, set the coordinate to 50, and that’s it. You now have your first argument available.
I’ll be building this little library step by step, so if you’re not following yet, feel free to join me and stay updated.
The pinned post is the INDEX , where I’ll be collecting this kind of content so it doesn’t get lost between the daily trades, updates, and everything else I share.
Stay tuned. 🐰
#0xFTBR #BINANCE
2
216
ເຂົ້າສູ່ລະບົບເພື່ອສຳຫຼວດເນື້ອຫາເພີ່ມເຕີມ
ເຂົ້າຮ່ວມກຸ່ມຜູ້ໃຊ້ຄຣິບໂຕທົ່ວໂລກໃນ Binance Square.
⚡️ ໄດ້ຮັບຂໍ້ມູນຫຼ້າສຸດ ແລະ ທີ່ມີປະໂຫຍດກ່ຽວກັບຄຣິບໂຕ.
💬 ໄດ້ຮັບຄວາມໄວ້ວາງໃຈຈາກຕະຫຼາດແລກປ່ຽນຄຣິບໂຕທີ່ໃຫຍ່ທີ່ສຸດໃນໂລກ.
👍 ຄົ້ນຫາຂໍ້ມູນເຊີງເລິກທີ່ແທ້ຈາກນັກສ້າງທີ່ໄດ້ຮັບການຢືນຢັນ.
ອີເມວ / ເບີໂທລະສັບ
ຫົວຂໍ້ທີ່ກໍາລັງນິຍົມ
1
#GoldFallsTo$4144
1,096 views
35 ກຳລັງສົນທະນາ
2
#QNTFallsOver40%FromMorningHigh
6,687 views
266 ກຳລັງສົນທະນາ
3
#KospiFalls2.7%SamsungSKHynixDropOver5%
204 views
54 ກຳລັງສົນທະນາ
4
#BitgetCEOConfirms$388MStolenInHack
341 views
17 ກຳລັງສົນທະນາ
5
#BTCFallsBelow$83000
9,490 views
96 ກຳລັງສົນທະນາ
6
#BitgetDetailsSecurityIncidentTimeline
6,661 views
237 ກຳລັງສົນທະນາ
7
#BitcoinSpotETFs$2.39BWeeklyNetInflow
2,951 views
20 ກຳລັງສົນທະນາ
8
#FedProposesPaymentStablecoinRules
31,758 views
593 ກຳລັງສົນທະນາ
9
#ChinaMayLetAlibabaByteDanceBuyNvidiaChips
33,528 views
627 ກຳລັງສົນທະນາ
10
#USChinaRelease$30BTariffCutProductLists
3,335 views
49 ກຳລັງສົນທະນາ