
Nakamoto BS
816 Жариялаулар

Nakamoto BS
Хабарлау
Пайдаланушыны блоктау
🌍 Crypto & Trading 📊 Daily Analysis & Trading Opportunities 🚀 Subscribe and Follow Me to Discover New Opportunities 🎁 Surprises & Gifts Await You!
Ашық сауда
Жиі сауда жасайтын трейдер
2 жыл
265 Жазылым
455 Жазылушылар
1.4K+ лайк басылған
Жазбалар
Портфолио
Барлығы
Баға ұсыныстары
Видеолар
PINNED
·
--
Төмен (кемімелі)
🐸😂$PEPE Are you still dreaming of seeing PEPE reach $1? Or have you decided to hold your coins until that legendary day finally arrives?
Some of you are waiting for the big pump, while others are already imagining the profits! 🤣
As for me, I think I'll move from my place before PEPE ever reaches that price! Hahaha 😂
One dollar? Come on, friends, let's be a little realistic! 🚀🐸
#PEPE #Crypto #memecoins
🐸😂$PEPE Are you still dreaming of seeing PEPE reach $1? Or have you decided to hold your coins until that legendary day finally arrives?
Some of you are waiting for the big pump, while others are already imagining the profits! 🤣
As for me, I think I'll move from my place before PEPE ever reaches that price! Hahaha 😂
One dollar? Come on, friends, let's be a little realistic! 🚀🐸
#PEPE #Crypto #memecoins
Some of you are waiting for the big pump, while others are already imagining the profits! 🤣
As for me, I think I'll move from my place before PEPE ever reaches that price! Hahaha 😂
One dollar? Come on, friends, let's be a little realistic! 🚀🐸
#PEPE #Crypto #memecoins

149
12
319
303.1k
·
--
Жоғары (өспелі)
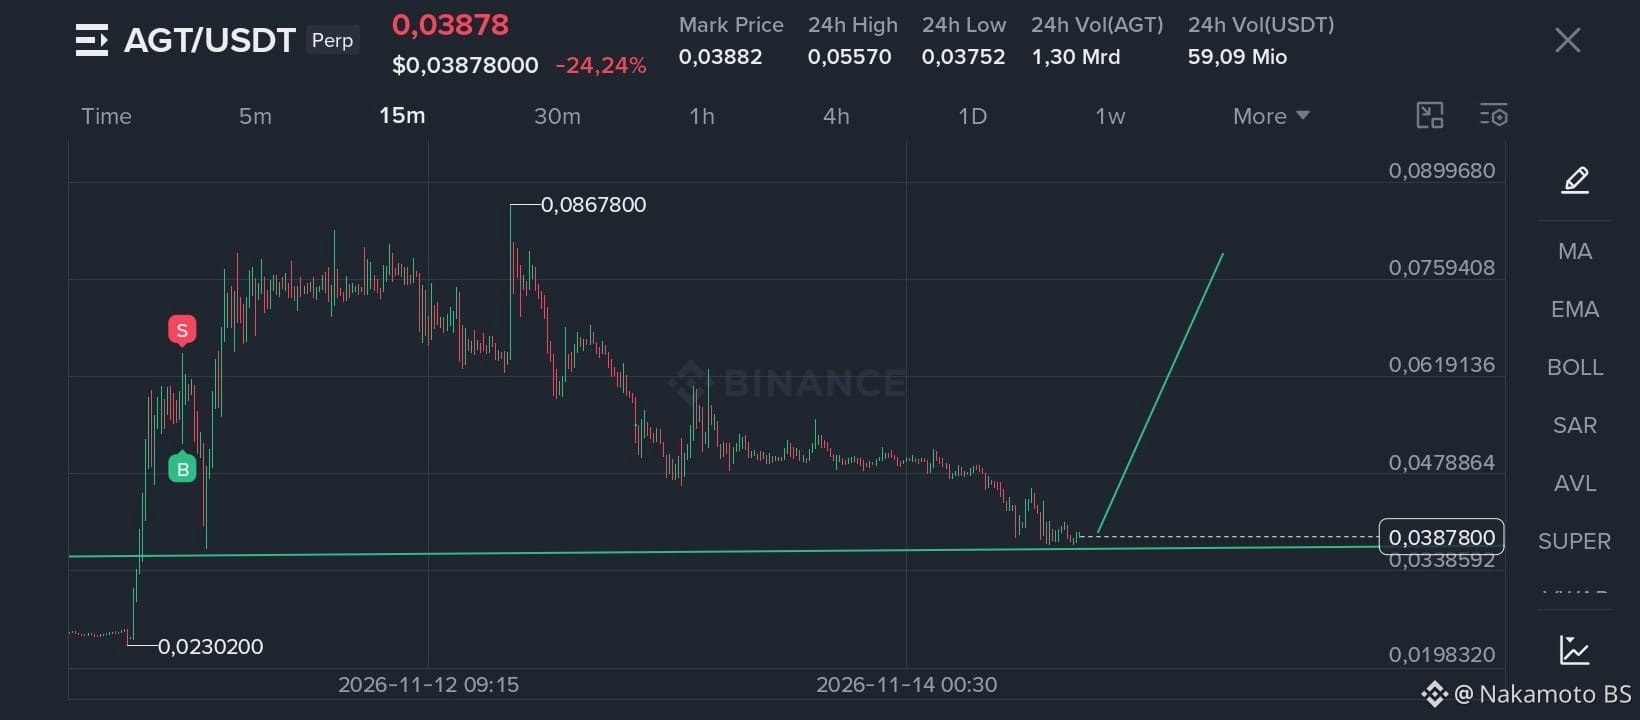
🚀 $AGT /USDT | Is the Price Preparing for a Bullish Rebound?
After analyzing AGT's price movement on the 15-minute timeframe, I noticed that the price has reached an important support zone that could trigger a rebound following the strong downward move.
📍 Support Zone: $0.03800 – $0.03385
🎯 Potential Resistance Targets:$AGT
TP1: $0.04788
TP2: $0.05570
TP3: $0.06191
TP4: $0.07594
🔍 What Do I See? I'm watching the price's ability to hold above the support zone and whether clear buying pressure emerges. Reclaiming $0.04788 would be the first important positive signal.
📌 My View: A rebound is possible, but I don't consider it a confirmed trend reversal yet. A break below $0.03385 could significantly weaken this scenario.
⚠️ I'll wait for confirmation before making any decision. The market rewards patience and discipline, not rushing into trades.
#AGT #Crypto #Binance
{future}(AGTUSDT)
🚀 $AGT /USDT | Is the Price Preparing for a Bullish Rebound?
After analyzing AGT's price movement on the 15-minute timeframe, I noticed that the price has reached an important support zone that could trigger a rebound following the strong downward move.
📍 Support Zone: $0.03800 – $0.03385
🎯 Potential Resistance Targets:$AGT
TP1: $0.04788
TP2: $0.05570
TP3: $0.06191
TP4: $0.07594
🔍 What Do I See? I'm watching the price's ability to hold above the support zone and whether clear buying pressure emerges. Reclaiming $0.04788 would be the first important positive signal.
📌 My View: A rebound is possible, but I don't consider it a confirmed trend reversal yet. A break below $0.03385 could significantly weaken this scenario.
⚠️ I'll wait for confirmation before making any decision. The market rewards patience and discipline, not rushing into trades.
#AGT #Crypto #Binance
After analyzing AGT's price movement on the 15-minute timeframe, I noticed that the price has reached an important support zone that could trigger a rebound following the strong downward move.
📍 Support Zone: $0.03800 – $0.03385
🎯 Potential Resistance Targets:$AGT
TP1: $0.04788
TP2: $0.05570
TP3: $0.06191
TP4: $0.07594
🔍 What Do I See? I'm watching the price's ability to hold above the support zone and whether clear buying pressure emerges. Reclaiming $0.04788 would be the first important positive signal.
📌 My View: A rebound is possible, but I don't consider it a confirmed trend reversal yet. A break below $0.03385 could significantly weaken this scenario.
⚠️ I'll wait for confirmation before making any decision. The market rewards patience and discipline, not rushing into trades.
#AGT #Crypto #Binance
20
·
--
Төмен (кемімелі)
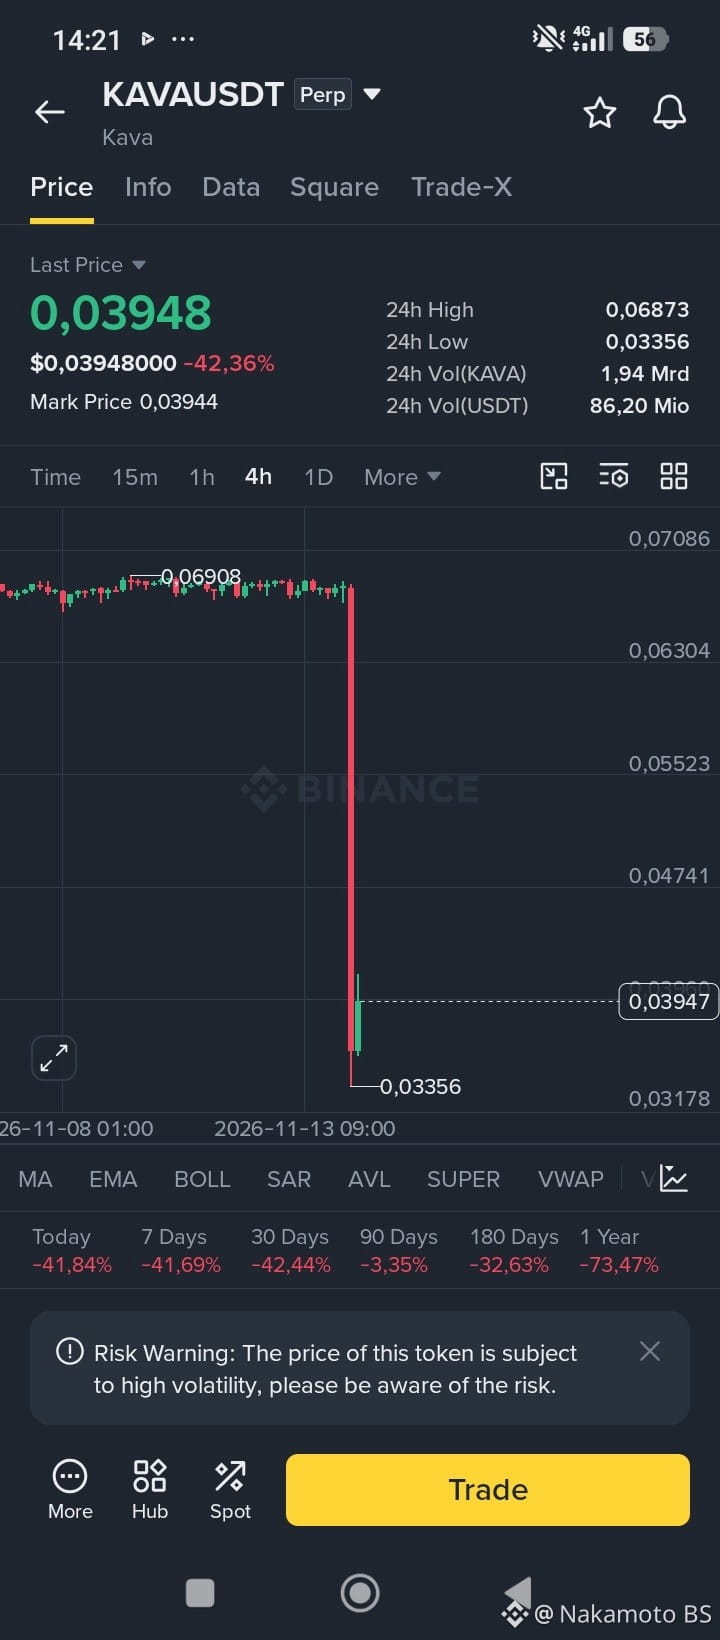
🐸😂 What Happened to KAVA?! Has It Decided to Leave the Market or Take a Shortcut Down?$KAVA
Guys, KAVA was trading near $0.069, then suddenly decided to drop to $0.03356, as if it discovered that the elevator is faster than the stairs! 🛗🤣
🐸 $KAVA says:
I've lost more than 42%. Is this a correction or a mass market evacuation?!
I've bounced back to $0.03948. Don't celebrate too much, I'm still trying to stand up! 😂
🔍 As for me, I'm watching:
Support: $0.03356
First resistance: $0.04741
Second resistance: $0.05523
📌 My View: I don't consider this rebound a confirmation of recovery. The coin is still in a sensitive situation, especially with the security concerns surrounding it.
😂 Conclusion: KAVA doesn't just need technical analysis; it needs a serious heart-to-heart conversation with the market!
🐸 KAVA community, are we waiting for its comeback, or should we send it an elevator to help it get back up? 🤣
#KAVA #Crypto #Binance
{future}(KAVAUSDT)
🐸😂 What Happened to KAVA?! Has It Decided to Leave the Market or Take a Shortcut Down?$KAVA
Guys, KAVA was trading near $0.069, then suddenly decided to drop to $0.03356, as if it discovered that the elevator is faster than the stairs! 🛗🤣
🐸 $KAVA says:
I've lost more than 42%. Is this a correction or a mass market evacuation?!
I've bounced back to $0.03948. Don't celebrate too much, I'm still trying to stand up! 😂
🔍 As for me, I'm watching:
Support: $0.03356
First resistance: $0.04741
Second resistance: $0.05523
📌 My View: I don't consider this rebound a confirmation of recovery. The coin is still in a sensitive situation, especially with the security concerns surrounding it.
😂 Conclusion: KAVA doesn't just need technical analysis; it needs a serious heart-to-heart conversation with the market!
🐸 KAVA community, are we waiting for its comeback, or should we send it an elevator to help it get back up? 🤣
#KAVA #Crypto #Binance
Guys, KAVA was trading near $0.069, then suddenly decided to drop to $0.03356, as if it discovered that the elevator is faster than the stairs! 🛗🤣
🐸 $KAVA says:
I've lost more than 42%. Is this a correction or a mass market evacuation?!
I've bounced back to $0.03948. Don't celebrate too much, I'm still trying to stand up! 😂
🔍 As for me, I'm watching:
Support: $0.03356
First resistance: $0.04741
Second resistance: $0.05523
📌 My View: I don't consider this rebound a confirmation of recovery. The coin is still in a sensitive situation, especially with the security concerns surrounding it.
😂 Conclusion: KAVA doesn't just need technical analysis; it needs a serious heart-to-heart conversation with the market!
🐸 KAVA community, are we waiting for its comeback, or should we send it an elevator to help it get back up? 🤣
#KAVA #Crypto #Binance
14
·
--
Төмен (кемімелі)
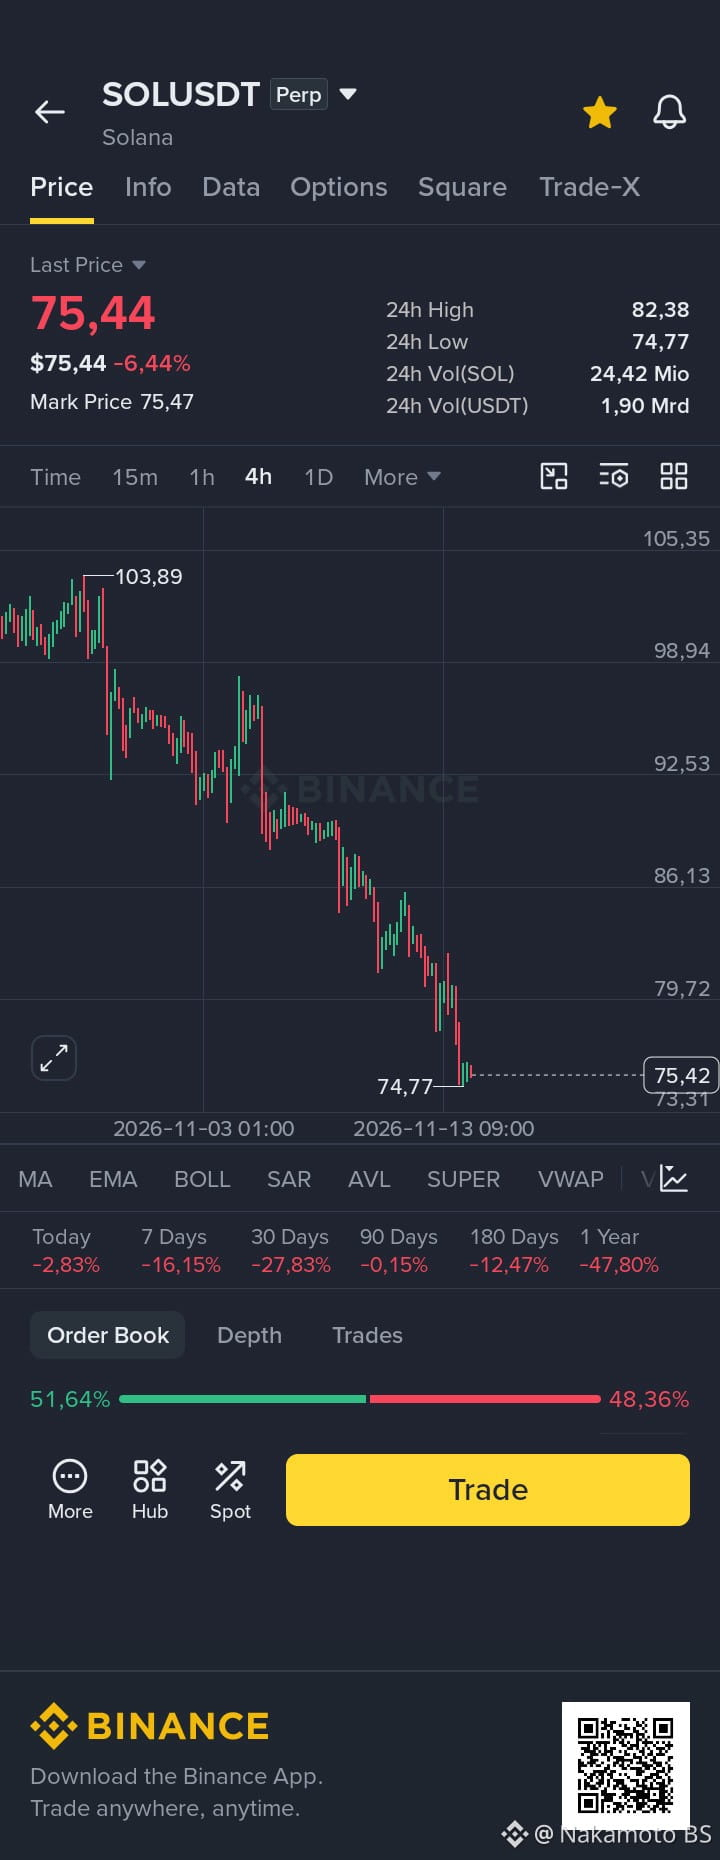
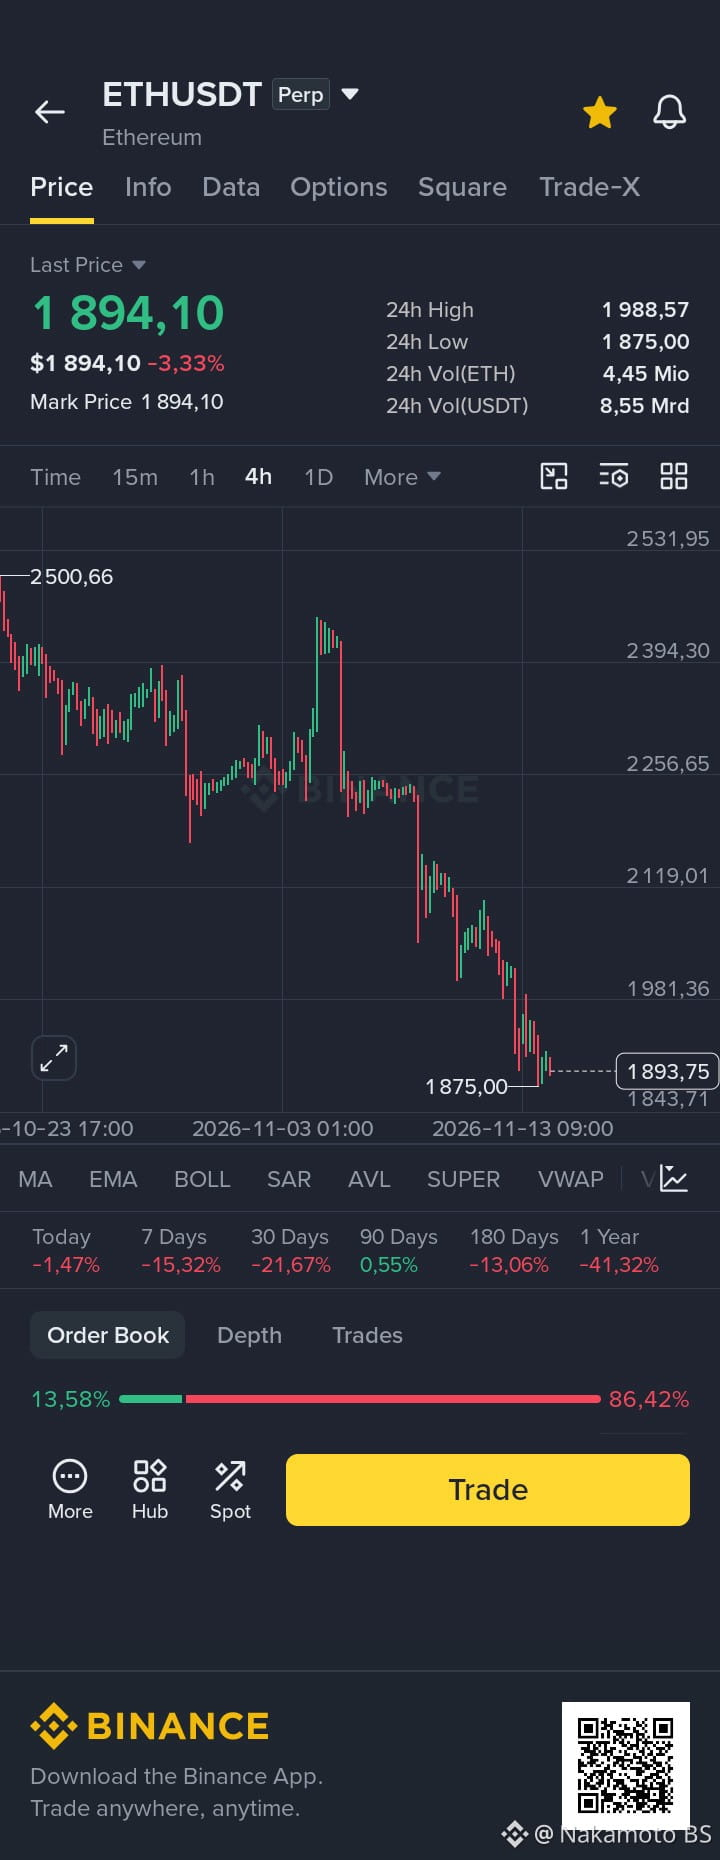
📊 My Analysis of BTC – ETH – SOL | Will the Downtrend Continue or Will We See a Rebound
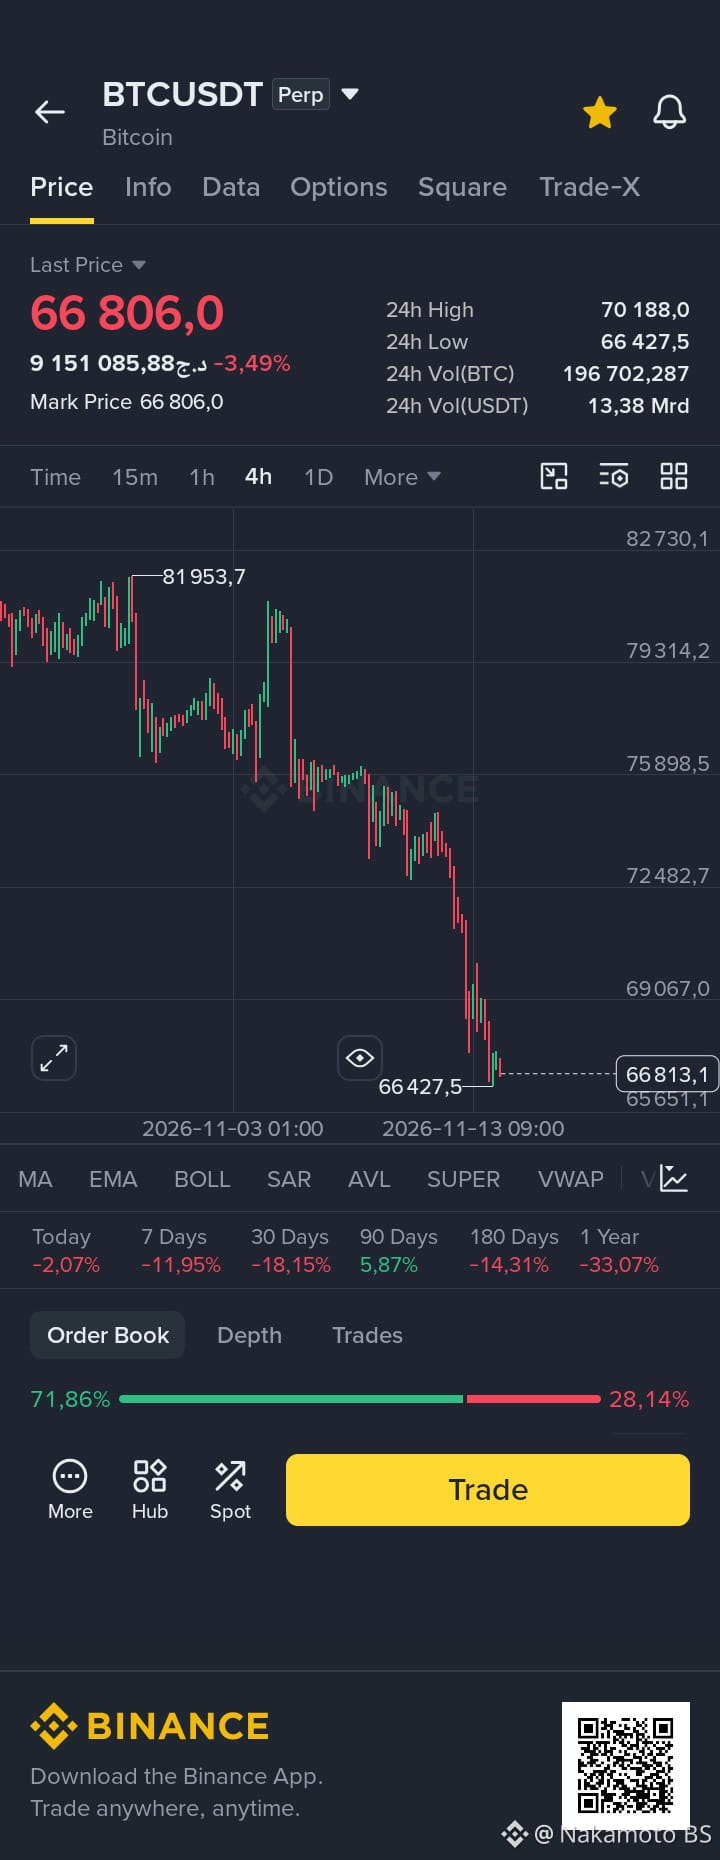
I analyzed the three cryptocurrencies on the 4-hour timeframe and noticed a clear similarity in their trends, with selling pressure dominating as prices continue to form lower highs and lower lows.
🔶 $BTC – Bitcoin
Support: $66,427 – $65,651
Resistance: $69,067 – $72,482
🔷 $ETH – Ethereum
Support: $1,875 – $1,843
Resistance: $1,981 – $2,119
🟣 $SOL – Solana
Support: $74.77 – $73.31
Resistance: $79.72 – $86.13
What Do I See?
I believe all three cryptocurrencies are still in a downtrend.
I notice that Bitcoin is attempting to stabilize near its support zone.
Ethereum is still facing continuous selling pressure.
Solana is showing greater weakness in the current market movement compared to the other two cryptocurrencies.
My Conclusion: In my view, there is still no confirmed signal of a trend reversal. I will monitor the support zones and the ability of prices to reclaim key resistance levels before considering any rebound the beginning of a genuine recovery.
I don't rush into decisions. For me, confirming the trend is far more important than simply predicting it.
#Bitcoin #Ethereum #solana
{future}(BTCUSDT)
{future}(ETHUSDT)
{future}(SOLUSDT)
📊 My Analysis of BTC – ETH – SOL | Will the Downtrend Continue or Will We See a Rebound
I analyzed the three cryptocurrencies on the 4-hour timeframe and noticed a clear similarity in their trends, with selling pressure dominating as prices continue to form lower highs and lower lows.
🔶 $BTC – Bitcoin
Support: $66,427 – $65,651
Resistance: $69,067 – $72,482
🔷 $ETH – Ethereum
Support: $1,875 – $1,843
Resistance: $1,981 – $2,119
🟣 $SOL – Solana
Support: $74.77 – $73.31
Resistance: $79.72 – $86.13
What Do I See?
I believe all three cryptocurrencies are still in a downtrend.
I notice that Bitcoin is attempting to stabilize near its support zone.
Ethereum is still facing continuous selling pressure.
Solana is showing greater weakness in the current market movement compared to the other two cryptocurrencies.
My Conclusion: In my view, there is still no confirmed signal of a trend reversal. I will monitor the support zones and the ability of prices to reclaim key resistance levels before considering any rebound the beginning of a genuine recovery.
I don't rush into decisions. For me, confirming the trend is far more important than simply predicting it.
#Bitcoin #Ethereum #solana
I analyzed the three cryptocurrencies on the 4-hour timeframe and noticed a clear similarity in their trends, with selling pressure dominating as prices continue to form lower highs and lower lows.
🔶 $BTC – Bitcoin
Support: $66,427 – $65,651
Resistance: $69,067 – $72,482
🔷 $ETH – Ethereum
Support: $1,875 – $1,843
Resistance: $1,981 – $2,119
🟣 $SOL – Solana
Support: $74.77 – $73.31
Resistance: $79.72 – $86.13
What Do I See?
I believe all three cryptocurrencies are still in a downtrend.
I notice that Bitcoin is attempting to stabilize near its support zone.
Ethereum is still facing continuous selling pressure.
Solana is showing greater weakness in the current market movement compared to the other two cryptocurrencies.
My Conclusion: In my view, there is still no confirmed signal of a trend reversal. I will monitor the support zones and the ability of prices to reclaim key resistance levels before considering any rebound the beginning of a genuine recovery.
I don't rush into decisions. For me, confirming the trend is far more important than simply predicting it.
#Bitcoin #Ethereum #solana
26
·
--
Төмен (кемімелі)
🐸😂 A Conversation with PEPE...
Us: PEPE, move a little! We're waiting to see you at $1! 💵🚀 $PEPE
PEPE: One dollar?! Are you serious?! 😂
Us: Yes! We have big dreams and unlimited confidence!
PEPE: But do you know there are more than 413 trillion PEPE tokens in circulation?! 🤔
Us: We know that... but don't ruin our dreams! 🤣
PEPE: If every token reached $1, you'd need a market cap of over $413 trillion!
Us: No problem! Just start removing a few zeros! 😂
PEPE: I'll think about it... but don't forget, I'm a meme coin, not a dream-making machine! 🐸
💚 PEPE community, are we waiting for a miracle, or should we settle for removing one or two zeros first? 😂
#PEPE #Crypto #memecoins
{spot}(PEPEUSDT)
🐸😂 A Conversation with PEPE...
Us: PEPE, move a little! We're waiting to see you at $1! 💵🚀 $PEPE
PEPE: One dollar?! Are you serious?! 😂
Us: Yes! We have big dreams and unlimited confidence!
PEPE: But do you know there are more than 413 trillion PEPE tokens in circulation?! 🤔
Us: We know that... but don't ruin our dreams! 🤣
PEPE: If every token reached $1, you'd need a market cap of over $413 trillion!
Us: No problem! Just start removing a few zeros! 😂
PEPE: I'll think about it... but don't forget, I'm a meme coin, not a dream-making machine! 🐸
💚 PEPE community, are we waiting for a miracle, or should we settle for removing one or two zeros first? 😂
#PEPE #Crypto #memecoins
Us: PEPE, move a little! We're waiting to see you at $1! 💵🚀 $PEPE
PEPE: One dollar?! Are you serious?! 😂
Us: Yes! We have big dreams and unlimited confidence!
PEPE: But do you know there are more than 413 trillion PEPE tokens in circulation?! 🤔
Us: We know that... but don't ruin our dreams! 🤣
PEPE: If every token reached $1, you'd need a market cap of over $413 trillion!
Us: No problem! Just start removing a few zeros! 😂
PEPE: I'll think about it... but don't forget, I'm a meme coin, not a dream-making machine! 🐸
💚 PEPE community, are we waiting for a miracle, or should we settle for removing one or two zeros first? 😂
#PEPE #Crypto #memecoins

42
·
--
Төмен (кемімелі)
📊 In-Depth Bitcoin Analysis $BTC USDT | Key Indicators and Levels to Watch
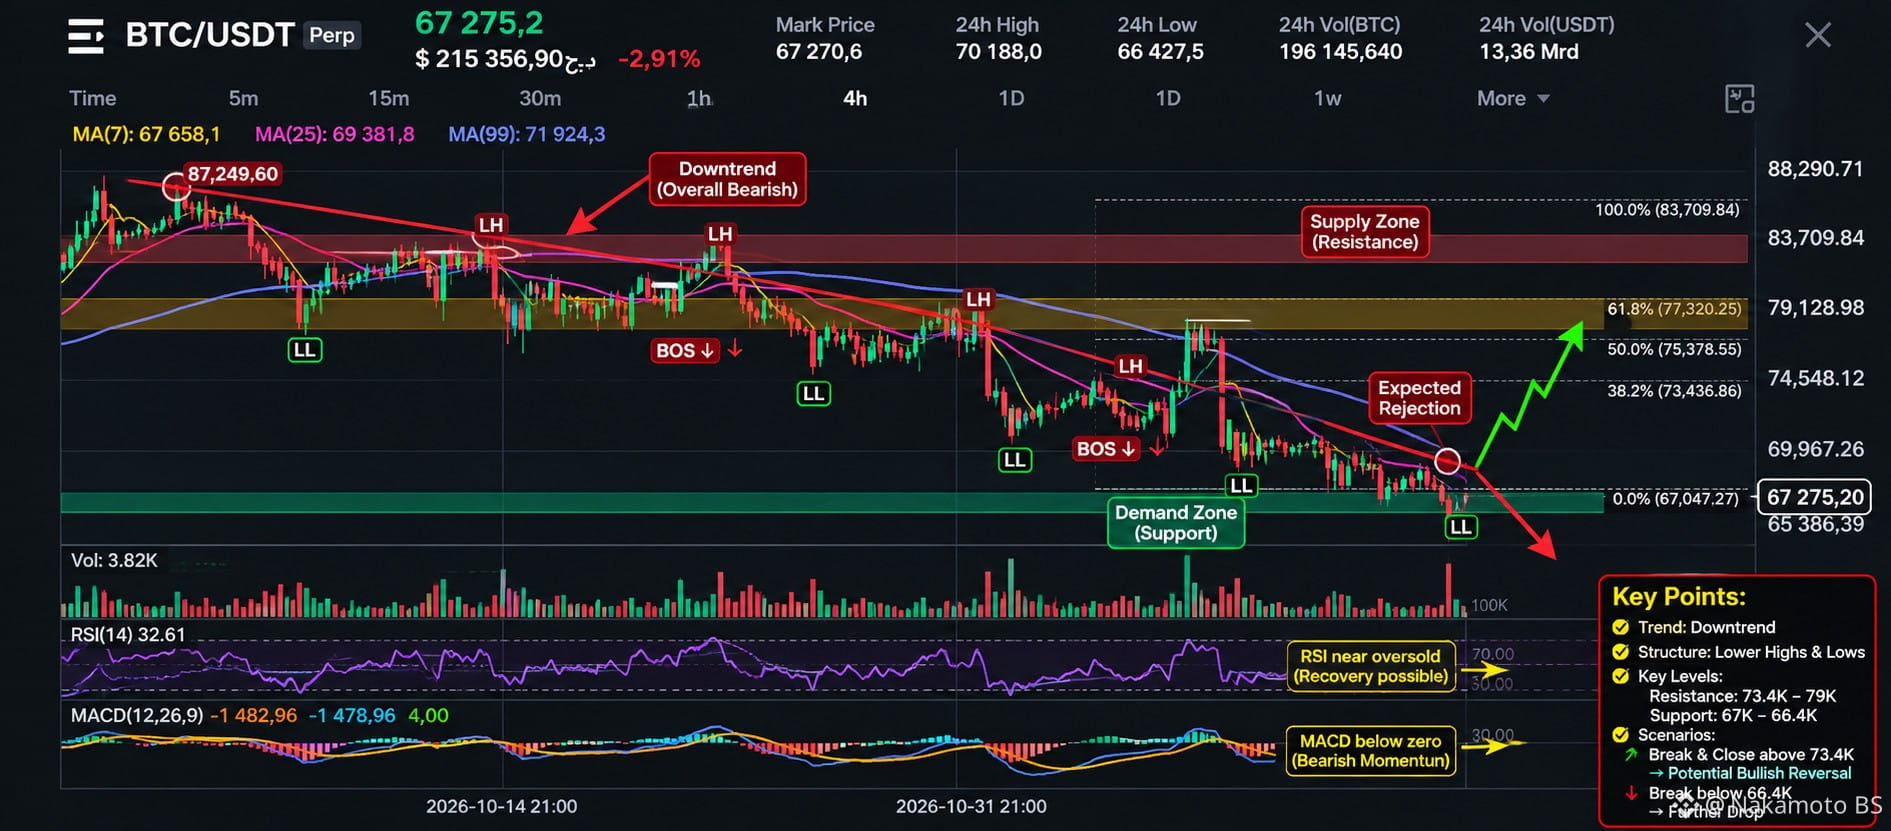
I conducted an in-depth analysis of Bitcoin's price action on the 4-hour timeframe, focusing on market structure, overall trend, liquidity zones, support and resistance levels, as well as momentum indicators. Here are the key findings:
📉 Overall Trend:$BTC
The trend remains bearish, with lower highs and lower lows continuing to form, indicating that sellers are still in control.
🎯 Key Levels:$BTC
- Current support: $66,400 – $67,000.
- Next support: $65,386.
- First resistance: $69,967.
- Major resistance: $74,548.
- Strong supply zone: $79,128.
🔍 What Do I See?
- RSI at 32.61, approaching oversold territory.
- MACD below zero, reflecting continued bearish momentum.
- Moving averages indicate that the overall trend remains weak.
👀 What Am I Watching Now?
🟢 A breakout above $73,400 and holding above this level could open the door to a gradual recovery.
🔴 A break below $66,400 could push the price into another downward move.
Conclusion: I don't think rushing into a trade is the best decision right now. I prefer to wait for trend confirmation before making any move. Protecting capital is more important than chasing every market movement.
#BTC #Bitcoin #CryptoAnalysis
{future}(BTCUSDT)
📊 In-Depth Bitcoin Analysis $BTC USDT | Key Indicators and Levels to Watch
I conducted an in-depth analysis of Bitcoin's price action on the 4-hour timeframe, focusing on market structure, overall trend, liquidity zones, support and resistance levels, as well as momentum indicators. Here are the key findings:
📉 Overall Trend:$BTC
The trend remains bearish, with lower highs and lower lows continuing to form, indicating that sellers are still in control.
🎯 Key Levels:$BTC
- Current support: $66,400 – $67,000.
- Next support: $65,386.
- First resistance: $69,967.
- Major resistance: $74,548.
- Strong supply zone: $79,128.
🔍 What Do I See?
- RSI at 32.61, approaching oversold territory.
- MACD below zero, reflecting continued bearish momentum.
- Moving averages indicate that the overall trend remains weak.
👀 What Am I Watching Now?
🟢 A breakout above $73,400 and holding above this level could open the door to a gradual recovery.
🔴 A break below $66,400 could push the price into another downward move.
Conclusion: I don't think rushing into a trade is the best decision right now. I prefer to wait for trend confirmation before making any move. Protecting capital is more important than chasing every market movement.
#BTC #Bitcoin #CryptoAnalysis
I conducted an in-depth analysis of Bitcoin's price action on the 4-hour timeframe, focusing on market structure, overall trend, liquidity zones, support and resistance levels, as well as momentum indicators. Here are the key findings:
📉 Overall Trend:$BTC
The trend remains bearish, with lower highs and lower lows continuing to form, indicating that sellers are still in control.
🎯 Key Levels:$BTC
- Current support: $66,400 – $67,000.
- Next support: $65,386.
- First resistance: $69,967.
- Major resistance: $74,548.
- Strong supply zone: $79,128.
🔍 What Do I See?
- RSI at 32.61, approaching oversold territory.
- MACD below zero, reflecting continued bearish momentum.
- Moving averages indicate that the overall trend remains weak.
👀 What Am I Watching Now?
🟢 A breakout above $73,400 and holding above this level could open the door to a gradual recovery.
🔴 A break below $66,400 could push the price into another downward move.
Conclusion: I don't think rushing into a trade is the best decision right now. I prefer to wait for trend confirmation before making any move. Protecting capital is more important than chasing every market movement.
#BTC #Bitcoin #CryptoAnalysis
20
·
--
Жоғары (өспелі)
🚨 All Eyes Are Now on AKE ($AKE DO)! Are We About to See Another Bullish Move?
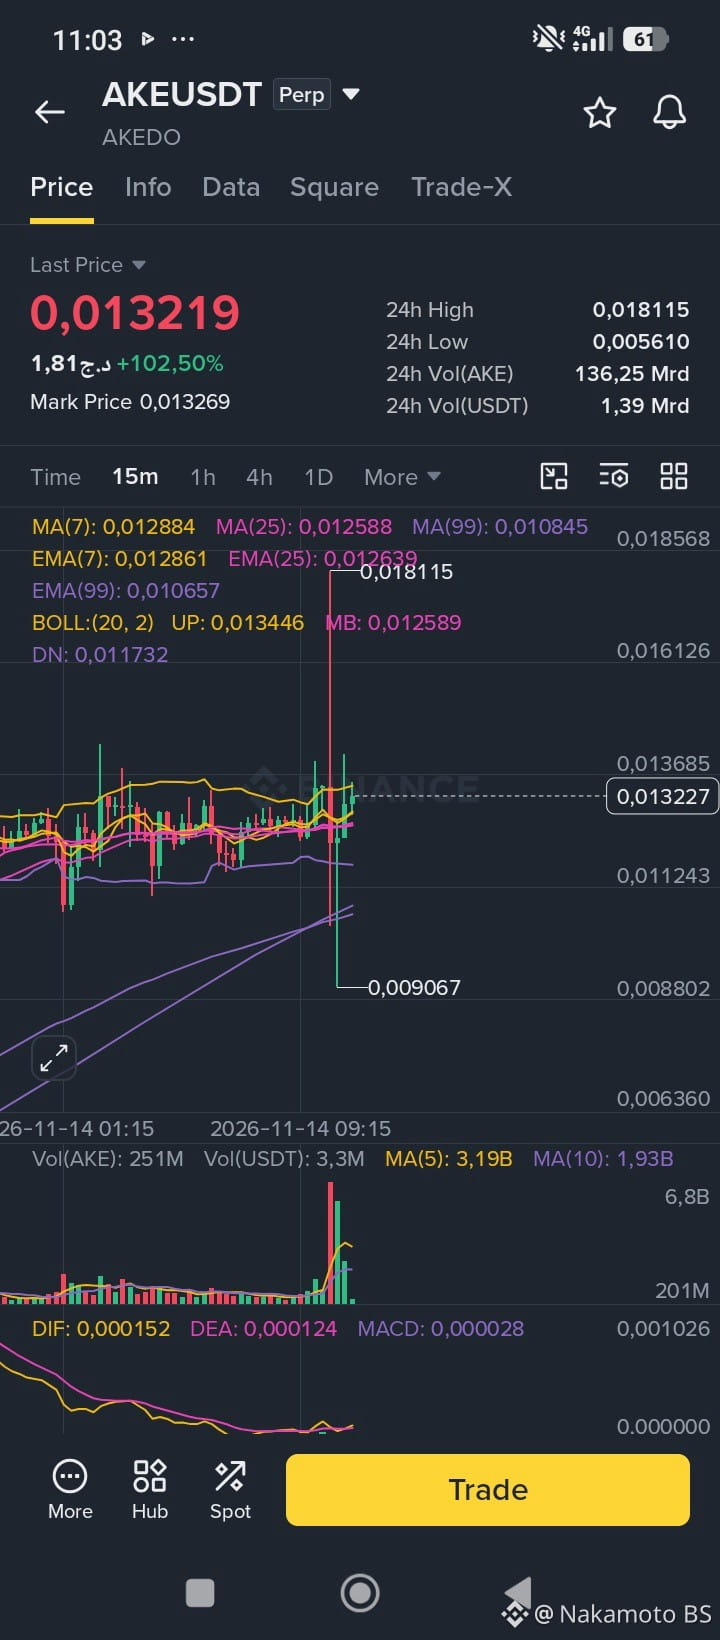
I am closely monitoring AKE after its strong rally of more than 104% in 24 hours, reaching $0.018115 before pulling back to around $0.01336. What matters to me now is not the previous rally, but whether buyers can regain momentum and overcome selling pressure at current levels.
Looking at my analysis on the 15-minute timeframe, I notice that the price is still trading above the MA7, MA25, and MA99 moving averages, while the MACD indicator remains positive. However, I am not ignoring the long candle wicks near the high, as they indicate rejection of higher prices and the presence of profit-taking. That is why I believe the current phase requires close monitoring before making any decision.
These are the key levels I am watching right now:$AKE
$0.0129 – $0.0126: The first support zone where I am watching for price stability.
$0.0117: An important level; breaking below it could change the short-term technical picture.
$0.0108 – $0.0106: The next support zone if the correction continues.
$0.0135 – $0.0140: The first resistance I am watching for a breakout.
$0.0150 – $0.0157: The next zone I have on my radar as a potential upside target.
$0.018115: The previous high; a confirmed breakout above it could open the way toward $0.020.
Personally, I will not chase the price after a rally of more than 100%. I prefer to wait for a retest and monitor trading volume and liquidity, then look for a well-planned entry after a confirmed breakout. To me, a professional trader does not chase green candles; instead, they wait for opportunities that offer a clear advantage relative to the risk.
Now I want to hear your analysis: Do you think AKE can regain its momentum and break above $0.018115 to reach $0.020, or is the correction not over yet? 👀📊
#AKE #AKEDO #cryptotrading
{future}(AKEUSDT)
🚨 All Eyes Are Now on AKE ($AKE DO)! Are We About to See Another Bullish Move?
I am closely monitoring AKE after its strong rally of more than 104% in 24 hours, reaching $0.018115 before pulling back to around $0.01336. What matters to me now is not the previous rally, but whether buyers can regain momentum and overcome selling pressure at current levels.
Looking at my analysis on the 15-minute timeframe, I notice that the price is still trading above the MA7, MA25, and MA99 moving averages, while the MACD indicator remains positive. However, I am not ignoring the long candle wicks near the high, as they indicate rejection of higher prices and the presence of profit-taking. That is why I believe the current phase requires close monitoring before making any decision.
These are the key levels I am watching right now:$AKE
$0.0129 – $0.0126: The first support zone where I am watching for price stability.
$0.0117: An important level; breaking below it could change the short-term technical picture.
$0.0108 – $0.0106: The next support zone if the correction continues.
$0.0135 – $0.0140: The first resistance I am watching for a breakout.
$0.0150 – $0.0157: The next zone I have on my radar as a potential upside target.
$0.018115: The previous high; a confirmed breakout above it could open the way toward $0.020.
Personally, I will not chase the price after a rally of more than 100%. I prefer to wait for a retest and monitor trading volume and liquidity, then look for a well-planned entry after a confirmed breakout. To me, a professional trader does not chase green candles; instead, they wait for opportunities that offer a clear advantage relative to the risk.
Now I want to hear your analysis: Do you think AKE can regain its momentum and break above $0.018115 to reach $0.020, or is the correction not over yet? 👀📊
#AKE #AKEDO #cryptotrading
I am closely monitoring AKE after its strong rally of more than 104% in 24 hours, reaching $0.018115 before pulling back to around $0.01336. What matters to me now is not the previous rally, but whether buyers can regain momentum and overcome selling pressure at current levels.
Looking at my analysis on the 15-minute timeframe, I notice that the price is still trading above the MA7, MA25, and MA99 moving averages, while the MACD indicator remains positive. However, I am not ignoring the long candle wicks near the high, as they indicate rejection of higher prices and the presence of profit-taking. That is why I believe the current phase requires close monitoring before making any decision.
These are the key levels I am watching right now:$AKE
$0.0129 – $0.0126: The first support zone where I am watching for price stability.
$0.0117: An important level; breaking below it could change the short-term technical picture.
$0.0108 – $0.0106: The next support zone if the correction continues.
$0.0135 – $0.0140: The first resistance I am watching for a breakout.
$0.0150 – $0.0157: The next zone I have on my radar as a potential upside target.
$0.018115: The previous high; a confirmed breakout above it could open the way toward $0.020.
Personally, I will not chase the price after a rally of more than 100%. I prefer to wait for a retest and monitor trading volume and liquidity, then look for a well-planned entry after a confirmed breakout. To me, a professional trader does not chase green candles; instead, they wait for opportunities that offer a clear advantage relative to the risk.
Now I want to hear your analysis: Do you think AKE can regain its momentum and break above $0.018115 to reach $0.020, or is the correction not over yet? 👀📊
#AKE #AKEDO #cryptotrading
61
·
--
Мақала
🚨 Guys, the alarm bells are ringing! 🔔$BTC 😱😱😱😱
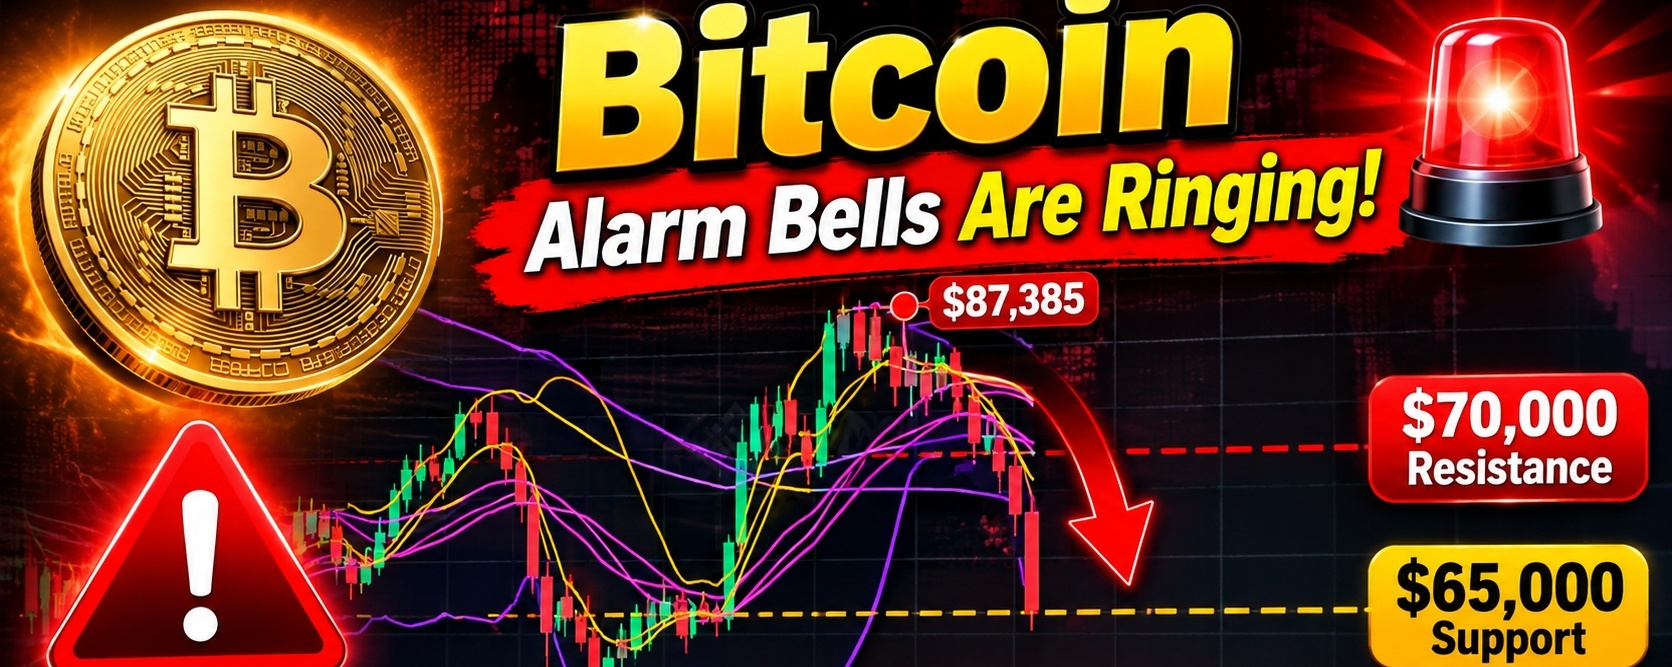
Guys, what is happening with Bitcoin right now deserves our attention. The coin has lost the $70,000 level and has fallen to around $67,000 following a strong selling wave that has lasted for several weeks. Looking at the 3-day chart, we can see that the price has broken below several important moving averages, while the MACD indicator remains in negative territory. In my view, this is not just an ordinary market movement that we can ignore; it is a sign that sellers are still controlling the market.
And this is not just about technical analysis; there are real economic pressures behind this decline. US inflation data for October came in higher than expected, bringing back concerns about interest rate hikes by the Federal Reserve, alongside rising US Treasury yields and a stronger dollar. In addition, spot Bitcoin ETFs have experienced significant outflows, reaching approximately $1.57 billion over five trading sessions, while leveraged long positions have faced a wave of liquidations. All these factors make a recovery more challenging at the moment.
From a technical perspective, I believe the $66,400–$65,000 zone has become one of the most important areas to watch. Losing this range could open the door toward $62,700, and possibly $60,000 if selling pressure continues. On the other hand, if Bitcoin manages to reclaim $70,000, then break above $72,000 and hold above it, we could see a rebound toward $74,000 and then $77,500. Here, we must distinguish between a temporary bounce and a genuine trend reversal.
As for the outlook, the latest CoinShares report places the base-case scenario within a broad range of $60,000 to $90,000, with sideways movement remaining a possibility unless a strong catalyst changes the market's direction. Meanwhile, StoneX analysis highlights $65,000 as an important support level. Personally, I would not rush into buying simply because the price has dropped, and I would not consider every rebound the beginning of a new bull market. I want to see liquidity returning, institutional fund flows improving, and key resistance levels being reclaimed before changing my market outlook.
Here is the question I want to ask you: Do you think Bitcoin is preparing for a strong rebound before the end of November, or are we facing another wave of selling that could take it down to $60,000 or even lower? 📉📈
#Bitcoin #BTC #CryptoMarket
{spot}(BTCUSDT)
🚨 Guys, the alarm bells are ringing! 🔔
$BTC 😱😱😱😱
Guys, what is happening with Bitcoin right now deserves our attention. The coin has lost the $70,000 level and has fallen to around $67,000 following a strong selling wave that has lasted for several weeks. Looking at the 3-day chart, we can see that the price has broken below several important moving averages, while the MACD indicator remains in negative territory. In my view, this is not just an ordinary market movement that we can ignore; it is a sign that sellers are still controlling the market.
And this is not just about technical analysis; there are real economic pressures behind this decline. US inflation data for October came in higher than expected, bringing back concerns about interest rate hikes by the Federal Reserve, alongside rising US Treasury yields and a stronger dollar. In addition, spot Bitcoin ETFs have experienced significant outflows, reaching approximately $1.57 billion over five trading sessions, while leveraged long positions have faced a wave of liquidations. All these factors make a recovery more challenging at the moment.
From a technical perspective, I believe the $66,400–$65,000 zone has become one of the most important areas to watch. Losing this range could open the door toward $62,700, and possibly $60,000 if selling pressure continues. On the other hand, if Bitcoin manages to reclaim $70,000, then break above $72,000 and hold above it, we could see a rebound toward $74,000 and then $77,500. Here, we must distinguish between a temporary bounce and a genuine trend reversal.
As for the outlook, the latest CoinShares report places the base-case scenario within a broad range of $60,000 to $90,000, with sideways movement remaining a possibility unless a strong catalyst changes the market's direction. Meanwhile, StoneX analysis highlights $65,000 as an important support level. Personally, I would not rush into buying simply because the price has dropped, and I would not consider every rebound the beginning of a new bull market. I want to see liquidity returning, institutional fund flows improving, and key resistance levels being reclaimed before changing my market outlook.
Here is the question I want to ask you: Do you think Bitcoin is preparing for a strong rebound before the end of November, or are we facing another wave of selling that could take it down to $60,000 or even lower? 📉📈
#Bitcoin #BTC #CryptoMarket
Guys, what is happening with Bitcoin right now deserves our attention. The coin has lost the $70,000 level and has fallen to around $67,000 following a strong selling wave that has lasted for several weeks. Looking at the 3-day chart, we can see that the price has broken below several important moving averages, while the MACD indicator remains in negative territory. In my view, this is not just an ordinary market movement that we can ignore; it is a sign that sellers are still controlling the market.
And this is not just about technical analysis; there are real economic pressures behind this decline. US inflation data for October came in higher than expected, bringing back concerns about interest rate hikes by the Federal Reserve, alongside rising US Treasury yields and a stronger dollar. In addition, spot Bitcoin ETFs have experienced significant outflows, reaching approximately $1.57 billion over five trading sessions, while leveraged long positions have faced a wave of liquidations. All these factors make a recovery more challenging at the moment.
From a technical perspective, I believe the $66,400–$65,000 zone has become one of the most important areas to watch. Losing this range could open the door toward $62,700, and possibly $60,000 if selling pressure continues. On the other hand, if Bitcoin manages to reclaim $70,000, then break above $72,000 and hold above it, we could see a rebound toward $74,000 and then $77,500. Here, we must distinguish between a temporary bounce and a genuine trend reversal.
As for the outlook, the latest CoinShares report places the base-case scenario within a broad range of $60,000 to $90,000, with sideways movement remaining a possibility unless a strong catalyst changes the market's direction. Meanwhile, StoneX analysis highlights $65,000 as an important support level. Personally, I would not rush into buying simply because the price has dropped, and I would not consider every rebound the beginning of a new bull market. I want to see liquidity returning, institutional fund flows improving, and key resistance levels being reclaimed before changing my market outlook.
Here is the question I want to ask you: Do you think Bitcoin is preparing for a strong rebound before the end of November, or are we facing another wave of selling that could take it down to $60,000 or even lower? 📉📈
#Bitcoin #BTC #CryptoMarket
77
·
--
Жоғары (өспелі)
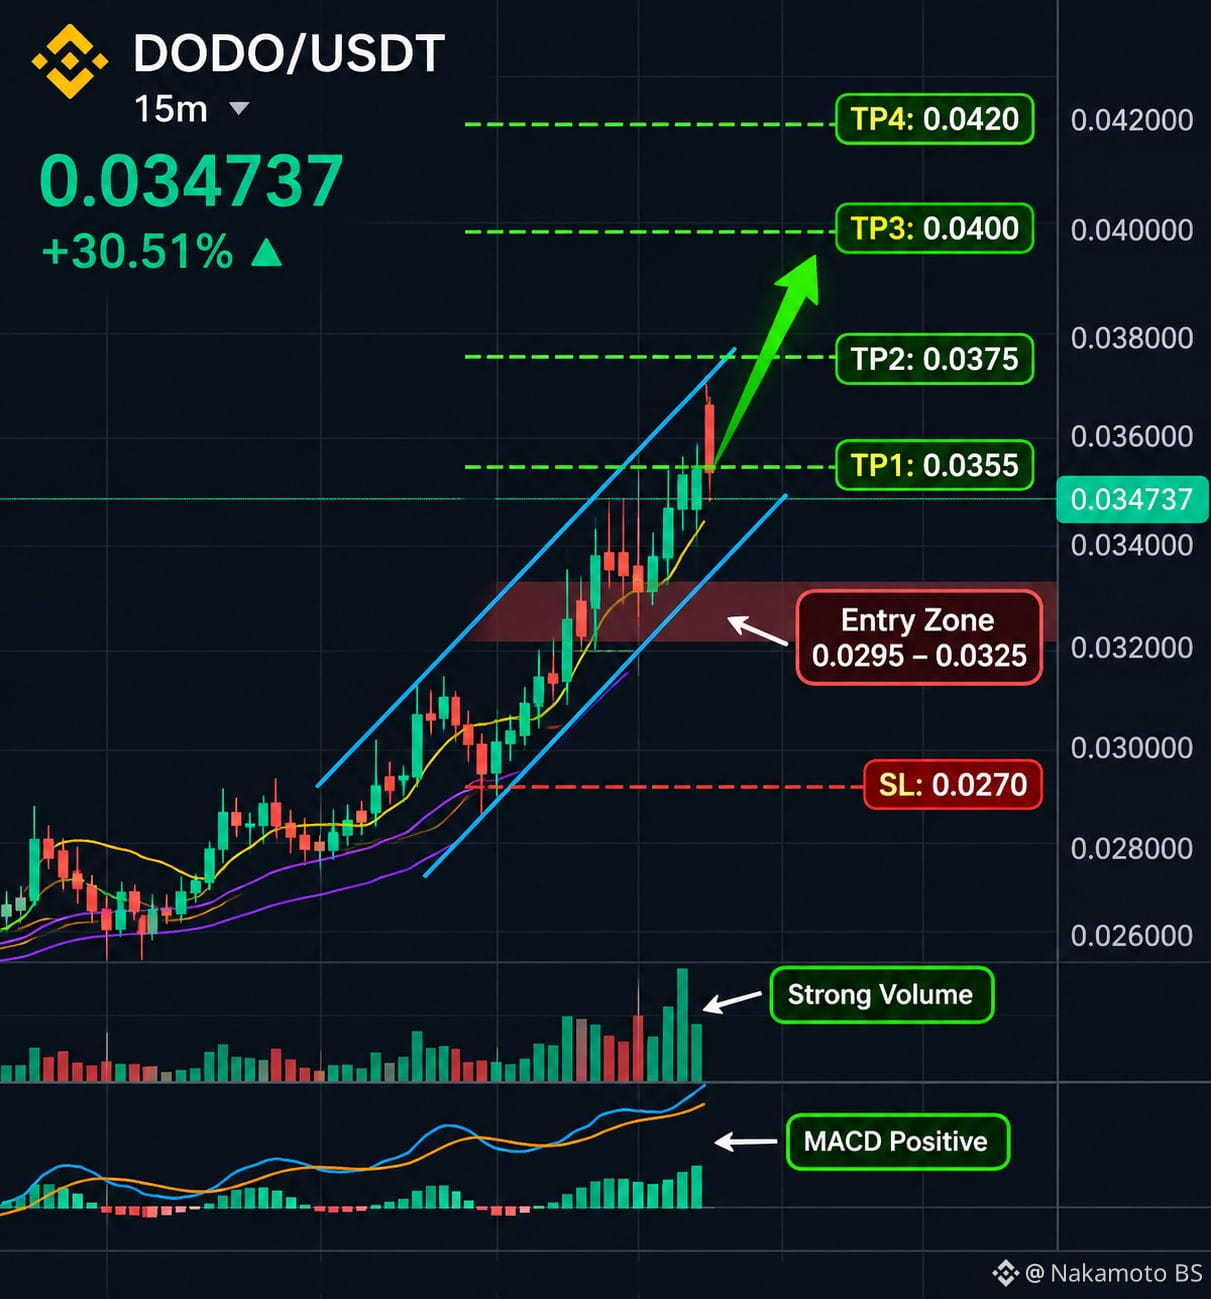
🚀 $DODO /USDT Buy Trade (LONG)
After analyzing DODO's price movement on the 15-minute and 4-hour timeframes, I notice that the coin is showing strong bullish momentum, accompanied by a clear increase in trading volume. However, after this sharp rally, I prefer to wait for a price correction to enter at safer levels rather than chase the price.
📍 Entry Points After the Pullback:$DODO
Entry 1: 0.0325
Entry 2: 0.0310
Entry 3: 0.0295
It is preferable to wait for a bullish bounce from the entry zone before opening the trade.
🛑 Stop Loss (SL):$DODO
0.0270
🎯 Take Profit (TP):
TP1: 0.0355
TP2: 0.0375
TP3: 0.0400
TP4: 0.0420
📌 I will monitor price action around the entry zones and won't rush into buying before seeing clear confirmation that buyers are returning.
❤️ Don't forget to support us. Your support motivates us to keep going and provide more analyses and trading setups.
#DODO #DODOUSDT #BinanceFutures
{spot}(DODOUSDT)
🚀 $DODO /USDT Buy Trade (LONG)
After analyzing DODO's price movement on the 15-minute and 4-hour timeframes, I notice that the coin is showing strong bullish momentum, accompanied by a clear increase in trading volume. However, after this sharp rally, I prefer to wait for a price correction to enter at safer levels rather than chase the price.
📍 Entry Points After the Pullback:$DODO
Entry 1: 0.0325
Entry 2: 0.0310
Entry 3: 0.0295
It is preferable to wait for a bullish bounce from the entry zone before opening the trade.
🛑 Stop Loss (SL):$DODO
0.0270
🎯 Take Profit (TP):
TP1: 0.0355
TP2: 0.0375
TP3: 0.0400
TP4: 0.0420
📌 I will monitor price action around the entry zones and won't rush into buying before seeing clear confirmation that buyers are returning.
❤️ Don't forget to support us. Your support motivates us to keep going and provide more analyses and trading setups.
#DODO #DODOUSDT #BinanceFutures
After analyzing DODO's price movement on the 15-minute and 4-hour timeframes, I notice that the coin is showing strong bullish momentum, accompanied by a clear increase in trading volume. However, after this sharp rally, I prefer to wait for a price correction to enter at safer levels rather than chase the price.
📍 Entry Points After the Pullback:$DODO
Entry 1: 0.0325
Entry 2: 0.0310
Entry 3: 0.0295
It is preferable to wait for a bullish bounce from the entry zone before opening the trade.
🛑 Stop Loss (SL):$DODO
0.0270
🎯 Take Profit (TP):
TP1: 0.0355
TP2: 0.0375
TP3: 0.0400
TP4: 0.0420
📌 I will monitor price action around the entry zones and won't rush into buying before seeing clear confirmation that buyers are returning.
❤️ Don't forget to support us. Your support motivates us to keep going and provide more analyses and trading setups.
#DODO #DODOUSDT #BinanceFutures
1
127
·
--
Жоғары (өспелі)
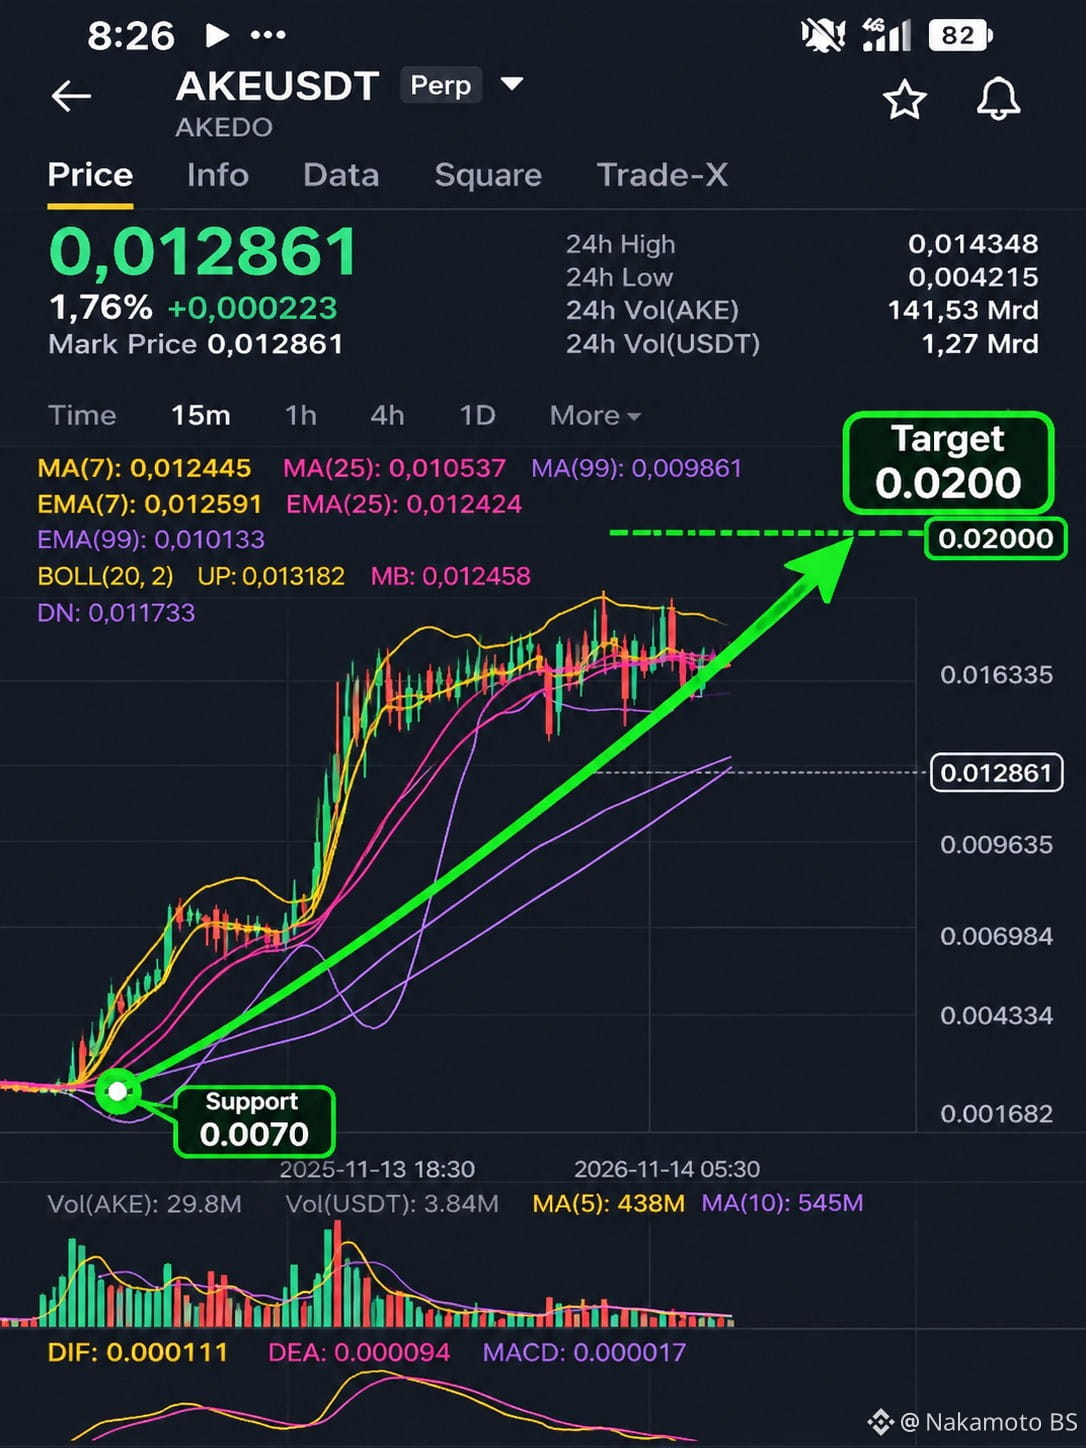
🚀 $AKE /USDT Buy Trade (LONG)
Entry Points:$AKE
- Entry 1: 0.0120
- Entry 2: 0.0113
- Entry 3: 0.0105
- Breakout Entry: After a 4-hour candle closes above 0.0145.
Stop Loss (SL):$AKE
- 0.0094
Take Profit (TP):
- TP1: 0.0143 (for entries from pullback zones)
- TP2: 0.0157
- TP3: 0.0180
- TP4: 0.0200
- TP5: 0.0218
📌 For a breakout entry above 0.0145, the first target is 0.0157.#AKE #FutureTradingSignals
{future}(AKEUSDT)
🚀 $AKE /USDT Buy Trade (LONG)
Entry Points:$AKE
- Entry 1: 0.0120
- Entry 2: 0.0113
- Entry 3: 0.0105
- Breakout Entry: After a 4-hour candle closes above 0.0145.
Stop Loss (SL):$AKE
- 0.0094
Take Profit (TP):
- TP1: 0.0143 (for entries from pullback zones)
- TP2: 0.0157
- TP3: 0.0180
- TP4: 0.0200
- TP5: 0.0218
📌 For a breakout entry above 0.0145, the first target is 0.0157.#AKE #FutureTradingSignals
Entry Points:$AKE
- Entry 1: 0.0120
- Entry 2: 0.0113
- Entry 3: 0.0105
- Breakout Entry: After a 4-hour candle closes above 0.0145.
Stop Loss (SL):$AKE
- 0.0094
Take Profit (TP):
- TP1: 0.0143 (for entries from pullback zones)
- TP2: 0.0157
- TP3: 0.0180
- TP4: 0.0200
- TP5: 0.0218
📌 For a breakout entry above 0.0145, the first target is 0.0157.#AKE #FutureTradingSignals
2
445
·
--
Жоғары (өспелі)
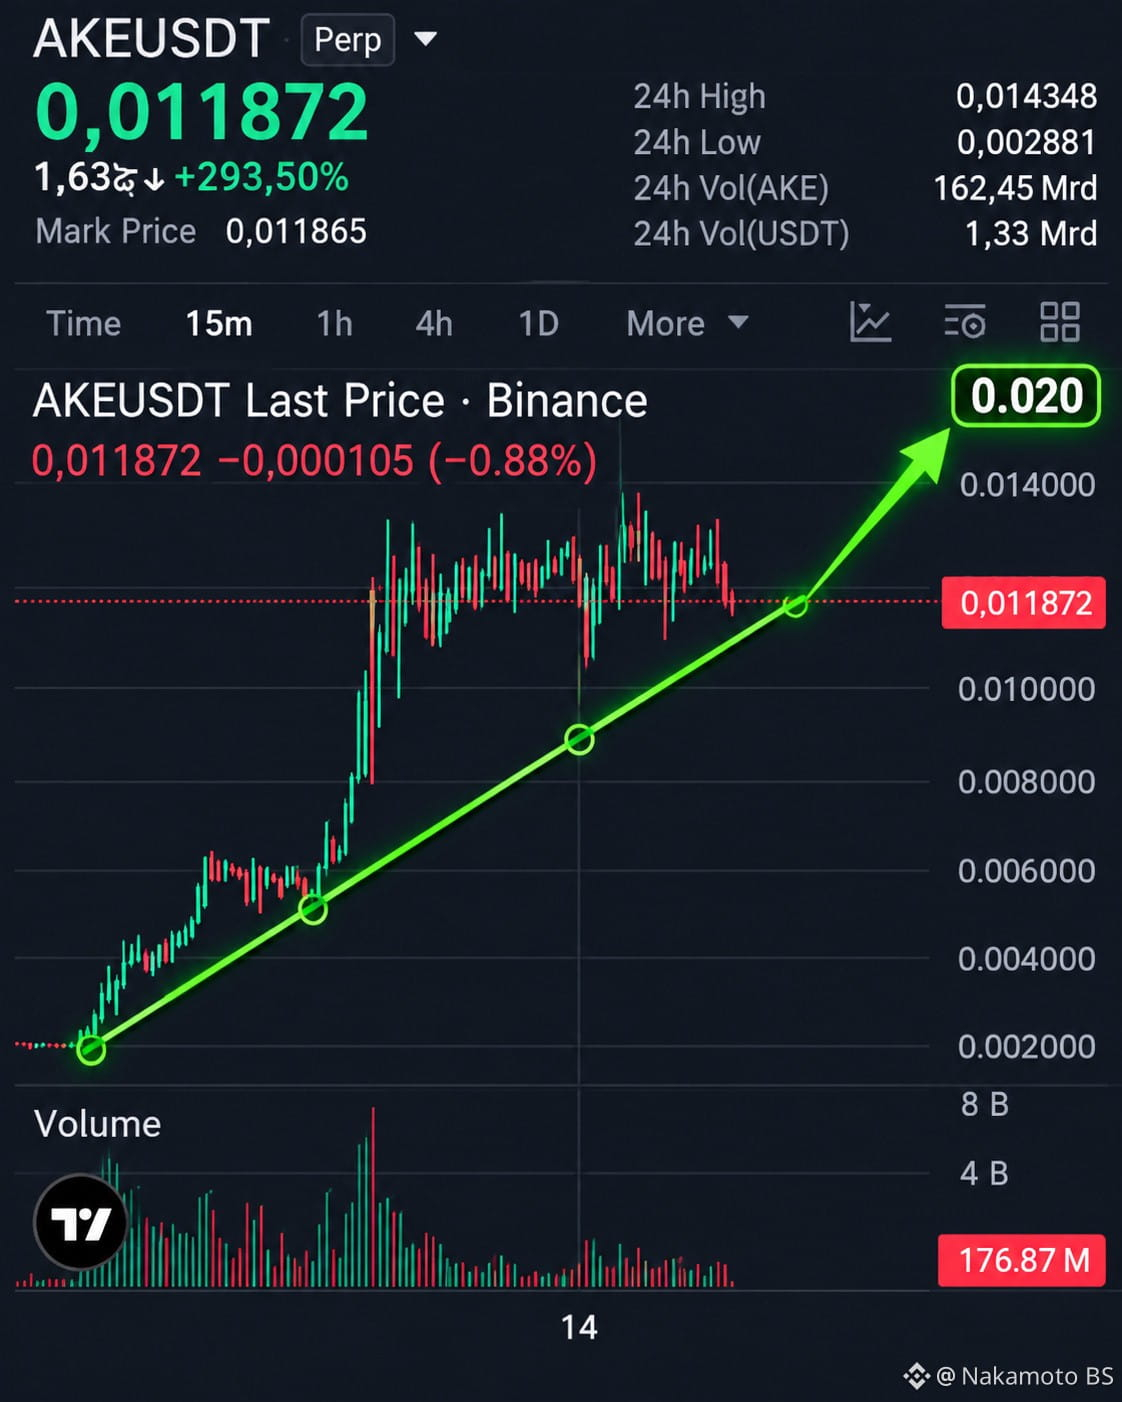
📈 $AKE USDT | My eyes are on 0.020 👀
I'm keeping a close eye on AKE, and what caught my attention is the strength of its recent rebound and the clear return of trading volume.
Personally, I wouldn't rule out a move towards 0.020 USDT, but there are a few levels I want to watch carefully before that happens.
🔹 0.0143: The first key resistance I'm watching.
🔹 0.0150: A solid break above this level could strengthen the bullish momentum.
🔹 0.0200: The target I have on my radar.
I'm not rushing to conclusions. After such a strong rally, a correction would be perfectly normal. What matters most to me is holding the support zones.
I'm watching it closely… Could AKE surprise us with another move towards 0.020? 🚀
#AKE #AKEDO #BinanceFutures
{future}(AKEUSDT)
📈 $AKE USDT | My eyes are on 0.020 👀
I'm keeping a close eye on AKE, and what caught my attention is the strength of its recent rebound and the clear return of trading volume.
Personally, I wouldn't rule out a move towards 0.020 USDT, but there are a few levels I want to watch carefully before that happens.
🔹 0.0143: The first key resistance I'm watching.
🔹 0.0150: A solid break above this level could strengthen the bullish momentum.
🔹 0.0200: The target I have on my radar.
I'm not rushing to conclusions. After such a strong rally, a correction would be perfectly normal. What matters most to me is holding the support zones.
I'm watching it closely… Could AKE surprise us with another move towards 0.020? 🚀
#AKE #AKEDO #BinanceFutures
I'm keeping a close eye on AKE, and what caught my attention is the strength of its recent rebound and the clear return of trading volume.
Personally, I wouldn't rule out a move towards 0.020 USDT, but there are a few levels I want to watch carefully before that happens.
🔹 0.0143: The first key resistance I'm watching.
🔹 0.0150: A solid break above this level could strengthen the bullish momentum.
🔹 0.0200: The target I have on my radar.
I'm not rushing to conclusions. After such a strong rally, a correction would be perfectly normal. What matters most to me is holding the support zones.
I'm watching it closely… Could AKE surprise us with another move towards 0.020? 🚀
#AKE #AKEDO #BinanceFutures
3
3
987
·
--
Жоғары (өспелі)
$AKE : Could We See the Price Reach $0.020?
Honestly, what caught my attention about AKE is the strength it has shown recently. A rally of more than 300% is not an ordinary move, and the most important question now is whether buyers can maintain this momentum or whether we will see a correction before another upward move.
On the 4-hour timeframe, the trend remains positive, with the moving averages and MACD supporting the bullish direction. However, on the 15-minute timeframe, we are starting to see signs of weakening momentum, accompanied by declining trading volume and a period of consolidation.
The key levels I'm watching:
0.01330: A breakout above this area with strong trading volume could send the price back to retest the previous high at 0.014348.
0.014348: Breaking this high and holding above it would be an important bullish signal.
0.01183: A break below this support could open the door to a deeper correction.
0.01020 – 0.00930: Potential support zones if selling pressure continues.
Can the price reach $0.020?
Yes, this possibility exists from a technical perspective, but reaching that level requires breaking the previous high at 0.014348, continued liquidity inflows, and sustained buying momentum. Moving from the current price to 0.020 would represent an additional increase of approximately 62%, so I don't consider it a guaranteed target or necessarily an immediate one.
Personally, I wouldn't rush into a position after such a strong rally. I'll be watching how the price behaves around resistance and support, because a good opportunity isn't always about chasing green candles; it's about waiting for a well-planned entry.
My friends, please support the page. We are working hard for you! 🤝🤝🤝❤️#FutureTarding #AKEAnalysis
{future}(AKEUSDT)
$AKE : Could We See the Price Reach $0.020?
Honestly, what caught my attention about AKE is the strength it has shown recently. A rally of more than 300% is not an ordinary move, and the most important question now is whether buyers can maintain this momentum or whether we will see a correction before another upward move.
On the 4-hour timeframe, the trend remains positive, with the moving averages and MACD supporting the bullish direction. However, on the 15-minute timeframe, we are starting to see signs of weakening momentum, accompanied by declining trading volume and a period of consolidation.
The key levels I'm watching:
0.01330: A breakout above this area with strong trading volume could send the price back to retest the previous high at 0.014348.
0.014348: Breaking this high and holding above it would be an important bullish signal.
0.01183: A break below this support could open the door to a deeper correction.
0.01020 – 0.00930: Potential support zones if selling pressure continues.
Can the price reach $0.020?
Yes, this possibility exists from a technical perspective, but reaching that level requires breaking the previous high at 0.014348, continued liquidity inflows, and sustained buying momentum. Moving from the current price to 0.020 would represent an additional increase of approximately 62%, so I don't consider it a guaranteed target or necessarily an immediate one.
Personally, I wouldn't rush into a position after such a strong rally. I'll be watching how the price behaves around resistance and support, because a good opportunity isn't always about chasing green candles; it's about waiting for a well-planned entry.
My friends, please support the page. We are working hard for you! 🤝🤝🤝❤️#FutureTarding #AKEAnalysis
Honestly, what caught my attention about AKE is the strength it has shown recently. A rally of more than 300% is not an ordinary move, and the most important question now is whether buyers can maintain this momentum or whether we will see a correction before another upward move.
On the 4-hour timeframe, the trend remains positive, with the moving averages and MACD supporting the bullish direction. However, on the 15-minute timeframe, we are starting to see signs of weakening momentum, accompanied by declining trading volume and a period of consolidation.
The key levels I'm watching:
0.01330: A breakout above this area with strong trading volume could send the price back to retest the previous high at 0.014348.
0.014348: Breaking this high and holding above it would be an important bullish signal.
0.01183: A break below this support could open the door to a deeper correction.
0.01020 – 0.00930: Potential support zones if selling pressure continues.
Can the price reach $0.020?
Yes, this possibility exists from a technical perspective, but reaching that level requires breaking the previous high at 0.014348, continued liquidity inflows, and sustained buying momentum. Moving from the current price to 0.020 would represent an additional increase of approximately 62%, so I don't consider it a guaranteed target or necessarily an immediate one.
Personally, I wouldn't rush into a position after such a strong rally. I'll be watching how the price behaves around resistance and support, because a good opportunity isn't always about chasing green candles; it's about waiting for a well-planned entry.
My friends, please support the page. We are working hard for you! 🤝🤝🤝❤️#FutureTarding #AKEAnalysis
1
483
·
--
Төмен (кемімелі)
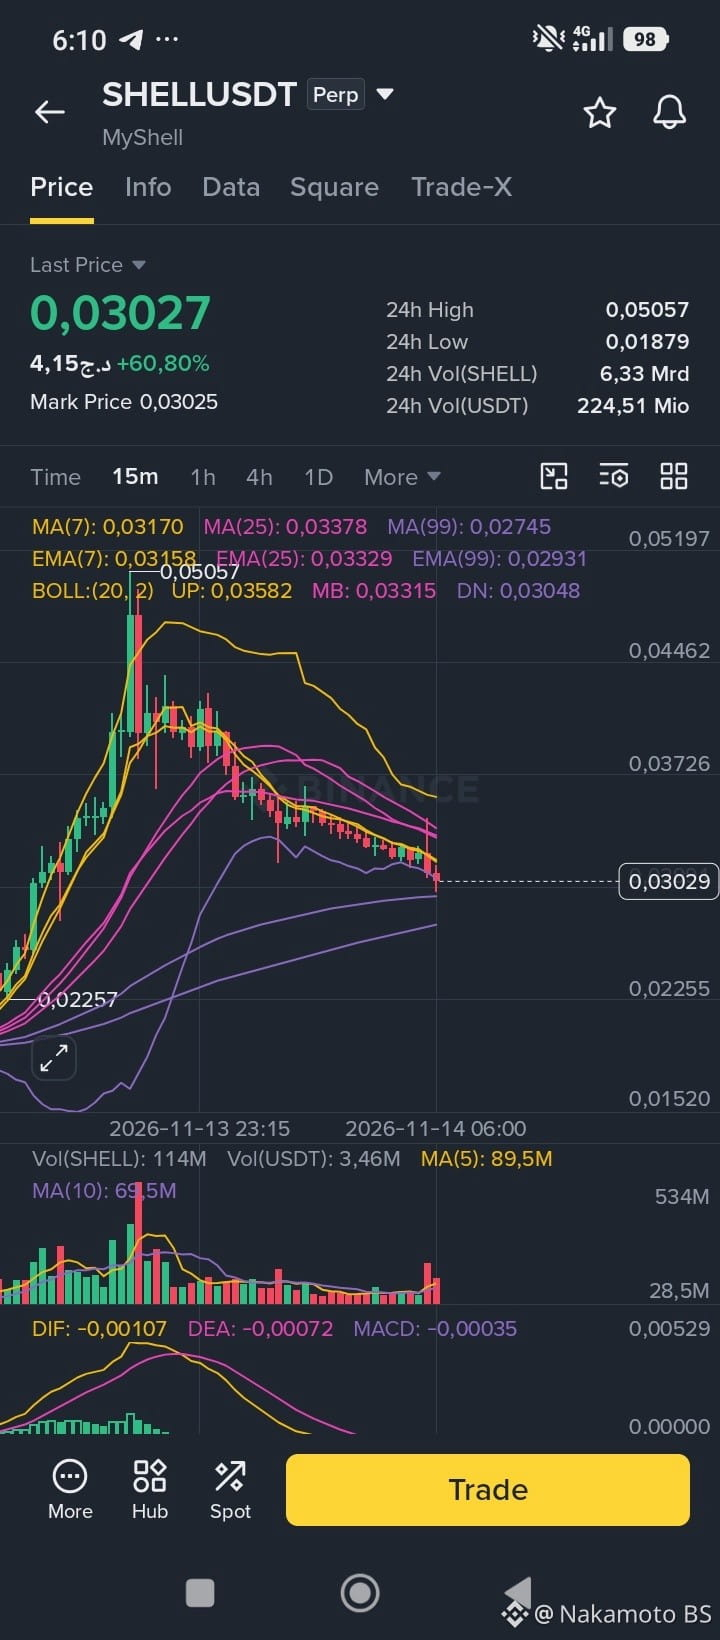
🔴 $SHELL USDT – SHORT TRADE
Entry Zone 1: 0.0315 – 0.0330
Entry Zone 2: 0.0335 – 0.0350
Stop Loss: 0.0362
Take Profit Targets:$SHELL
- TP1: 0.0293
- TP2: 0.0285
- TP3: 0.0274
Entry Confirmation: Wait for bearish rejection from the entry zones, or a break below 0.0300 followed by a retest as resistance.
Risk management is essential. Do not enter without confirmation.
❤️ My friends, please support our page. We work hard for you and strive to provide useful analyses and trading opportunities. Your support motivates us to keep going!
{future}(SHELLUSDT)
#shell #FutureTradingSignals
🔴 $SHELL USDT – SHORT TRADE
Entry Zone 1: 0.0315 – 0.0330
Entry Zone 2: 0.0335 – 0.0350
Stop Loss: 0.0362
Take Profit Targets:$SHELL
- TP1: 0.0293
- TP2: 0.0285
- TP3: 0.0274
Entry Confirmation: Wait for bearish rejection from the entry zones, or a break below 0.0300 followed by a retest as resistance.
Risk management is essential. Do not enter without confirmation.
❤️ My friends, please support our page. We work hard for you and strive to provide useful analyses and trading opportunities. Your support motivates us to keep going!
#shell #FutureTradingSignals
Entry Zone 1: 0.0315 – 0.0330
Entry Zone 2: 0.0335 – 0.0350
Stop Loss: 0.0362
Take Profit Targets:$SHELL
- TP1: 0.0293
- TP2: 0.0285
- TP3: 0.0274
Entry Confirmation: Wait for bearish rejection from the entry zones, or a break below 0.0300 followed by a retest as resistance.
Risk management is essential. Do not enter without confirmation.
❤️ My friends, please support our page. We work hard for you and strive to provide useful analyses and trading opportunities. Your support motivates us to keep going!
#shell #FutureTradingSignals
3
457
·
--
Жоғары (өспелі)
🟢 LONG Position (Buy)
If the price reaches $0.01150 – $0.01180 and shows a clear rebound:
Entry: $0.01150 – $0.01180$AKE
Stop Loss: $0.00965
Target 1: $0.01330
Target 2: $0.01450
Target 3: $0.01600
🔴 SHORT Position (Sell)$AKE
If the price reaches $0.01300 – $0.01330 and shows clear signs of rejection and downward movement:
Entry: $0.01300 – $0.01330$AKE
Stop Loss: $0.01385
Target 1: $0.01200
Target 2: $0.01150
Target 3: $0.01010
Note: Don't enter just because the price reaches these levels. Wait for confirmation of a rebound before going LONG or clear rejection before going SHORT.#FutureTradingSignals
{future}(AKEUSDT)
🟢 LONG Position (Buy)
If the price reaches $0.01150 – $0.01180 and shows a clear rebound:
Entry: $0.01150 – $0.01180$AKE
Stop Loss: $0.00965
Target 1: $0.01330
Target 2: $0.01450
Target 3: $0.01600
🔴 SHORT Position (Sell)$AKE
If the price reaches $0.01300 – $0.01330 and shows clear signs of rejection and downward movement:
Entry: $0.01300 – $0.01330$AKE
Stop Loss: $0.01385
Target 1: $0.01200
Target 2: $0.01150
Target 3: $0.01010
Note: Don't enter just because the price reaches these levels. Wait for confirmation of a rebound before going LONG or clear rejection before going SHORT.#FutureTradingSignals
If the price reaches $0.01150 – $0.01180 and shows a clear rebound:
Entry: $0.01150 – $0.01180$AKE
Stop Loss: $0.00965
Target 1: $0.01330
Target 2: $0.01450
Target 3: $0.01600
🔴 SHORT Position (Sell)$AKE
If the price reaches $0.01300 – $0.01330 and shows clear signs of rejection and downward movement:
Entry: $0.01300 – $0.01330$AKE
Stop Loss: $0.01385
Target 1: $0.01200
Target 2: $0.01150
Target 3: $0.01010
Note: Don't enter just because the price reaches these levels. Wait for confirmation of a rebound before going LONG or clear rejection before going SHORT.#FutureTradingSignals
42
·
--
Жоғары (өспелі)
$AKE 🟢 LONG Position (Buy)
If the price reaches $0.01150 – $0.01180 and shows a clear rebound:
Entry: $0.01150 – $0.01180
Stop Loss: $0.00965
Target 1: $0.01330
Target 2: $0.01450
Target 3: $0.01600
🔴 SHORT Position (Sell)$AKE
If the price reaches $0.01300 – $0.01330 and shows clear signs of rejection and downward movement:$AKE
Entry: $0.01300 – $0.01330
Stop Loss: $0.01385
Target 1: $0.01200
Target 2: $0.01150
Target 3: $0.01010
Note: Don't enter just because the price reaches these levels. Wait for confirmation of a rebound before going LONG or clear rejection before going SHORT.#AKE #FutureTradingSignals
$AKE 🟢 LONG Position (Buy)
If the price reaches $0.01150 – $0.01180 and shows a clear rebound:
Entry: $0.01150 – $0.01180
Stop Loss: $0.00965
Target 1: $0.01330
Target 2: $0.01450
Target 3: $0.01600
🔴 SHORT Position (Sell)$AKE
If the price reaches $0.01300 – $0.01330 and shows clear signs of rejection and downward movement:$AKE
Entry: $0.01300 – $0.01330
Stop Loss: $0.01385
Target 1: $0.01200
Target 2: $0.01150
Target 3: $0.01010
Note: Don't enter just because the price reaches these levels. Wait for confirmation of a rebound before going LONG or clear rejection before going SHORT.#AKE #FutureTradingSignals
If the price reaches $0.01150 – $0.01180 and shows a clear rebound:
Entry: $0.01150 – $0.01180
Stop Loss: $0.00965
Target 1: $0.01330
Target 2: $0.01450
Target 3: $0.01600
🔴 SHORT Position (Sell)$AKE
If the price reaches $0.01300 – $0.01330 and shows clear signs of rejection and downward movement:$AKE
Entry: $0.01300 – $0.01330
Stop Loss: $0.01385
Target 1: $0.01200
Target 2: $0.01150
Target 3: $0.01010
Note: Don't enter just because the price reaches these levels. Wait for confirmation of a rebound before going LONG or clear rejection before going SHORT.#AKE #FutureTradingSignals
2
439
·
--
Жоғары (өспелі)
Расталды
$AKE | Can the Bullish Momentum Continue?
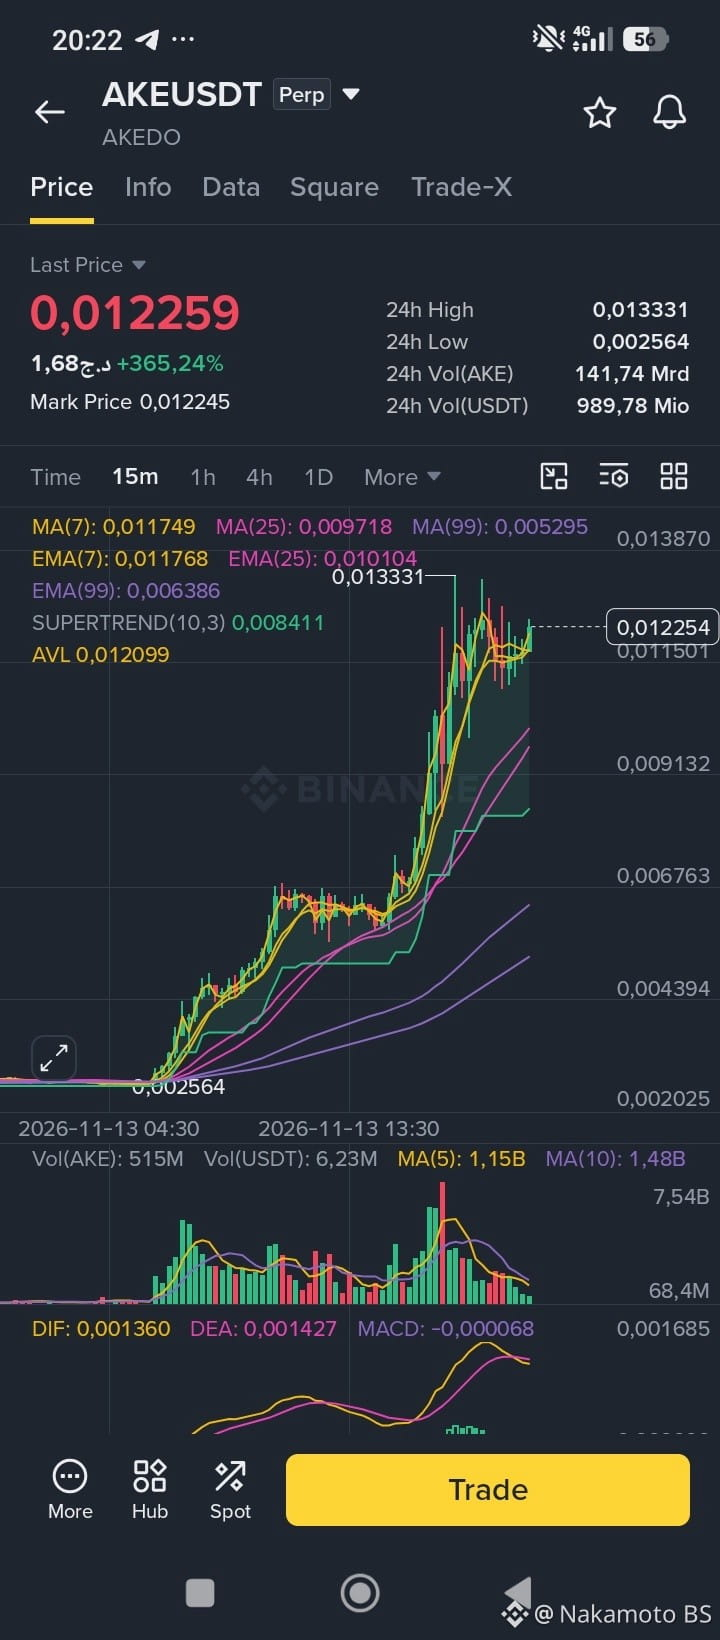
AKEDO (AKE) has caught the market's attention after a powerful rally of more than 360% in the last 24 hours, accompanied by a significant increase in trading volume. But after such a strong move, we need to focus on what happens next rather than chase the price.
📊 Technically, on the 4-hour timeframe:
The price has broken out of a long consolidation range and moved above the major moving averages with strength. This is a clear shift in market behavior. However, on the 15-minute timeframe, signs of slowing momentum are starting to appear after reaching a high of $0.013331, with the MACD also showing a loss of momentum.
🎯 Key levels I'm watching:$AKE
🟢 Support zones:
$0.01150 – $0.01010 – $0.00913.
🔴 Main resistance:
$0.013331.
What am I watching next?
📈 For buyers: I want to see a genuine breakout above $0.013331, followed by a clear close above this level and strong trading volume to support the move. Only then can we start looking at a potential continuation to the upside.
📉 For sellers: Losing the $0.01150 level could open the door to a deeper correction, especially if selling pressure starts to increase.
⚠️ Another factor to watch: The upcoming token unlock on November 21 deserves attention, as it could increase the available supply in the market.
My view: Momentum is still strong, but entering after a move of this size is not a decision I would favor without a clear signal. Good opportunities don't require chasing candles; what matters most is choosing the right entry zone and waiting for confirmation.
📩 If you want a trading setup for AKE, leave a comment below.
#AKE #AKEDO #cryptotrading
{future}(AKEUSDT)
$AKE | Can the Bullish Momentum Continue?
AKEDO (AKE) has caught the market's attention after a powerful rally of more than 360% in the last 24 hours, accompanied by a significant increase in trading volume. But after such a strong move, we need to focus on what happens next rather than chase the price.
📊 Technically, on the 4-hour timeframe:
The price has broken out of a long consolidation range and moved above the major moving averages with strength. This is a clear shift in market behavior. However, on the 15-minute timeframe, signs of slowing momentum are starting to appear after reaching a high of $0.013331, with the MACD also showing a loss of momentum.
🎯 Key levels I'm watching:$AKE
🟢 Support zones:
$0.01150 – $0.01010 – $0.00913.
🔴 Main resistance:
$0.013331.
What am I watching next?
📈 For buyers: I want to see a genuine breakout above $0.013331, followed by a clear close above this level and strong trading volume to support the move. Only then can we start looking at a potential continuation to the upside.
📉 For sellers: Losing the $0.01150 level could open the door to a deeper correction, especially if selling pressure starts to increase.
⚠️ Another factor to watch: The upcoming token unlock on November 21 deserves attention, as it could increase the available supply in the market.
My view: Momentum is still strong, but entering after a move of this size is not a decision I would favor without a clear signal. Good opportunities don't require chasing candles; what matters most is choosing the right entry zone and waiting for confirmation.
📩 If you want a trading setup for AKE, leave a comment below.
#AKE #AKEDO #cryptotrading
AKEDO (AKE) has caught the market's attention after a powerful rally of more than 360% in the last 24 hours, accompanied by a significant increase in trading volume. But after such a strong move, we need to focus on what happens next rather than chase the price.
📊 Technically, on the 4-hour timeframe:
The price has broken out of a long consolidation range and moved above the major moving averages with strength. This is a clear shift in market behavior. However, on the 15-minute timeframe, signs of slowing momentum are starting to appear after reaching a high of $0.013331, with the MACD also showing a loss of momentum.
🎯 Key levels I'm watching:$AKE
🟢 Support zones:
$0.01150 – $0.01010 – $0.00913.
🔴 Main resistance:
$0.013331.
What am I watching next?
📈 For buyers: I want to see a genuine breakout above $0.013331, followed by a clear close above this level and strong trading volume to support the move. Only then can we start looking at a potential continuation to the upside.
📉 For sellers: Losing the $0.01150 level could open the door to a deeper correction, especially if selling pressure starts to increase.
⚠️ Another factor to watch: The upcoming token unlock on November 21 deserves attention, as it could increase the available supply in the market.
My view: Momentum is still strong, but entering after a move of this size is not a decision I would favor without a clear signal. Good opportunities don't require chasing candles; what matters most is choosing the right entry zone and waiting for confirmation.
📩 If you want a trading setup for AKE, leave a comment below.
#AKE #AKEDO #cryptotrading
1
573
·
--
Жоғары (өспелі)
🔍 $UAI (UnifAI Network) Analysis: Is a Recovery Beginning?
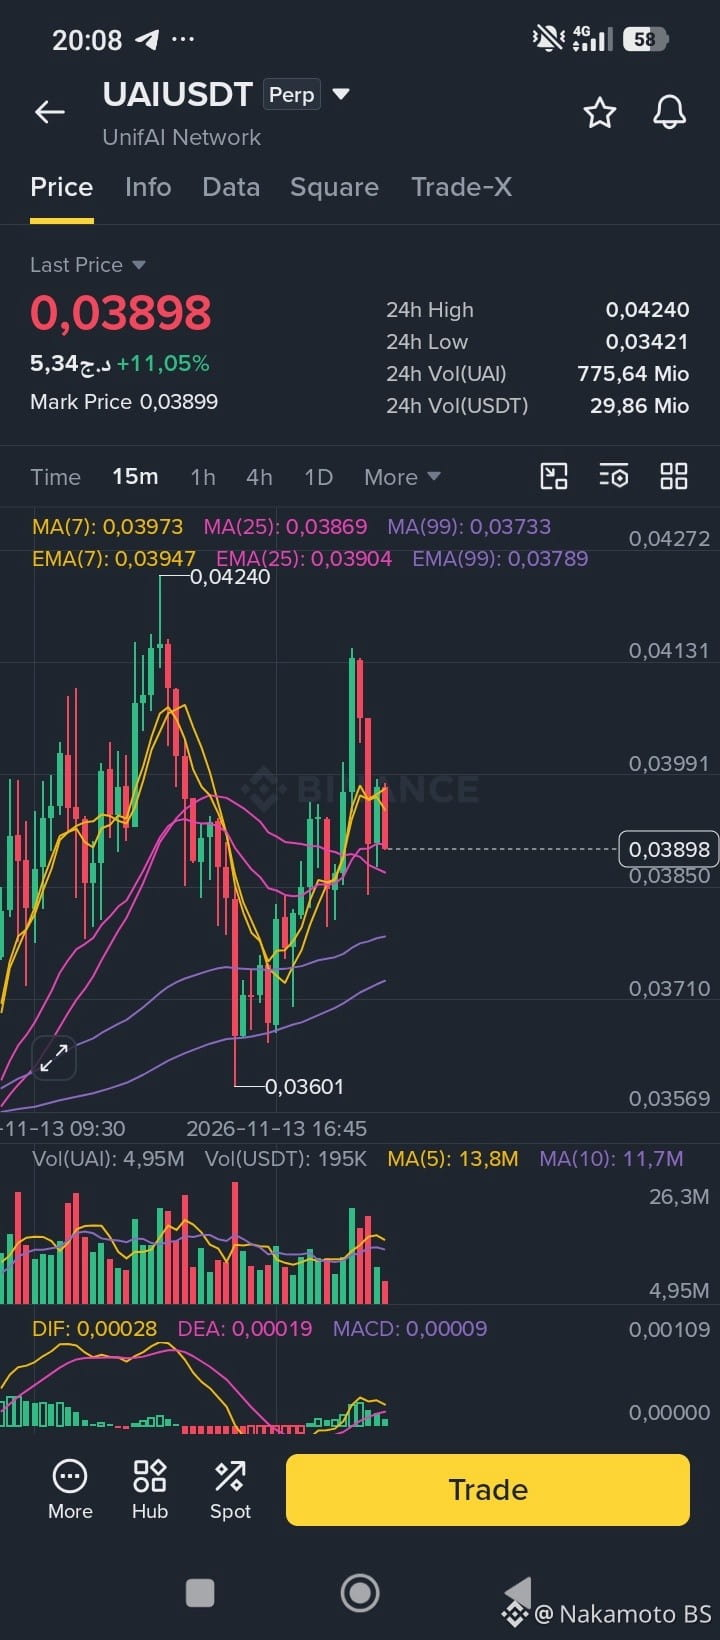
UAI is attracting attention after recording an approximately 11% increase over 24 hours. But the main question is: Are we witnessing the beginning of a new bullish reversal, or is this simply a temporary rebound after a strong downward move?
📊 Technical Overview:
On the 4-hour timeframe, the price appears to be stabilizing after a sharp decline, with gradual momentum improvement and green histogram bars appearing on the MACD indicator. The price is currently trading around $0.03896, but it remains below the EMA25 at $0.04526, meaning the medium-term trend has not yet confirmed a bullish reversal.
On the 15-minute timeframe, the price attempted to reach $0.04240 but faced selling pressure and pulled back. This makes the $0.04000 area the first important test for buyers.
🎯 Key Levels to Watch:
🟢 Support: $0.03850 – $0.03710 – $0.03601 – $0.03350.
🔴 Resistance: $0.04000 – $0.04130 – $0.04240.
📈 Bullish Scenario: A breakout above $0.04000, followed by holding above this level with increasing trading volume, could open the way toward $0.04130 and then $0.04240.
📉 Bearish Scenario: Failure to break resistance and a drop below $0.03850 could bring the price back to test $0.03710 and then $0.03601.
⚠️ Important Note: Despite the improving momentum, the overall trend remains weak following the significant decline. Therefore, monitoring liquidity and trading volume is essential. Avoid chasing price increases without confirmation.
📩 If you want a trading setup for this coin, whether LONG or SHORT depending on market conditions, leave a comment below.
#UAI #CryptoAnalysis #BinanceSquare
{future}(UAIUSDT)
🔍 $UAI (UnifAI Network) Analysis: Is a Recovery Beginning?
UAI is attracting attention after recording an approximately 11% increase over 24 hours. But the main question is: Are we witnessing the beginning of a new bullish reversal, or is this simply a temporary rebound after a strong downward move?
📊 Technical Overview:
On the 4-hour timeframe, the price appears to be stabilizing after a sharp decline, with gradual momentum improvement and green histogram bars appearing on the MACD indicator. The price is currently trading around $0.03896, but it remains below the EMA25 at $0.04526, meaning the medium-term trend has not yet confirmed a bullish reversal.
On the 15-minute timeframe, the price attempted to reach $0.04240 but faced selling pressure and pulled back. This makes the $0.04000 area the first important test for buyers.
🎯 Key Levels to Watch:
🟢 Support: $0.03850 – $0.03710 – $0.03601 – $0.03350.
🔴 Resistance: $0.04000 – $0.04130 – $0.04240.
📈 Bullish Scenario: A breakout above $0.04000, followed by holding above this level with increasing trading volume, could open the way toward $0.04130 and then $0.04240.
📉 Bearish Scenario: Failure to break resistance and a drop below $0.03850 could bring the price back to test $0.03710 and then $0.03601.
⚠️ Important Note: Despite the improving momentum, the overall trend remains weak following the significant decline. Therefore, monitoring liquidity and trading volume is essential. Avoid chasing price increases without confirmation.
📩 If you want a trading setup for this coin, whether LONG or SHORT depending on market conditions, leave a comment below.
#UAI #CryptoAnalysis #BinanceSquare
UAI is attracting attention after recording an approximately 11% increase over 24 hours. But the main question is: Are we witnessing the beginning of a new bullish reversal, or is this simply a temporary rebound after a strong downward move?
📊 Technical Overview:
On the 4-hour timeframe, the price appears to be stabilizing after a sharp decline, with gradual momentum improvement and green histogram bars appearing on the MACD indicator. The price is currently trading around $0.03896, but it remains below the EMA25 at $0.04526, meaning the medium-term trend has not yet confirmed a bullish reversal.
On the 15-minute timeframe, the price attempted to reach $0.04240 but faced selling pressure and pulled back. This makes the $0.04000 area the first important test for buyers.
🎯 Key Levels to Watch:
🟢 Support: $0.03850 – $0.03710 – $0.03601 – $0.03350.
🔴 Resistance: $0.04000 – $0.04130 – $0.04240.
📈 Bullish Scenario: A breakout above $0.04000, followed by holding above this level with increasing trading volume, could open the way toward $0.04130 and then $0.04240.
📉 Bearish Scenario: Failure to break resistance and a drop below $0.03850 could bring the price back to test $0.03710 and then $0.03601.
⚠️ Important Note: Despite the improving momentum, the overall trend remains weak following the significant decline. Therefore, monitoring liquidity and trading volume is essential. Avoid chasing price increases without confirmation.
📩 If you want a trading setup for this coin, whether LONG or SHORT depending on market conditions, leave a comment below.
#UAI #CryptoAnalysis #BinanceSquare
409
·
--

Мақала
🚀 To Everyone Dreaming of Getting Rich Through Trading… Don't Ignore This Article!💡 In the world of cryptocurrency, people enter the market with different goals. Some are looking for an opportunity that could change their lives, others want to build long-term wealth, while some are chasing daily profits. But the problem is that many focus on how much they could make and forget to consider how much they could lose.$BTC
Let's talk honestly about the different types of traders and investors. 👇
🐸 1. Those With Big Dreams and Coins Like $PEPE
There are people who buy PEPE and hold it for months or even years, hoping that one day it will reach $0.01, $0.1, or even $1.
But have they considered the market capitalization the coin would need to reach those prices? 🤔
📊 A 100% or 500% increase is possible in a highly volatile market, but reaching unrealistic price targets is not simply a matter of waiting and being patient. You must consider the token supply, market capitalization, liquidity, and genuine demand.
Meme coins depend heavily on community interest and speculation. This makes them capable of strong rallies, but also exposes them to severe declines. Don't let your attachment to a particular coin prevent you from seeing the facts.
⚡ 2. Futures Traders
This group looks for quick profits through Long and Short positions, using leverage to increase the size of their positions.
📈 A trader may achieve good profits when the market moves in their favor, but leverage works both ways. A small move against their prediction can lead to significant losses or even liquidate the entire position.
⚠️ The biggest danger is that some traders increase their leverage after losing a trade, trying to recover their money quickly. Trading then becomes a series of emotional decisions.
Futures trading is not a shortcut to wealth. It requires a clear strategy, capital management, and carefully planned entry and exit points.
💰 3. Spot Market Investors
These are people who buy cryptocurrencies and actually own them without using leverage.
This approach may be simpler than futures trading, but it is not risk-free. Buying a good coin does not necessarily mean its price will increase, and holding a losing asset simply because you refuse to accept a mistake can lock up your capital for a long time.
🔍 A smart investor does not buy simply because the price has dropped. They look for reasons why the asset deserves an investment.
📉 4. Day Traders and Scalpers
Some traders open and close dozens of positions throughout the day, looking for small price movements.
This group needs more than just the ability to read charts. They need quick decision-making, discipline, and an understanding of liquidity, fees, and slippage.
⚖️ More trades do not necessarily mean more profits. Sometimes a trader can complete several successful trades and then lose all those gains because of one bad position.
📊 5. Swing Traders
These traders look for medium-term price movements that may last several days or weeks.
They don't chase every small movement. Instead, they try to enter near support zones and exit near resistance levels, while identifying the invalidation level before entering a trade.
⏳ This strategy requires patience, but it does not guarantee success either. The market can change direction at any moment.
👥 6. Signal Followers and Copy Traders
Some people don't have enough time or experience to analyze the market, so they rely on other people's signals or copy their trades.
But remember: a trader's past success does not guarantee future success. Capital size, leverage, and risk levels may also differ from one person to another.
⚠️ Don't hand over control of your money to someone else's decisions without understanding their strategy.
🤖 7. Trading Bot Users
Some people believe that trading bots can generate profits automatically without human intervention.
The truth is that a bot simply executes the rules it has been programmed to follow. It cannot guarantee that those rules will work in every market condition. A bot may perform well in a sideways market and then experience losses when the trend changes.
Automation does not mean the disappearance of risk.
🎯 Where Does the Real Problem Lie?
The problem is not owning PEPE, trading futures, day trading, or investing for the long term.
The problem begins when you enter the market without knowing what you are doing, when you confuse investing with hope, trading with gambling, and genuine opportunities with the desire to get rich quickly.
There is a huge difference between someone buying a coin because they have studied its project, supply, and liquidity, and someone buying it because they read a comment saying it will reach $1.
There is also a difference between a trader who opens a position based on a clear plan and someone who uses high leverage simply because they don't want to miss a market move.
🏆 My Final Message to Everyone Dreaming of Wealth:
on't make your first goal becoming a millionaire from a single trade. Make your goal becoming a trader who understands what they are doing, knows when to enter, when to exit, and when to stay away from the market.
The markets do not always reward the most ambitious. Surviving in them requires knowledge, discipline, and risk management.
🔥 And Now, A Question for Discussion:
Which category represents you in the crypto world?
🐸 Are you a long-term holder like PEPE investors?
⚡ A futures trader?
📊 Do you prefer day trading and scalping?
🧠 Or are you still searching for the right strategy?
Share your opinion. Someone else might benefit from your experience.
#CryptoTrading #RiskManagement #CryptpTrading
{spot}(PEPEUSDT)
🚀 To Everyone Dreaming of Getting Rich Through Trading… Don't Ignore This Article!
💡 In the world of cryptocurrency, people enter the market with different goals. Some are looking for an opportunity that could change their lives, others want to build long-term wealth, while some are chasing daily profits. But the problem is that many focus on how much they could make and forget to consider how much they could lose.$BTC
Let's talk honestly about the different types of traders and investors. 👇
🐸 1. Those With Big Dreams and Coins Like $PEPE
There are people who buy PEPE and hold it for months or even years, hoping that one day it will reach $0.01, $0.1, or even $1.
But have they considered the market capitalization the coin would need to reach those prices? 🤔
📊 A 100% or 500% increase is possible in a highly volatile market, but reaching unrealistic price targets is not simply a matter of waiting and being patient. You must consider the token supply, market capitalization, liquidity, and genuine demand.
Meme coins depend heavily on community interest and speculation. This makes them capable of strong rallies, but also exposes them to severe declines. Don't let your attachment to a particular coin prevent you from seeing the facts.
⚡ 2. Futures Traders
This group looks for quick profits through Long and Short positions, using leverage to increase the size of their positions.
📈 A trader may achieve good profits when the market moves in their favor, but leverage works both ways. A small move against their prediction can lead to significant losses or even liquidate the entire position.
⚠️ The biggest danger is that some traders increase their leverage after losing a trade, trying to recover their money quickly. Trading then becomes a series of emotional decisions.
Futures trading is not a shortcut to wealth. It requires a clear strategy, capital management, and carefully planned entry and exit points.
💰 3. Spot Market Investors
These are people who buy cryptocurrencies and actually own them without using leverage.
This approach may be simpler than futures trading, but it is not risk-free. Buying a good coin does not necessarily mean its price will increase, and holding a losing asset simply because you refuse to accept a mistake can lock up your capital for a long time.
🔍 A smart investor does not buy simply because the price has dropped. They look for reasons why the asset deserves an investment.
📉 4. Day Traders and Scalpers
Some traders open and close dozens of positions throughout the day, looking for small price movements.
This group needs more than just the ability to read charts. They need quick decision-making, discipline, and an understanding of liquidity, fees, and slippage.
⚖️ More trades do not necessarily mean more profits. Sometimes a trader can complete several successful trades and then lose all those gains because of one bad position.
📊 5. Swing Traders
These traders look for medium-term price movements that may last several days or weeks.
They don't chase every small movement. Instead, they try to enter near support zones and exit near resistance levels, while identifying the invalidation level before entering a trade.
⏳ This strategy requires patience, but it does not guarantee success either. The market can change direction at any moment.
👥 6. Signal Followers and Copy Traders
Some people don't have enough time or experience to analyze the market, so they rely on other people's signals or copy their trades.
But remember: a trader's past success does not guarantee future success. Capital size, leverage, and risk levels may also differ from one person to another.
⚠️ Don't hand over control of your money to someone else's decisions without understanding their strategy.
🤖 7. Trading Bot Users
Some people believe that trading bots can generate profits automatically without human intervention.
The truth is that a bot simply executes the rules it has been programmed to follow. It cannot guarantee that those rules will work in every market condition. A bot may perform well in a sideways market and then experience losses when the trend changes.
Automation does not mean the disappearance of risk.
🎯 Where Does the Real Problem Lie?
The problem is not owning PEPE, trading futures, day trading, or investing for the long term.
The problem begins when you enter the market without knowing what you are doing, when you confuse investing with hope, trading with gambling, and genuine opportunities with the desire to get rich quickly.
There is a huge difference between someone buying a coin because they have studied its project, supply, and liquidity, and someone buying it because they read a comment saying it will reach $1.
There is also a difference between a trader who opens a position based on a clear plan and someone who uses high leverage simply because they don't want to miss a market move.
🏆 My Final Message to Everyone Dreaming of Wealth:
on't make your first goal becoming a millionaire from a single trade. Make your goal becoming a trader who understands what they are doing, knows when to enter, when to exit, and when to stay away from the market.
The markets do not always reward the most ambitious. Surviving in them requires knowledge, discipline, and risk management.
🔥 And Now, A Question for Discussion:
Which category represents you in the crypto world?
🐸 Are you a long-term holder like PEPE investors?
⚡ A futures trader?
📊 Do you prefer day trading and scalping?
🧠 Or are you still searching for the right strategy?
Share your opinion. Someone else might benefit from your experience.
#CryptoTrading #RiskManagement #CryptpTrading
Let's talk honestly about the different types of traders and investors. 👇
🐸 1. Those With Big Dreams and Coins Like $PEPE
There are people who buy PEPE and hold it for months or even years, hoping that one day it will reach $0.01, $0.1, or even $1.
But have they considered the market capitalization the coin would need to reach those prices? 🤔
📊 A 100% or 500% increase is possible in a highly volatile market, but reaching unrealistic price targets is not simply a matter of waiting and being patient. You must consider the token supply, market capitalization, liquidity, and genuine demand.
Meme coins depend heavily on community interest and speculation. This makes them capable of strong rallies, but also exposes them to severe declines. Don't let your attachment to a particular coin prevent you from seeing the facts.
⚡ 2. Futures Traders
This group looks for quick profits through Long and Short positions, using leverage to increase the size of their positions.
📈 A trader may achieve good profits when the market moves in their favor, but leverage works both ways. A small move against their prediction can lead to significant losses or even liquidate the entire position.
⚠️ The biggest danger is that some traders increase their leverage after losing a trade, trying to recover their money quickly. Trading then becomes a series of emotional decisions.
Futures trading is not a shortcut to wealth. It requires a clear strategy, capital management, and carefully planned entry and exit points.
💰 3. Spot Market Investors
These are people who buy cryptocurrencies and actually own them without using leverage.
This approach may be simpler than futures trading, but it is not risk-free. Buying a good coin does not necessarily mean its price will increase, and holding a losing asset simply because you refuse to accept a mistake can lock up your capital for a long time.
🔍 A smart investor does not buy simply because the price has dropped. They look for reasons why the asset deserves an investment.
📉 4. Day Traders and Scalpers
Some traders open and close dozens of positions throughout the day, looking for small price movements.
This group needs more than just the ability to read charts. They need quick decision-making, discipline, and an understanding of liquidity, fees, and slippage.
⚖️ More trades do not necessarily mean more profits. Sometimes a trader can complete several successful trades and then lose all those gains because of one bad position.
📊 5. Swing Traders
These traders look for medium-term price movements that may last several days or weeks.
They don't chase every small movement. Instead, they try to enter near support zones and exit near resistance levels, while identifying the invalidation level before entering a trade.
⏳ This strategy requires patience, but it does not guarantee success either. The market can change direction at any moment.
👥 6. Signal Followers and Copy Traders
Some people don't have enough time or experience to analyze the market, so they rely on other people's signals or copy their trades.
But remember: a trader's past success does not guarantee future success. Capital size, leverage, and risk levels may also differ from one person to another.
⚠️ Don't hand over control of your money to someone else's decisions without understanding their strategy.
🤖 7. Trading Bot Users
Some people believe that trading bots can generate profits automatically without human intervention.
The truth is that a bot simply executes the rules it has been programmed to follow. It cannot guarantee that those rules will work in every market condition. A bot may perform well in a sideways market and then experience losses when the trend changes.
Automation does not mean the disappearance of risk.
🎯 Where Does the Real Problem Lie?
The problem is not owning PEPE, trading futures, day trading, or investing for the long term.
The problem begins when you enter the market without knowing what you are doing, when you confuse investing with hope, trading with gambling, and genuine opportunities with the desire to get rich quickly.
There is a huge difference between someone buying a coin because they have studied its project, supply, and liquidity, and someone buying it because they read a comment saying it will reach $1.
There is also a difference between a trader who opens a position based on a clear plan and someone who uses high leverage simply because they don't want to miss a market move.
🏆 My Final Message to Everyone Dreaming of Wealth:
on't make your first goal becoming a millionaire from a single trade. Make your goal becoming a trader who understands what they are doing, knows when to enter, when to exit, and when to stay away from the market.
The markets do not always reward the most ambitious. Surviving in them requires knowledge, discipline, and risk management.
🔥 And Now, A Question for Discussion:
Which category represents you in the crypto world?
🐸 Are you a long-term holder like PEPE investors?
⚡ A futures trader?
📊 Do you prefer day trading and scalping?
🧠 Or are you still searching for the right strategy?
Share your opinion. Someone else might benefit from your experience.
#CryptoTrading #RiskManagement #CryptpTrading
64
·
--
Жоғары (өспелі)
🚀 $XRP USDT – LONG | BUY TRADE
📍 Entry Zones:$xrp
First Entry: 1.0248 – 1.0255
Second Entry: 1.0205 – 1.0220 (only after a confirmed bullish reversal).
✅ Entry Confirmation: A 15-minute candle must close above 1.0300 with increased trading volume.
🛑 Stop Loss: Below 1.0197 with confirmation of a breakdown.
🎯 Take-Profit Targets:$XRP
TP1: 1.0330
TP2: 1.0462
TP3: 1.0564
⚠️ Do not enter without reversal confirmation. Always manage your risk.
💛 Don't forget to leave a tip to support us and help us continue sharing trading signals. 👍 Leave a like so everyone can benefit, and subscribe to stay updated with all our latest posts.
Patience first. No confirmation, no trade.
#XRP #Binance #trading
{future}(XRPUSDT)
🚀 $XRP USDT – LONG | BUY TRADE
📍 Entry Zones:$xrp
First Entry: 1.0248 – 1.0255
Second Entry: 1.0205 – 1.0220 (only after a confirmed bullish reversal).
✅ Entry Confirmation: A 15-minute candle must close above 1.0300 with increased trading volume.
🛑 Stop Loss: Below 1.0197 with confirmation of a breakdown.
🎯 Take-Profit Targets:$XRP
TP1: 1.0330
TP2: 1.0462
TP3: 1.0564
⚠️ Do not enter without reversal confirmation. Always manage your risk.
💛 Don't forget to leave a tip to support us and help us continue sharing trading signals. 👍 Leave a like so everyone can benefit, and subscribe to stay updated with all our latest posts.
Patience first. No confirmation, no trade.
#XRP #Binance #trading
📍 Entry Zones:$xrp
First Entry: 1.0248 – 1.0255
Second Entry: 1.0205 – 1.0220 (only after a confirmed bullish reversal).
✅ Entry Confirmation: A 15-minute candle must close above 1.0300 with increased trading volume.
🛑 Stop Loss: Below 1.0197 with confirmation of a breakdown.
🎯 Take-Profit Targets:$XRP
TP1: 1.0330
TP2: 1.0462
TP3: 1.0564
⚠️ Do not enter without reversal confirmation. Always manage your risk.
💛 Don't forget to leave a tip to support us and help us continue sharing trading signals. 👍 Leave a like so everyone can benefit, and subscribe to stay updated with all our latest posts.
Patience first. No confirmation, no trade.
#XRP #Binance #trading
195
·
--
Жоғары (өспелі)
🐸 To All $PEPE Coin Lovers!
Instead of waiting for unrealistic dreams like PEPE reaching $1, learn to seize opportunities when the price drops and take profits when it rises.
📍 My Personal Example:$PEPE
- Entry Price: $0.00000445
- Target Selling Price: $0.00000540
- Expected Profit: Approximately +21.35%
💡 Don't wait for the impossible. Take advantage of available opportunities and grow your profits step by step.
💬 Do you agree with my opinion? Share your thoughts! ❤️#pepe #Memecoins🤑🤑
{spot}(PEPEUSDT)
🐸 To All $PEPE Coin Lovers!
Instead of waiting for unrealistic dreams like PEPE reaching $1, learn to seize opportunities when the price drops and take profits when it rises.
📍 My Personal Example:$PEPE
- Entry Price: $0.00000445
- Target Selling Price: $0.00000540
- Expected Profit: Approximately +21.35%
💡 Don't wait for the impossible. Take advantage of available opportunities and grow your profits step by step.
💬 Do you agree with my opinion? Share your thoughts! ❤️#pepe #Memecoins🤑🤑
Instead of waiting for unrealistic dreams like PEPE reaching $1, learn to seize opportunities when the price drops and take profits when it rises.
📍 My Personal Example:$PEPE
- Entry Price: $0.00000445
- Target Selling Price: $0.00000540
- Expected Profit: Approximately +21.35%
💡 Don't wait for the impossible. Take advantage of available opportunities and grow your profits step by step.
💬 Do you agree with my opinion? Share your thoughts! ❤️#pepe #Memecoins🤑🤑

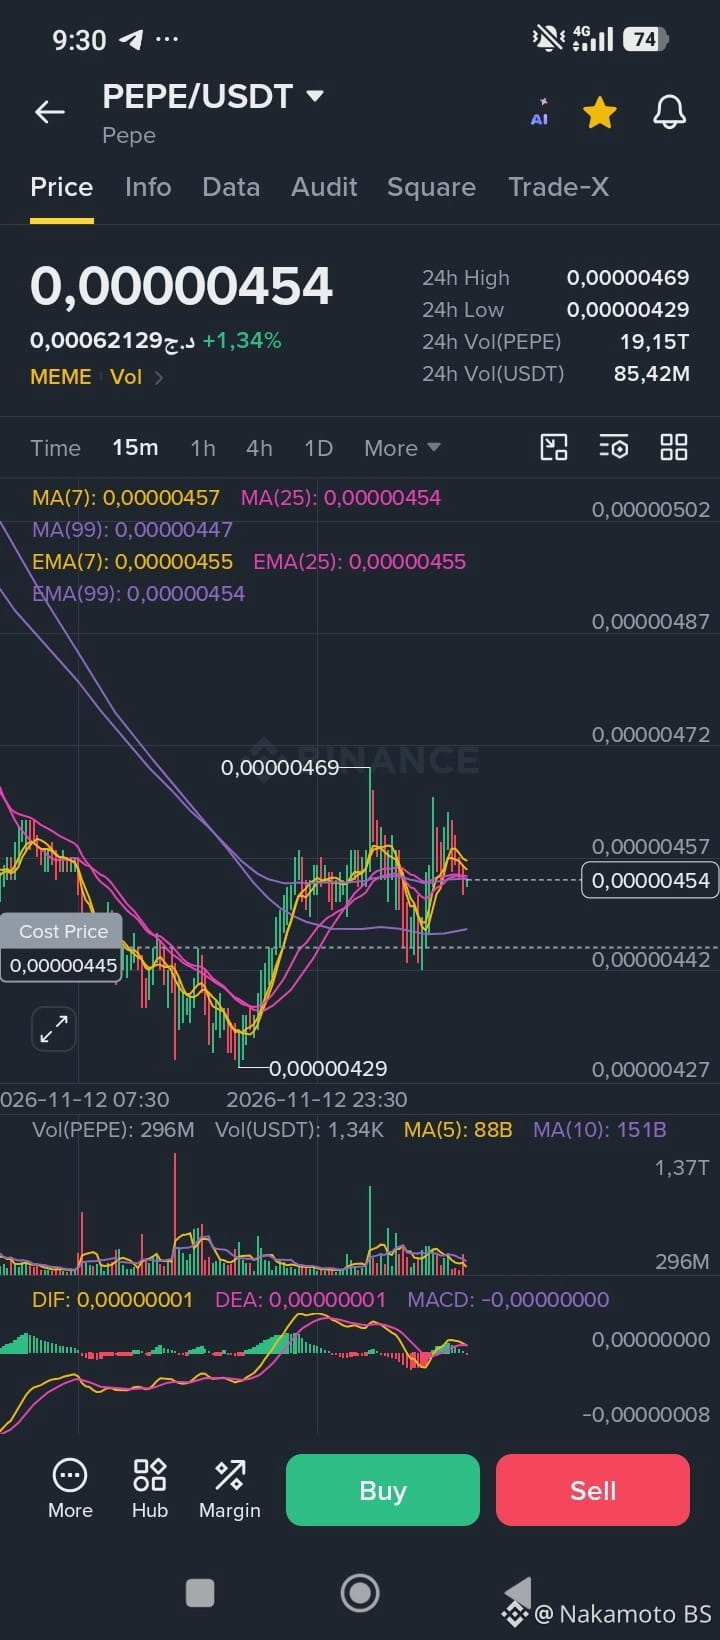
1
69
Көбірек контент көру үшін кіріңіз
Binance Square платформасында әлемдік криптоқоғамдастыққа қосылыңыз
⚡️ Криптовалюта туралы ең соңғы және пайдалы ақпаратты алыңыз.
💬 Әлемдегі ең ірі криптобиржаның сеніміне ие.
👍 Расталған авторлардың нақты пікірлерін табыңыз.
Электрондық пошта/телефон нөмірі
Трендтегі тақырыптар
WhoWillSucceedJensenHuangatNvidia?
64,323 рет көрілді
867 адам талқылап жатыр
Nvidia Says No CEO Talks Underway as "Stand With Jensen" Petition Tops 77,900 Signatures
Binance News
·20 лайк
·27.5k рет көрілді
WhatWillDriveCryptoandStocks’NextRebound?
400,580 рет көрілді
2,818 адам талқылап жатыр
BitcoinActiveSupplyInProfitDropsBelow45%
7,608 рет көрілді
169 адам талқылап жатыр