

Royal Queen9
4.7k Жариялаулар

Royal Queen9
Хабарлау
Пайдаланушыны блоктау
LETS BE FRIENDS AND TRADE TOGETHER.
484 Жазылым
463 Жазылушылар
239 лайк басылған
Жазбалар
·
--
#earningsseasons $BTC
{future}(BTCUSDT)
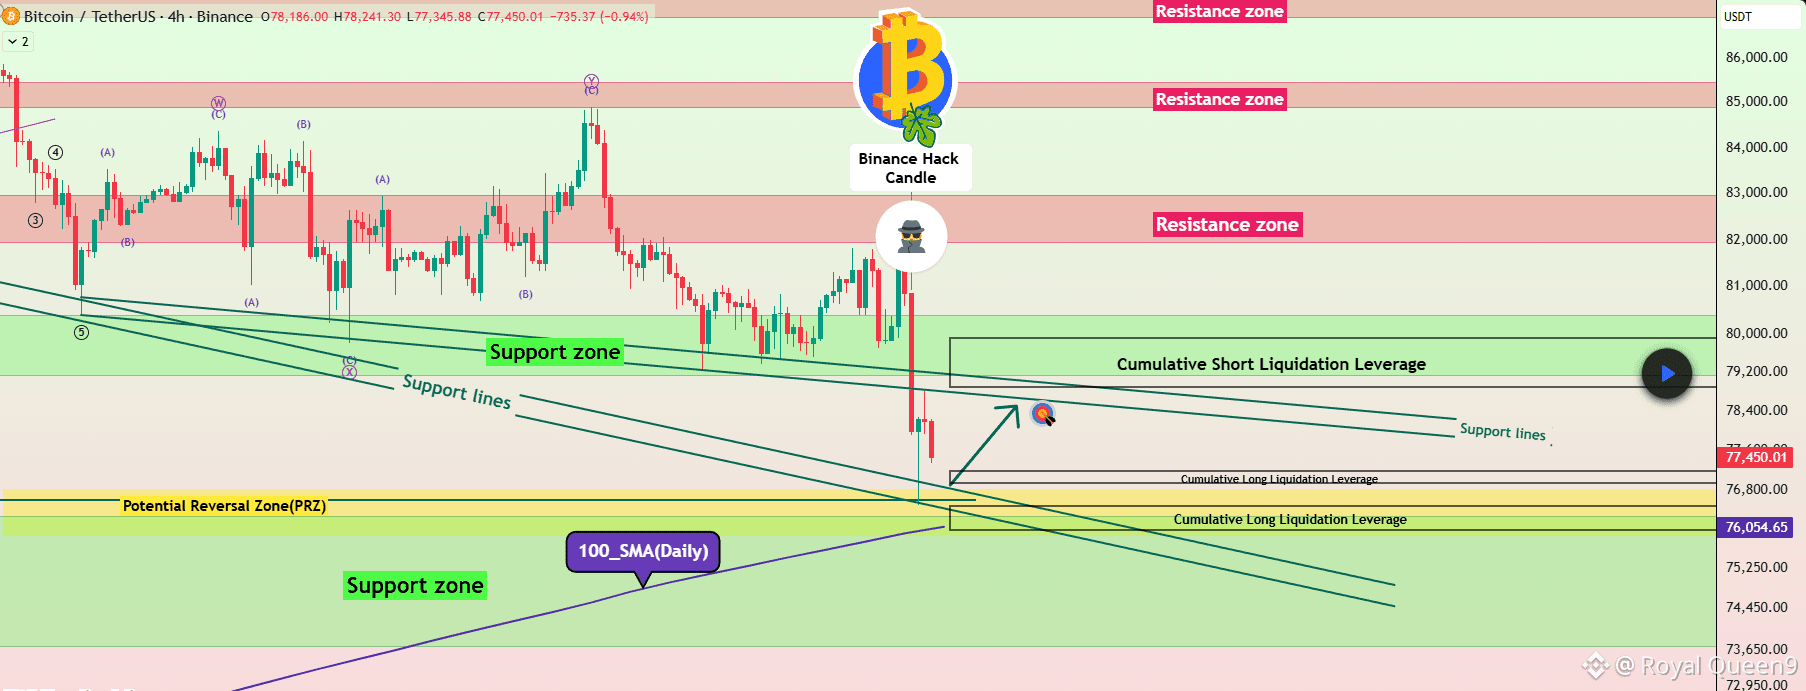
BTC/USDT 4H chart analysis
Based on your Binance 4H chart, BTC is showing a strong bearish breakdown after rejection from the $81,500–$82,000 area.
Current displayed price: $77,450
Important support zones
Price zone
Importance
$76,800–$77,000
Immediate support
$76,000–$76,500
Potential reversal zone
$75,000–$75,500
Secondary support
$73,650–$74,000
Major support
Resistance zones
Price zone
Importance
$78,400–$79,000
First recovery resistance
$79,200–$80,000
Major resistance
$82,000–$83,000
Strong supply zone
$84,800–$85,500
Higher resistance
The $79,200–$80,000 area is especially important because it previously acted as support.
BTC holds $76,000–$76,500.
A strong 4H bullish candle forms.
Price reclaims $78,400.
Potential upside targets: $79,200, $80,000 and $81,000.
ideways consolidation
BTC holds between $76,000 and $78,400.
Price consolidates before choosing its next direction.
#earningsseasons $BTC
BTC/USDT 4H chart analysis
Based on your Binance 4H chart, BTC is showing a strong bearish breakdown after rejection from the $81,500–$82,000 area.
Current displayed price: $77,450
Important support zones
Price zone
Importance
$76,800–$77,000
Immediate support
$76,000–$76,500
Potential reversal zone
$75,000–$75,500
Secondary support
$73,650–$74,000
Major support
Resistance zones
Price zone
Importance
$78,400–$79,000
First recovery resistance
$79,200–$80,000
Major resistance
$82,000–$83,000
Strong supply zone
$84,800–$85,500
Higher resistance
The $79,200–$80,000 area is especially important because it previously acted as support.
BTC holds $76,000–$76,500.
A strong 4H bullish candle forms.
Price reclaims $78,400.
Potential upside targets: $79,200, $80,000 and $81,000.
ideways consolidation
BTC holds between $76,000 and $78,400.
Price consolidates before choosing its next direction.
94
·
--
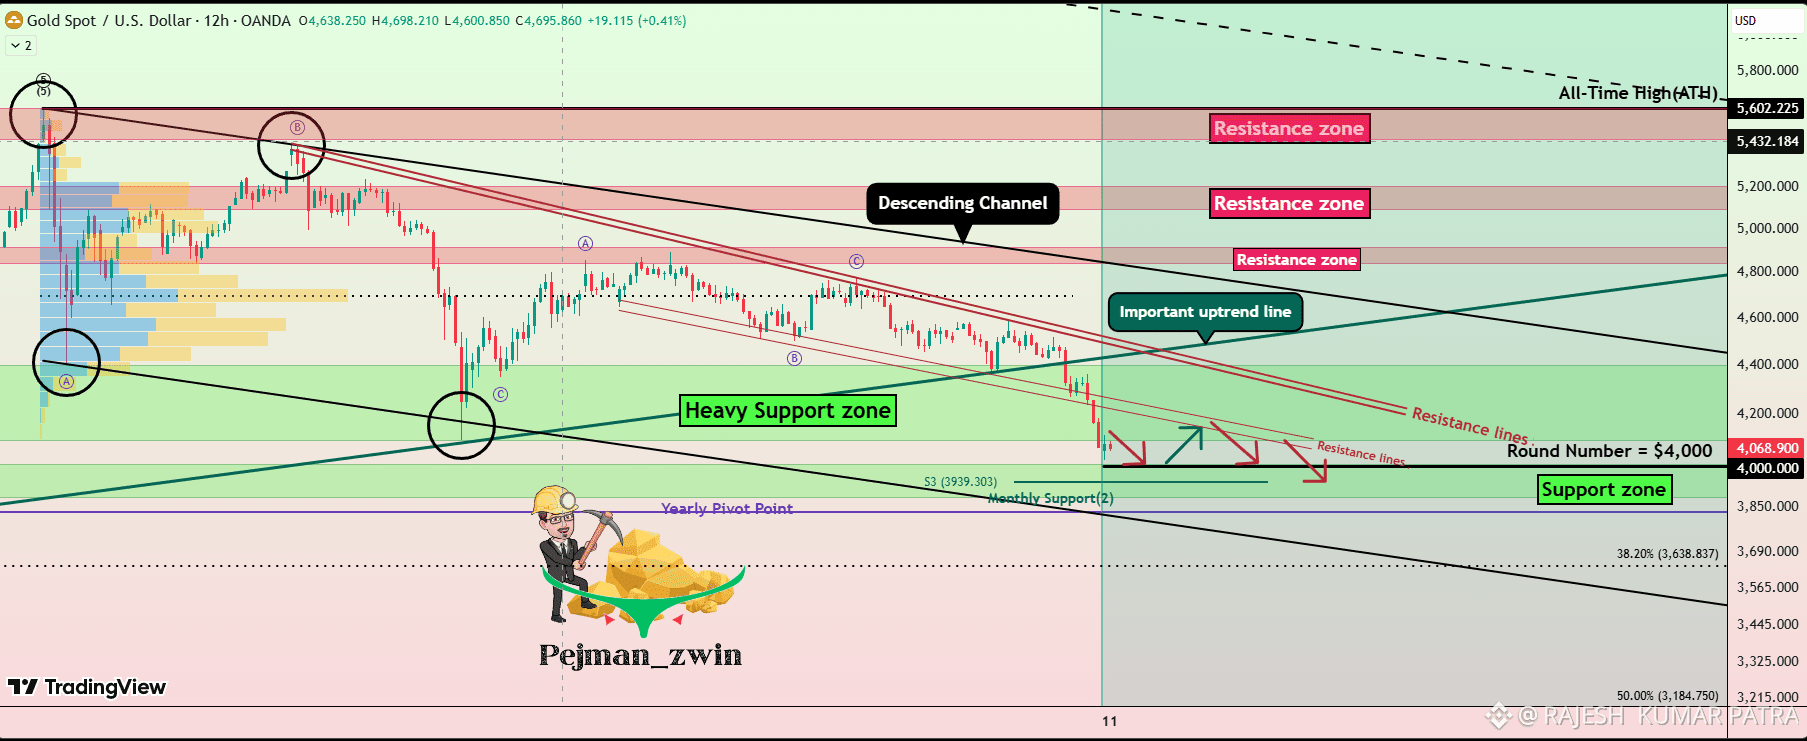
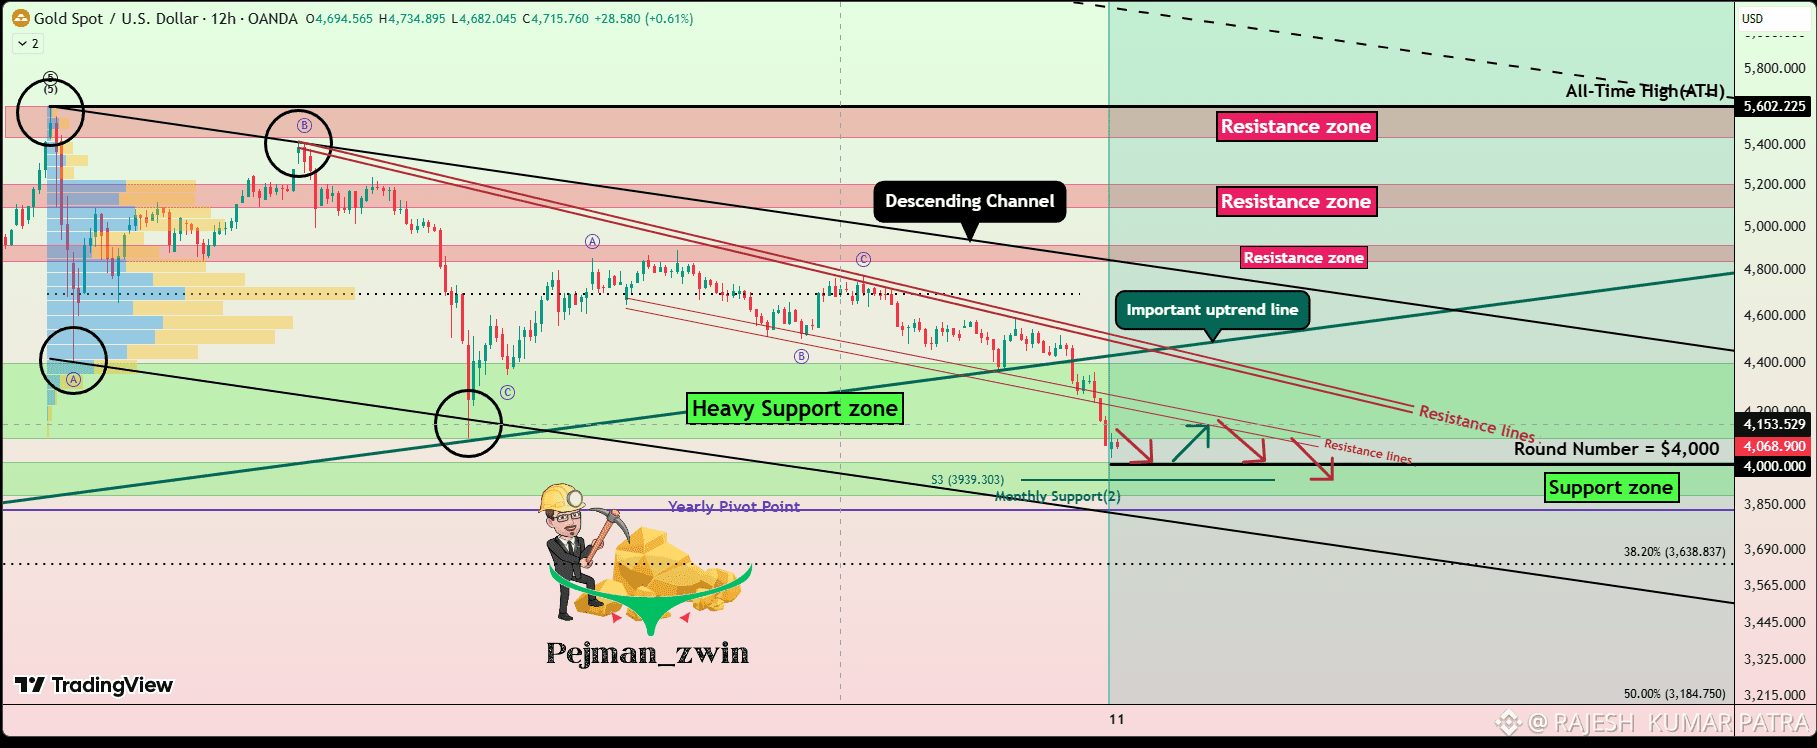
#earningsseason $XAUT $XAU
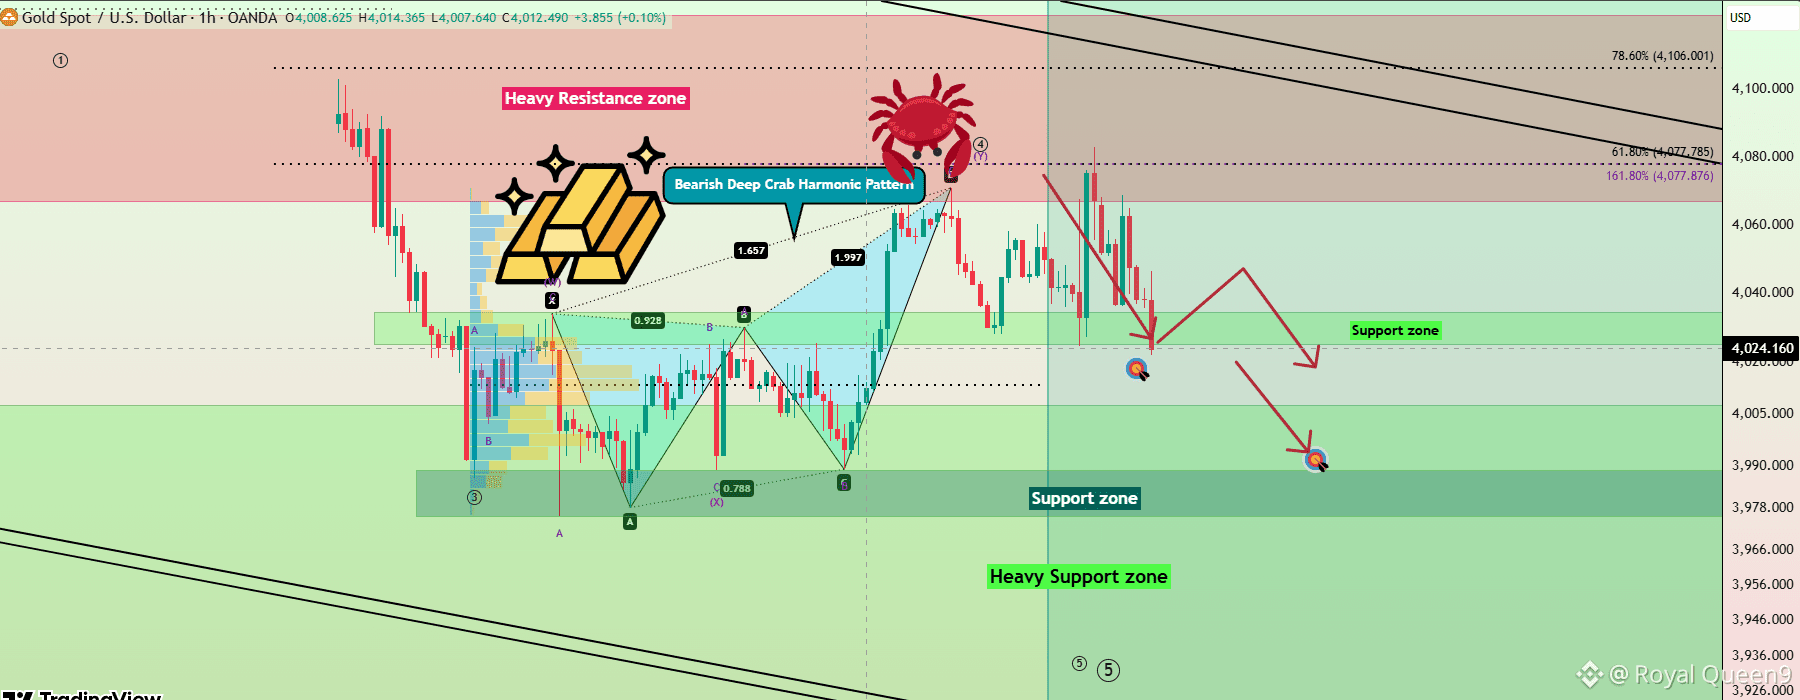
Heavy resistance
$4,068–$4,080
The recent swing-high rejection zone. A sustained break above it would weaken the bearish setup.
Harmonic resistance
$4,077.8–$4,078.0
The marked 61.8% and 161.8% Fibonacci levels cluster here. This overlaps the upper reversal area.
First support
$4,024–$4,032
The immediate support zone marked on your chart. Price is approaching this area
Second support
$3,978–$3,990
The lower highlighted demand zone and the next downside area if $4,024 fails.
Extended downside area
$3,956–$3,966
A possible further target if both support zones break decisively.
{future}(XAUTUSDT)
{spot}(XAUTUSDT)
#earningsseason $XAUT $XAU
Heavy resistance
$4,068–$4,080
The recent swing-high rejection zone. A sustained break above it would weaken the bearish setup.
Harmonic resistance
$4,077.8–$4,078.0
The marked 61.8% and 161.8% Fibonacci levels cluster here. This overlaps the upper reversal area.
First support
$4,024–$4,032
The immediate support zone marked on your chart. Price is approaching this area
Second support
$3,978–$3,990
The lower highlighted demand zone and the next downside area if $4,024 fails.
Extended downside area
$3,956–$3,966
A possible further target if both support zones break decisively.
173
·
--
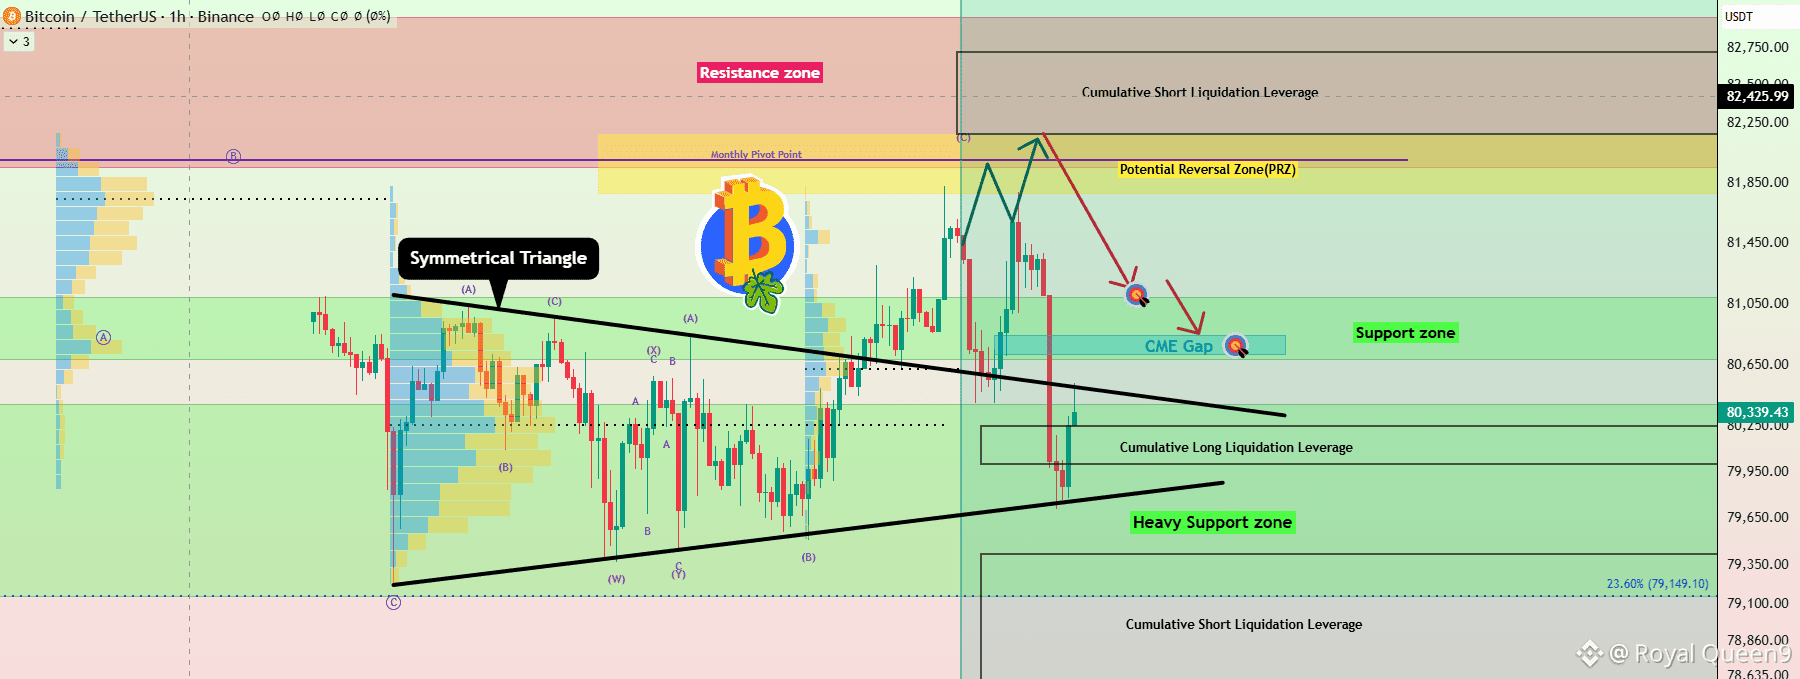
#earningsseason $BTC $BTC BTC/USDT 1H Chart Analysis
Resistance zone
$81,850–$82,200
Potential reversal zone (PRZ); sellers may reappear here.
Upper liquidity target
$82,400–$82,750
Area marked for cumulative short-liquidation leverage; potential upside magnet if resistance breaks.
Support zone / CME gap
$80,650–$80,850
First area to watch for a bounce, but it may now act as resistance after the breakdown.
Heavy support
$79,650–$80,250
Potential demand zone following the sharp sell-off; price has already reacted upward from around
Major lower reference
$79,149
The chart's 23.60% Fibonacci reference. A breakdown below heavy support could expose this level. $BTC
{spot}(BTCUSDT)
{future}(BTCUSDT)
#earningsseason $BTC $BTC BTC/USDT 1H Chart Analysis
Resistance zone
$81,850–$82,200
Potential reversal zone (PRZ); sellers may reappear here.
Upper liquidity target
$82,400–$82,750
Area marked for cumulative short-liquidation leverage; potential upside magnet if resistance breaks.
Support zone / CME gap
$80,650–$80,850
First area to watch for a bounce, but it may now act as resistance after the breakdown.
Heavy support
$79,650–$80,250
Potential demand zone following the sharp sell-off; price has already reacted upward from around
Major lower reference
$79,149
The chart's 23.60% Fibonacci reference. A breakdown below heavy support could expose this level. $BTC
17
·
--
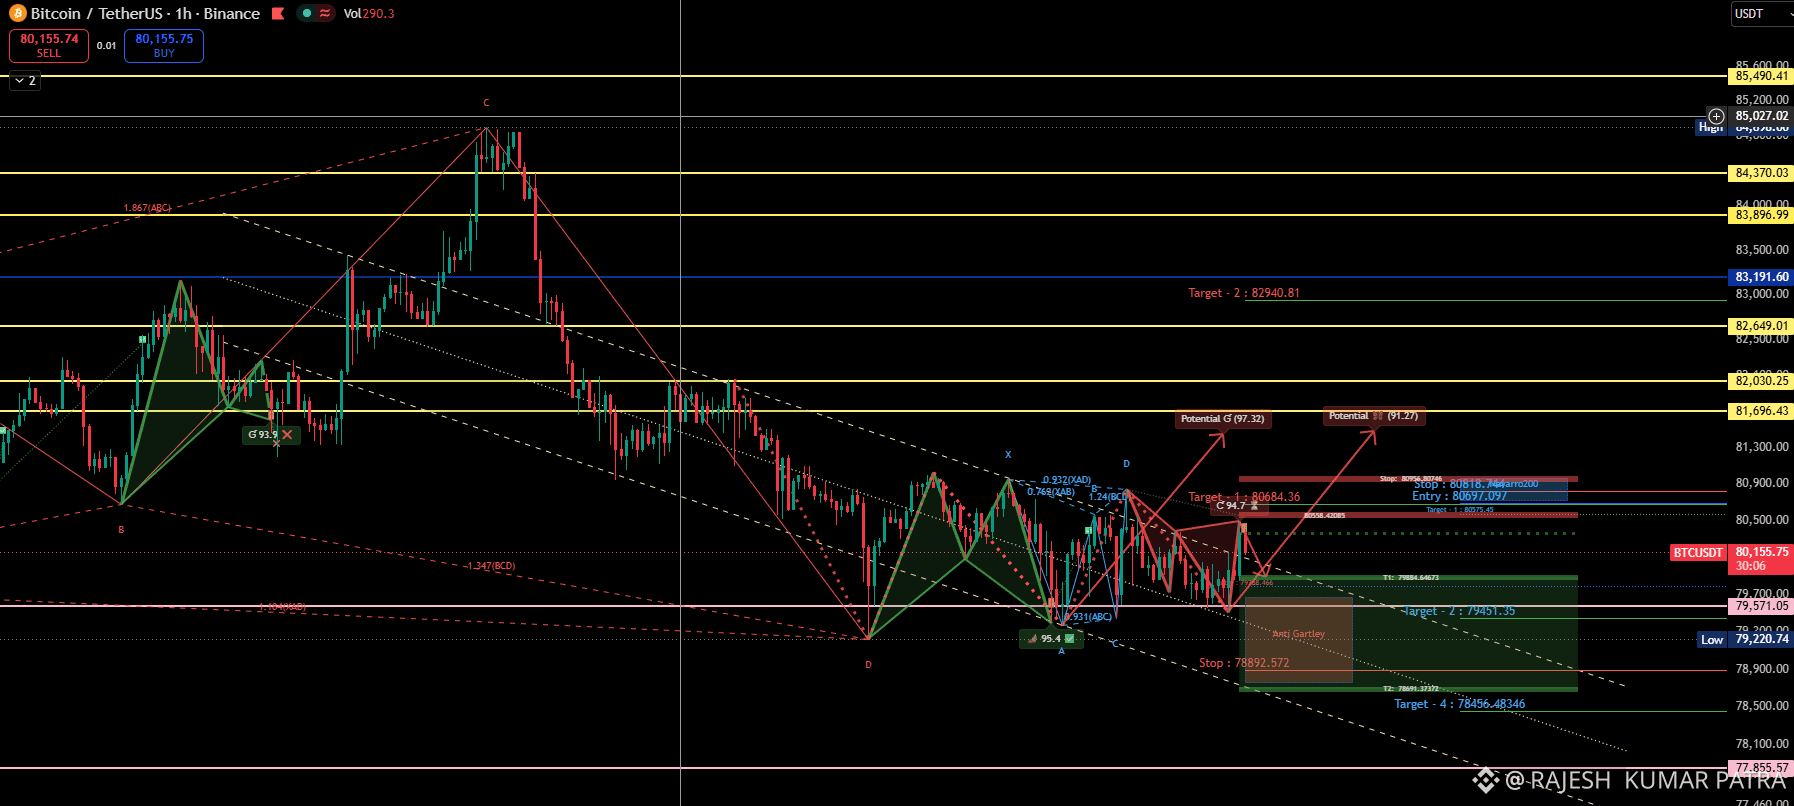
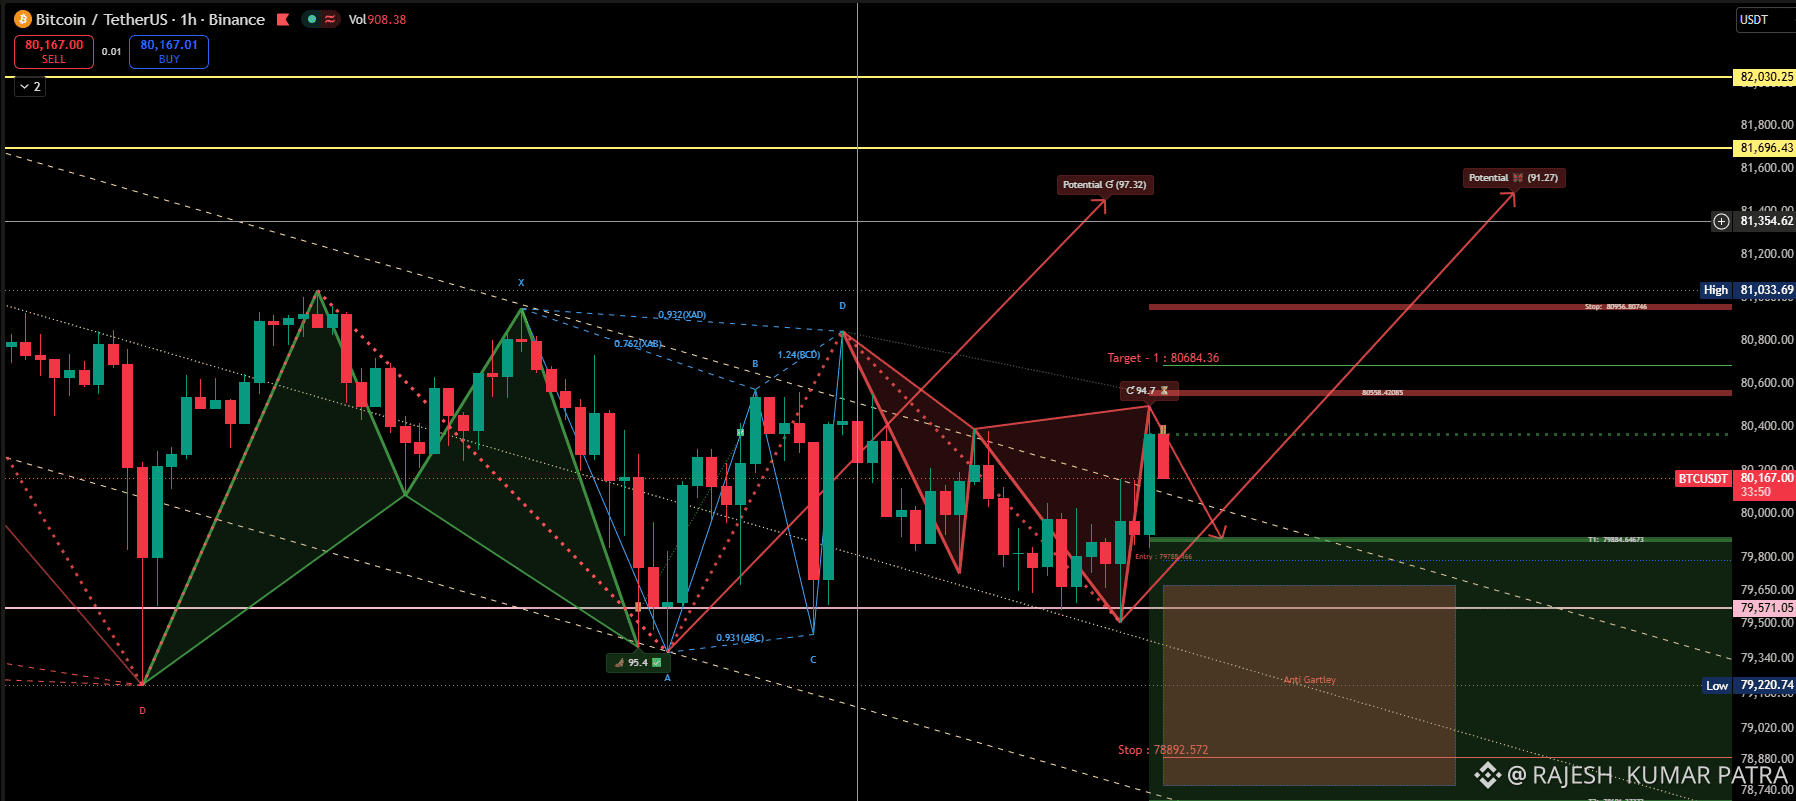
$BTC TC/USDT is trading around 80,167 USDT on the 1-hour Binance chart
$BTC Scenario 1: Bearish pullback
Confirmation: Price loses 79,850–79,900 and fails to reclaim it.
Potential levels: 79,571, followed by 79,220.
Extension: Around 78,893 if selling accelerates.
Invalidation: A sustained reclaim of the breakdown zone, especially with strong buying volume.
Scenario 2: Bullish continuation
Confirmation: A 1H close above 80,550–80,685, ideally followed by a successful retest.
Potential levels: 81,033, then 81,355.
Further resistance: 81,696.
Invalidation: A failed breakout followed by a move back below the reclaimed zone.
My conclusion
At roughly 80,167, I would wait for confirmation rather than chase a trade.
Below 79,850: bearish momentum could increase.
Above 80,600–80,685: the bullish recovery becomes more credible.
Between these zones: price may remain choppy, so risk/reward could be less attractive.
{future}(BTCUSDT)
{spot}(BTCUSDT)
$BTC TC/USDT is trading around 80,167 USDT on the 1-hour Binance chart
$BTC Scenario 1: Bearish pullback
Confirmation: Price loses 79,850–79,900 and fails to reclaim it.
Potential levels: 79,571, followed by 79,220.
Extension: Around 78,893 if selling accelerates.
Invalidation: A sustained reclaim of the breakdown zone, especially with strong buying volume.
Scenario 2: Bullish continuation
Confirmation: A 1H close above 80,550–80,685, ideally followed by a successful retest.
Potential levels: 81,033, then 81,355.
Further resistance: 81,696.
Invalidation: A failed breakout followed by a move back below the reclaimed zone.
My conclusion
At roughly 80,167, I would wait for confirmation rather than chase a trade.
Below 79,850: bearish momentum could increase.
Above 80,600–80,685: the bullish recovery becomes more credible.
Between these zones: price may remain choppy, so risk/reward could be less attractive.
62
·
--
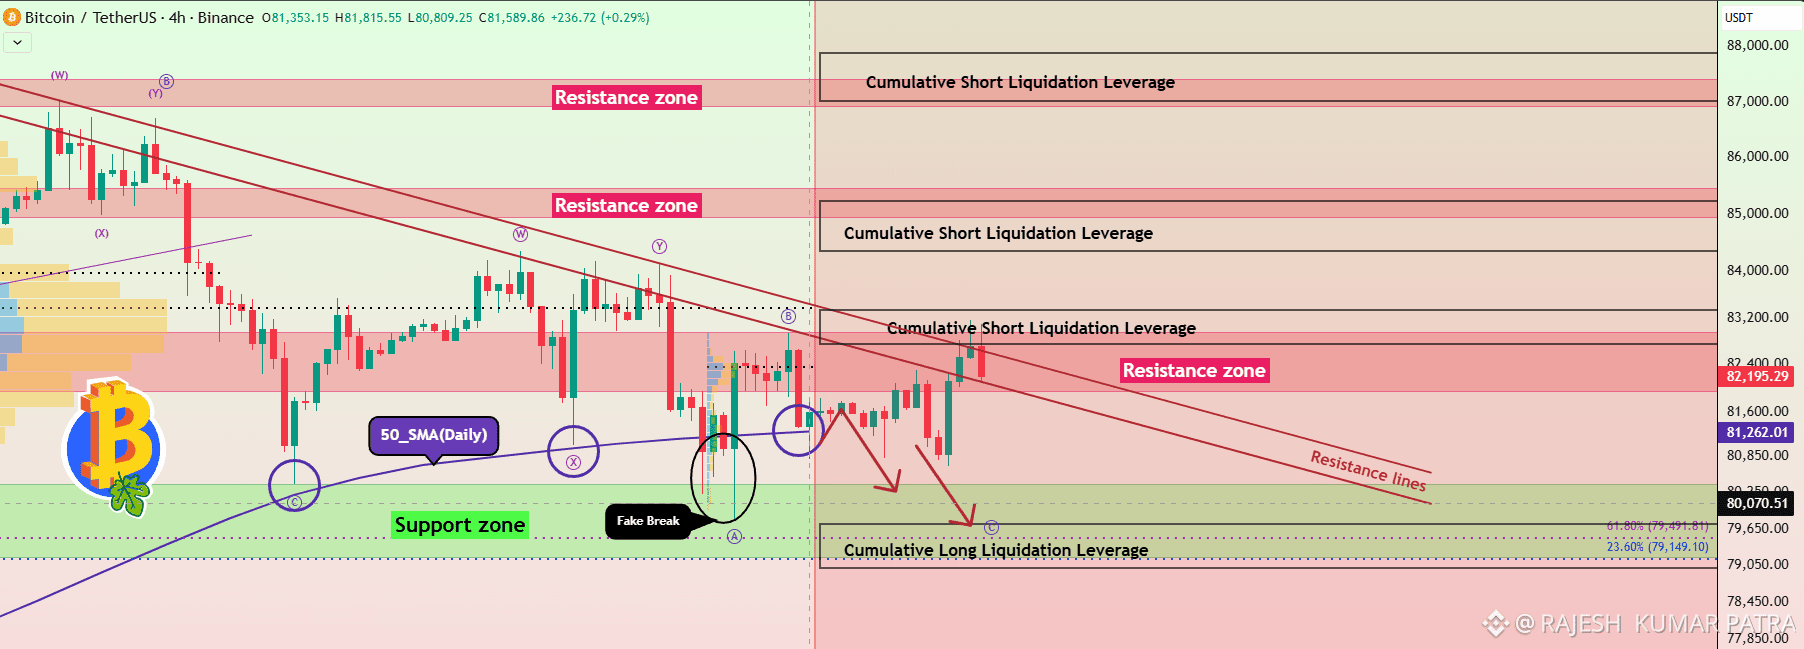
$BTC BTC/USDT 4H Chart Analysis
Based on your chart, BTC is trading around $81,590, approaching a major descending resistance trendline and a marked resistance zone. The setup looks cautiously bearish unless BTC breaks above resistance and holds it.
Current bias
Bearish
Below descending resistance
Key support
$79,150–$80,250
Potential bounce zone
1. Key resistance levels
$82,200–83,200
Immediate resistance
Price is testing the lower descending trendline and the nearby red resistance zone. A rejection here could send BTC back toward support.
$84,900–85,400
Major resistance
A stronger recovery could reach this supply zone, but buyers would need to overcome the nearer resistance first.
$86,900–87,400
Higher resistance
This is a more distant upside target if BTC breaks out of the broader descending structure.
2. Key support and downside targets
$80,250–80,700
First support
This is the upper part of your marked green support area. Watch for a bounce or a clean 4H breakdown.
$79,150–79,650
Major support / liquidity zone
Your chart marks the 23.6% Fibonacci level near $79,149 and the 61.8% level near $79,492. A move into this area could trigger liquidations or a relief bounce.
{spot}(BTCUSDT)
{future}(BTCUSDT)
$BTC BTC/USDT 4H Chart Analysis
Based on your chart, BTC is trading around $81,590, approaching a major descending resistance trendline and a marked resistance zone. The setup looks cautiously bearish unless BTC breaks above resistance and holds it.
Current bias
Bearish
Below descending resistance
Key support
$79,150–$80,250
Potential bounce zone
1. Key resistance levels
$82,200–83,200
Immediate resistance
Price is testing the lower descending trendline and the nearby red resistance zone. A rejection here could send BTC back toward support.
$84,900–85,400
Major resistance
A stronger recovery could reach this supply zone, but buyers would need to overcome the nearer resistance first.
$86,900–87,400
Higher resistance
This is a more distant upside target if BTC breaks out of the broader descending structure.
2. Key support and downside targets
$80,250–80,700
First support
This is the upper part of your marked green support area. Watch for a bounce or a clean 4H breakdown.
$79,150–79,650
Major support / liquidity zone
Your chart marks the 23.6% Fibonacci level near $79,149 and the 61.8% level near $79,492. A move into this area could trigger liquidations or a relief bounce.

1
115
·
--
$BTC
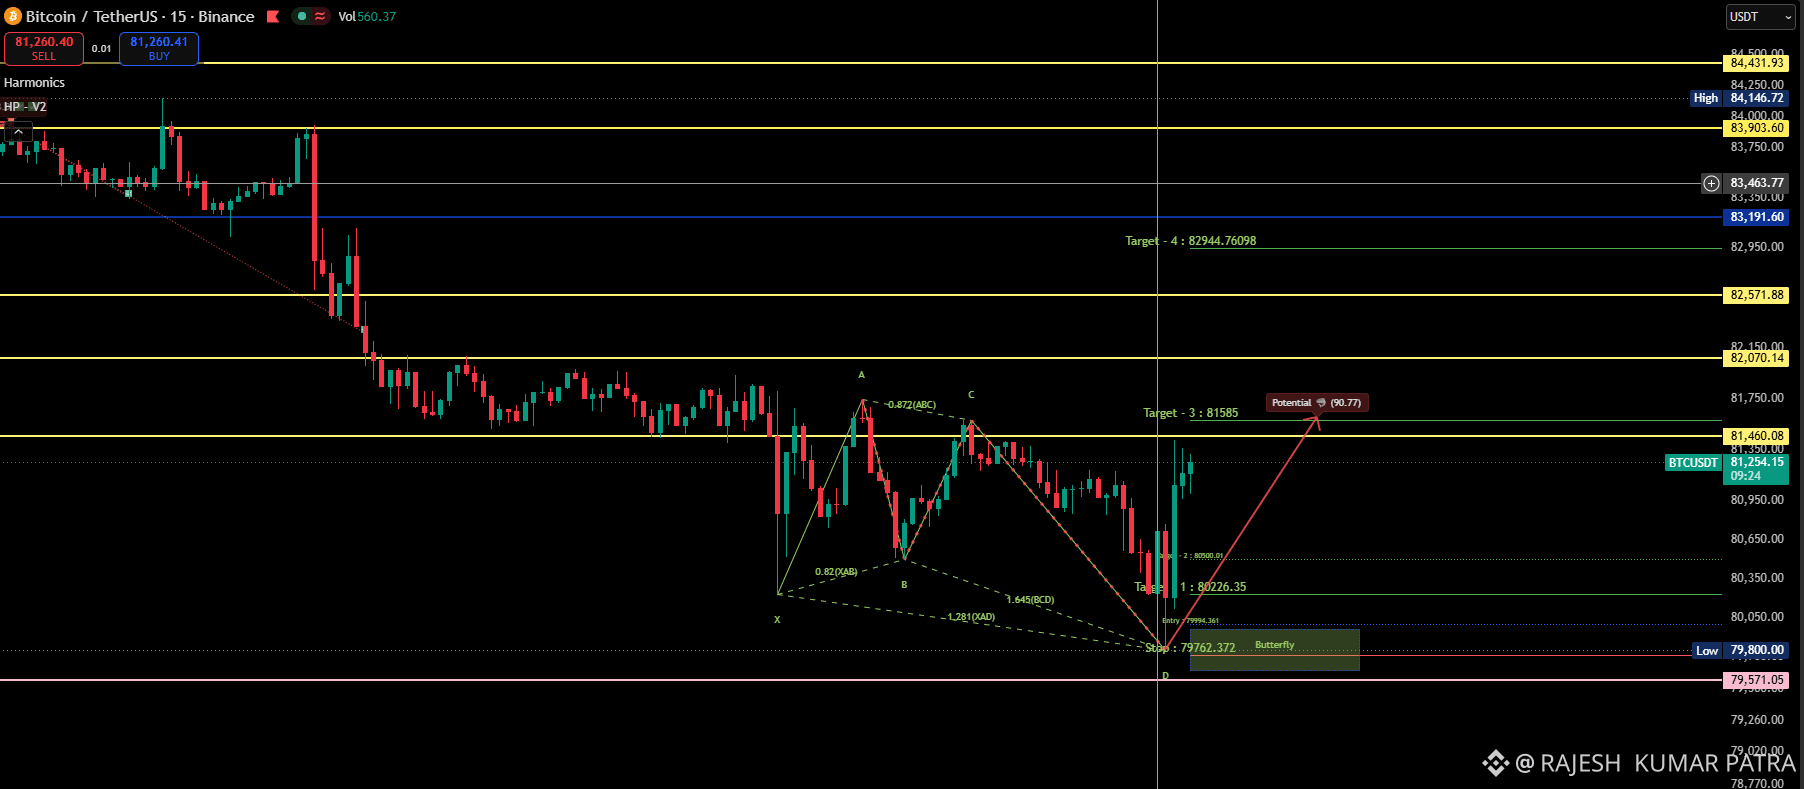
👍$BTC Harmonic Butterfly pattern
Your chart marks a potential bullish Butterfly completion near point D around 79,762.
X–A–B–C–D: The projected harmonic structure identifies a possible reversal zone.
D zone: The sharp reaction from around 79,800 supports the possibility that buyers are defending this level.
Projected rebound: The red arrow points toward approximately 81,585, which is a plausible first major recovery target if momentum continues.
Important: a harmonic pattern is a setup, not confirmation. The bounce alone does not prove that the low is in.
BTC closes a 15-minute candle above 81,460–81,585 and successfully retests that zone as support.
First upside objective: 82,070
Next objective: 82,572
Extended objective: 82,945
A breakout without a successful retest can still fail.
{future}(BTCUSDT)
{spot}(BTCUSDT)
$BTC
👍$BTC Harmonic Butterfly pattern
Your chart marks a potential bullish Butterfly completion near point D around 79,762.
X–A–B–C–D: The projected harmonic structure identifies a possible reversal zone.
D zone: The sharp reaction from around 79,800 supports the possibility that buyers are defending this level.
Projected rebound: The red arrow points toward approximately 81,585, which is a plausible first major recovery target if momentum continues.
Important: a harmonic pattern is a setup, not confirmation. The bounce alone does not prove that the low is in.
BTC closes a 15-minute candle above 81,460–81,585 and successfully retests that zone as support.
First upside objective: 82,070
Next objective: 82,572
Extended objective: 82,945
A breakout without a successful retest can still fail.
104
·
--
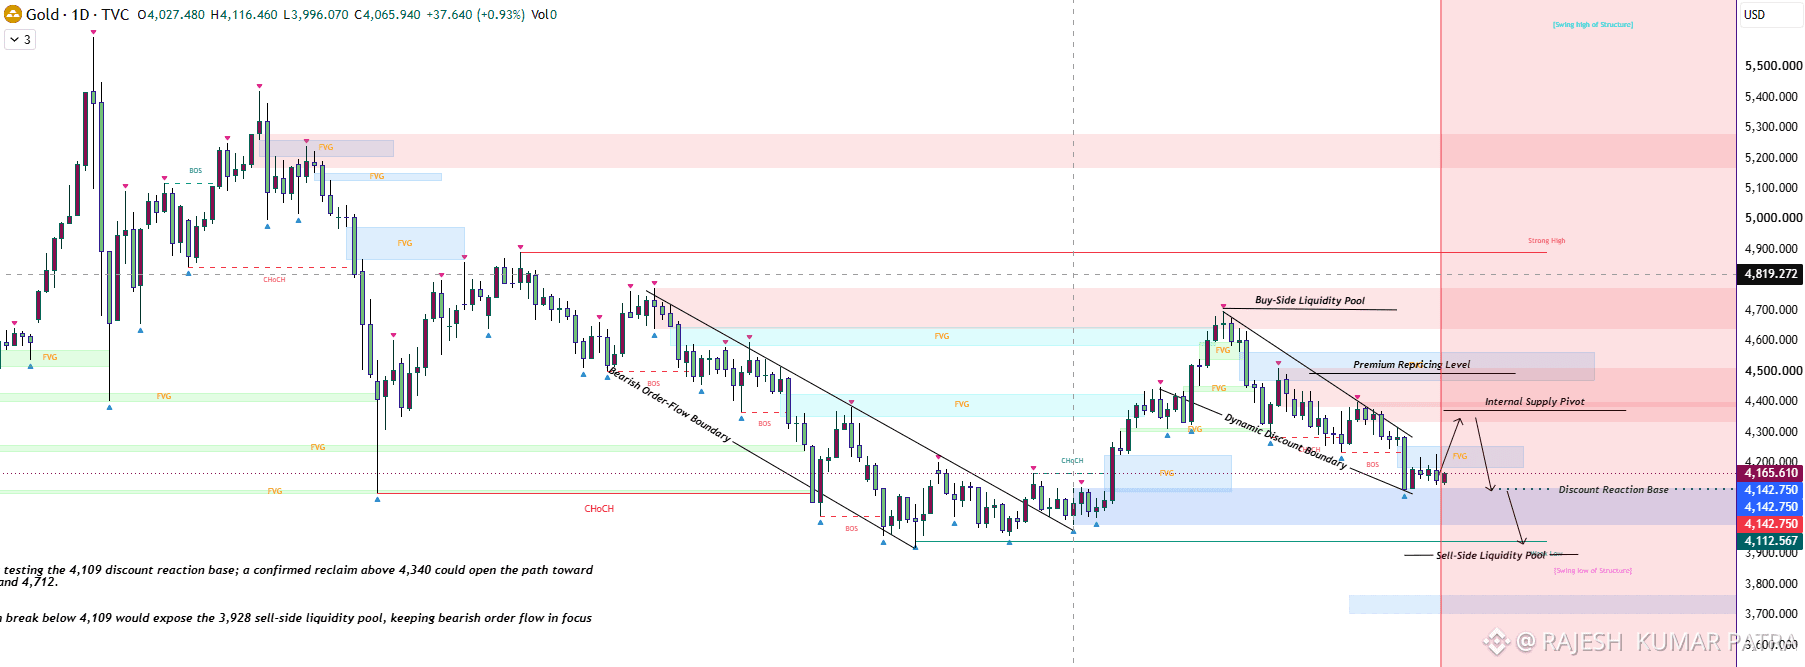
$XAU Current situation
Current price is around 4,165.
The important structure is:
4,109–4,143: discount reaction/support zone
4,340: key bullish reclaim level
4,400: internal supply pivot
4,500: premium repricing area
4,600–4,700: buy-side liquidity / major supply
3,928: sell-side liquidity target
The chart explicitly identifies 4,109 as the discount reaction base. That's extremely important.
🟢 Bullish scenario
Price is currently testing the lower discount area.
If buyers defend 4,109–4,143 and price starts reclaiming the nearby structure, I'd watch:
4,165 → 4,250 → 4,340
The important confirmation is a D1 reclaim above 4,340.
If that happens, the chart's upside path becomes much more interesting:
4,340 → 4,400 → 4,500 → 4,600 → 4,712
So I would not automatically short simply because the larger structure is bearish.
A successful defense of 4,109 followed by a 4,340 reclaim could produce a substantial countertrend rally.
🔴 Bearish scenario
This is the scenario I would consider more important structurally.
If price fails to hold 4,109, the discount reaction base is lost.
Then the next major objective shown on your chart is:
4,109 break → 3,928 sell-side liquidity
That's a move of roughly 181 points from 4,109.
And below 3,928, the chart has another significant demand/liquidity area around 3,700–3,750.
So the bearish sequence would be:
4,109 breakdown → 3,928 → ~3,700
This is also where your first chart's 3,800 support becomes relevant. The two charts aren't giving exactly the same level, but they're pointing toward the same broader downside region.
The most important level: 4,340
I'd treat 4,340 as the line separating bearish continuation from a potentially meaningful recovery.
Below 4,340
Bearish order flow remains dominant.
A rally into 4,300–4,340 that gets rejected would potentially provide a better short setup than selling at 4,165.
Above 4,340
{future}(XAUTUSDT)
{future}(XAUUSDT)
$XAU Current situation
Current price is around 4,165.
The important structure is:
4,109–4,143: discount reaction/support zone
4,340: key bullish reclaim level
4,400: internal supply pivot
4,500: premium repricing area
4,600–4,700: buy-side liquidity / major supply
3,928: sell-side liquidity target
The chart explicitly identifies 4,109 as the discount reaction base. That's extremely important.
🟢 Bullish scenario
Price is currently testing the lower discount area.
If buyers defend 4,109–4,143 and price starts reclaiming the nearby structure, I'd watch:
4,165 → 4,250 → 4,340
The important confirmation is a D1 reclaim above 4,340.
If that happens, the chart's upside path becomes much more interesting:
4,340 → 4,400 → 4,500 → 4,600 → 4,712
So I would not automatically short simply because the larger structure is bearish.
A successful defense of 4,109 followed by a 4,340 reclaim could produce a substantial countertrend rally.
🔴 Bearish scenario
This is the scenario I would consider more important structurally.
If price fails to hold 4,109, the discount reaction base is lost.
Then the next major objective shown on your chart is:
4,109 break → 3,928 sell-side liquidity
That's a move of roughly 181 points from 4,109.
And below 3,928, the chart has another significant demand/liquidity area around 3,700–3,750.
So the bearish sequence would be:
4,109 breakdown → 3,928 → ~3,700
This is also where your first chart's 3,800 support becomes relevant. The two charts aren't giving exactly the same level, but they're pointing toward the same broader downside region.
The most important level: 4,340
I'd treat 4,340 as the line separating bearish continuation from a potentially meaningful recovery.
Below 4,340
Bearish order flow remains dominant.
A rally into 4,300–4,340 that gets rejected would potentially provide a better short setup than selling at 4,165.
Above 4,340
210
·
--
$BTC TODAY$BTC
$BTC
{future}(BTCUSDT)
BTCUSDT — Today’s analysis (28 Sep 2026)
BTCUSDT is around $84.4K. Binance reported BTC briefly below $84K earlier today, while current technical data places the market around the $84.4K area. B
Intraday scenarios
Bullish scenario
A clean 15m/1h close above $85,050–85,600 could open the way toward $86.5K–87.4K.Reclaiming $87.4K would materially strengthen the short-term structure.
Bearish scenario
Failure around $84.6K–85K followed by a break below $84K could expose $83.5K.If $83.5K fails decisively, the next important area is roughly $81K–82K.
Current indicators are mixed: RSI(14) is around 48, while short-term MAs are giving sell signals and the 50/100/200-day averages are mostly showing buy signals. That suggests short-term consolidation inside a broader constructive structure, rather than a clean directional setup. II
$BTC TODAY
$BTC
$BTC
BTCUSDT — Today’s analysis (28 Sep 2026)
BTCUSDT is around $84.4K. Binance reported BTC briefly below $84K earlier today, while current technical data places the market around the $84.4K area. B
Intraday scenarios
Bullish scenario
A clean 15m/1h close above $85,050–85,600 could open the way toward $86.5K–87.4K.Reclaiming $87.4K would materially strengthen the short-term structure.
Bearish scenario
Failure around $84.6K–85K followed by a break below $84K could expose $83.5K.If $83.5K fails decisively, the next important area is roughly $81K–82K.
Current indicators are mixed: RSI(14) is around 48, while short-term MAs are giving sell signals and the 50/100/200-day averages are mostly showing buy signals. That suggests short-term consolidation inside a broader constructive structure, rather than a clean directional setup. II
84
·
--
Мақала
XAU$XAUT
{future}(XAUUSDT)
{future}(XAUTUSDT)
Market Structure
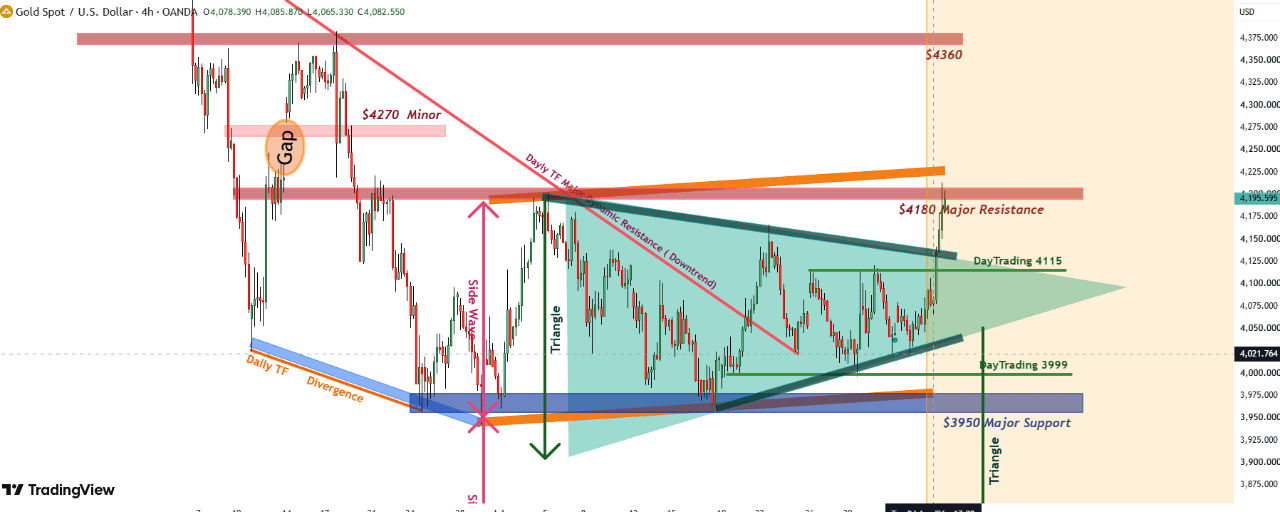
Trend: The broader trend has been bearish (descending trendline from the highs), but price has recently broken above the upper boundary of the symmetrical triangle.Current price: Around 4082, sitting just below the marked $4180 major resistance.The breakout candle is strong and impulsive, suggesting buyers have gained short-term control.
Key Levels
Resistance
4180 – Major resistance (currently being tested).4270 – Minor resistance.4360 – Major higher-timeframe resistance.
Support
4115 – Previous intraday resistance; ideally should become support after breakout.3999 – Strong day-trading support.3950 – Major demand/support zone.
Triangle Breakout
The green triangle shows:
Higher lows.Lower highs.Compression before expansion.
Price has now closed above the triangle, which is generally a bullish signal if the breakout is confirmed.
A confirmed breakout usually requires:
A 4H close above resistance.Retest holding as support.Continuation with increasing momentum.
Bullish Scenario (Higher Probability if 4180 Breaks)
If buyers can close decisively above 4180, the next targets become:
4230–42504270Then potentially 4360
This would also invalidate much of the previous bearish triangle.
Bearish Scenario
The biggest risk is a false breakout.
Watch for:
Rejection around 4180Price falling back inside the triangleLosing 4115
If that happens, sellers could target:
405039993950
A move back below the triangle would suggest the breakout failed.
Momentum Assessment
The breakout candle is:
Large-bodied.Nearly vertical.Breaking multiple resistance levels.
That usually indicates strong buying pressure, but such moves are often followed by either:
a brief consolidation, ora pullback to retest the breakout level before continuing.
Chasing immediately after such a strong candle generally carries more risk than waiting for confirmation.
Trading Plan
Bullish
Wait for a 4H close above 4180.Look for a retest of 4115–4180 that holds.Potential upside: 4270, then 4360.
Bearish
Watch for rejection wicks or bearish engulfing candles at 4180.If price falls back below 4115, expect a move toward 3999 and possibly 3950.
XAU
$XAUT
Market Structure
Trend: The broader trend has been bearish (descending trendline from the highs), but price has recently broken above the upper boundary of the symmetrical triangle.Current price: Around 4082, sitting just below the marked $4180 major resistance.The breakout candle is strong and impulsive, suggesting buyers have gained short-term control.
Key Levels
Resistance
4180 – Major resistance (currently being tested).4270 – Minor resistance.4360 – Major higher-timeframe resistance.
Support
4115 – Previous intraday resistance; ideally should become support after breakout.3999 – Strong day-trading support.3950 – Major demand/support zone.
Triangle Breakout
The green triangle shows:
Higher lows.Lower highs.Compression before expansion.
Price has now closed above the triangle, which is generally a bullish signal if the breakout is confirmed.
A confirmed breakout usually requires:
A 4H close above resistance.Retest holding as support.Continuation with increasing momentum.
Bullish Scenario (Higher Probability if 4180 Breaks)
If buyers can close decisively above 4180, the next targets become:
4230–42504270Then potentially 4360
This would also invalidate much of the previous bearish triangle.
Bearish Scenario
The biggest risk is a false breakout.
Watch for:
Rejection around 4180Price falling back inside the triangleLosing 4115
If that happens, sellers could target:
405039993950
A move back below the triangle would suggest the breakout failed.
Momentum Assessment
The breakout candle is:
Large-bodied.Nearly vertical.Breaking multiple resistance levels.
That usually indicates strong buying pressure, but such moves are often followed by either:
a brief consolidation, ora pullback to retest the breakout level before continuing.
Chasing immediately after such a strong candle generally carries more risk than waiting for confirmation.
Trading Plan
Bullish
Wait for a 4H close above 4180.Look for a retest of 4115–4180 that holds.Potential upside: 4270, then 4360.
Bearish
Watch for rejection wicks or bearish engulfing candles at 4180.If price falls back below 4115, expect a move toward 3999 and possibly 3950.
128
·
--
$BTC Current technical structure
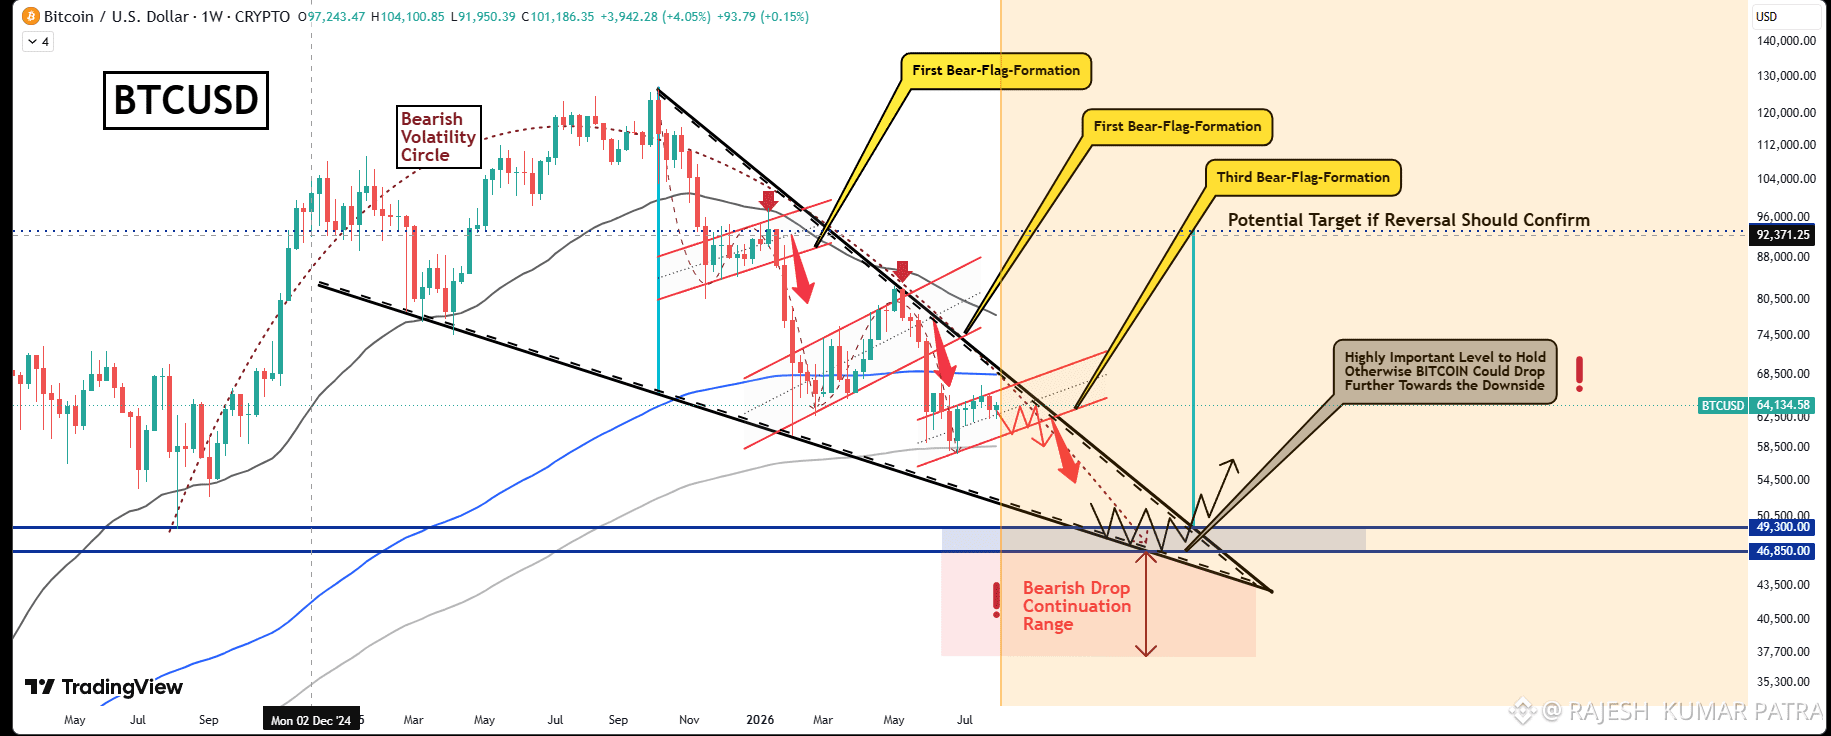
Primary trend: Bearish. The chart shows a sequence of lower highs and lower lows after the major peak. Pattern: Multiple descending channels/bear flags have been drawn. Repeated bear flags following a sharp decline typically represent continuation patterns, but they are not guarantees. Moving averages:
Price is below the shorter moving average (gray), indicating weaker intermediate momentum. Price remains above the long-term moving average (blue), so the longer-term bull market is not necessarily invalidated.
Important price levels
Major support zone: Approximately $46.8k–49.3k (highlighted in blue).
This is the most significant support shown on the chart. A strong weekly reaction here could trigger a medium-term recovery.
Current region: Around $64k, which sits between major support and higher resistance. Resistance areas:
Around $74k–80k Then $92k–96k, where the chart labels a possible reversal target.
What would strengthen the bearish case?
A bearish continuation would become more convincing if:
Price breaks below the rising red support channel. Weekly closes remain below the descending black trendline. Selling volume increases during the breakdown. The $46.8k–49.3k support zone fails to hold.
What would weaken the bearish case?
The bearish thesis would lose strength if:
BTC breaks and closes above the descending black trendline. Price starts making higher highs and higher lows on the weekly timeframe. The breakout is supported by strong volume.
About the projected move to $46k
The chart illustrates a projected decline toward the support zone. That projection is one possible scenario, not a prediction. Technical patterns such as bear flags can fail, especially when broader market sentiment or macroeconomic conditions change.
One important note
{future}(BTCUSDT)
$BTC Current technical structure
Primary trend: Bearish. The chart shows a sequence of lower highs and lower lows after the major peak. Pattern: Multiple descending channels/bear flags have been drawn. Repeated bear flags following a sharp decline typically represent continuation patterns, but they are not guarantees. Moving averages:
Price is below the shorter moving average (gray), indicating weaker intermediate momentum. Price remains above the long-term moving average (blue), so the longer-term bull market is not necessarily invalidated.
Important price levels
Major support zone: Approximately $46.8k–49.3k (highlighted in blue).
This is the most significant support shown on the chart. A strong weekly reaction here could trigger a medium-term recovery.
Current region: Around $64k, which sits between major support and higher resistance. Resistance areas:
Around $74k–80k Then $92k–96k, where the chart labels a possible reversal target.
What would strengthen the bearish case?
A bearish continuation would become more convincing if:
Price breaks below the rising red support channel. Weekly closes remain below the descending black trendline. Selling volume increases during the breakdown. The $46.8k–49.3k support zone fails to hold.
What would weaken the bearish case?
The bearish thesis would lose strength if:
BTC breaks and closes above the descending black trendline. Price starts making higher highs and higher lows on the weekly timeframe. The breakout is supported by strong volume.
About the projected move to $46k
The chart illustrates a projected decline toward the support zone. That projection is one possible scenario, not a prediction. Technical patterns such as bear flags can fail, especially when broader market sentiment or macroeconomic conditions change.
One important note
82
·
--
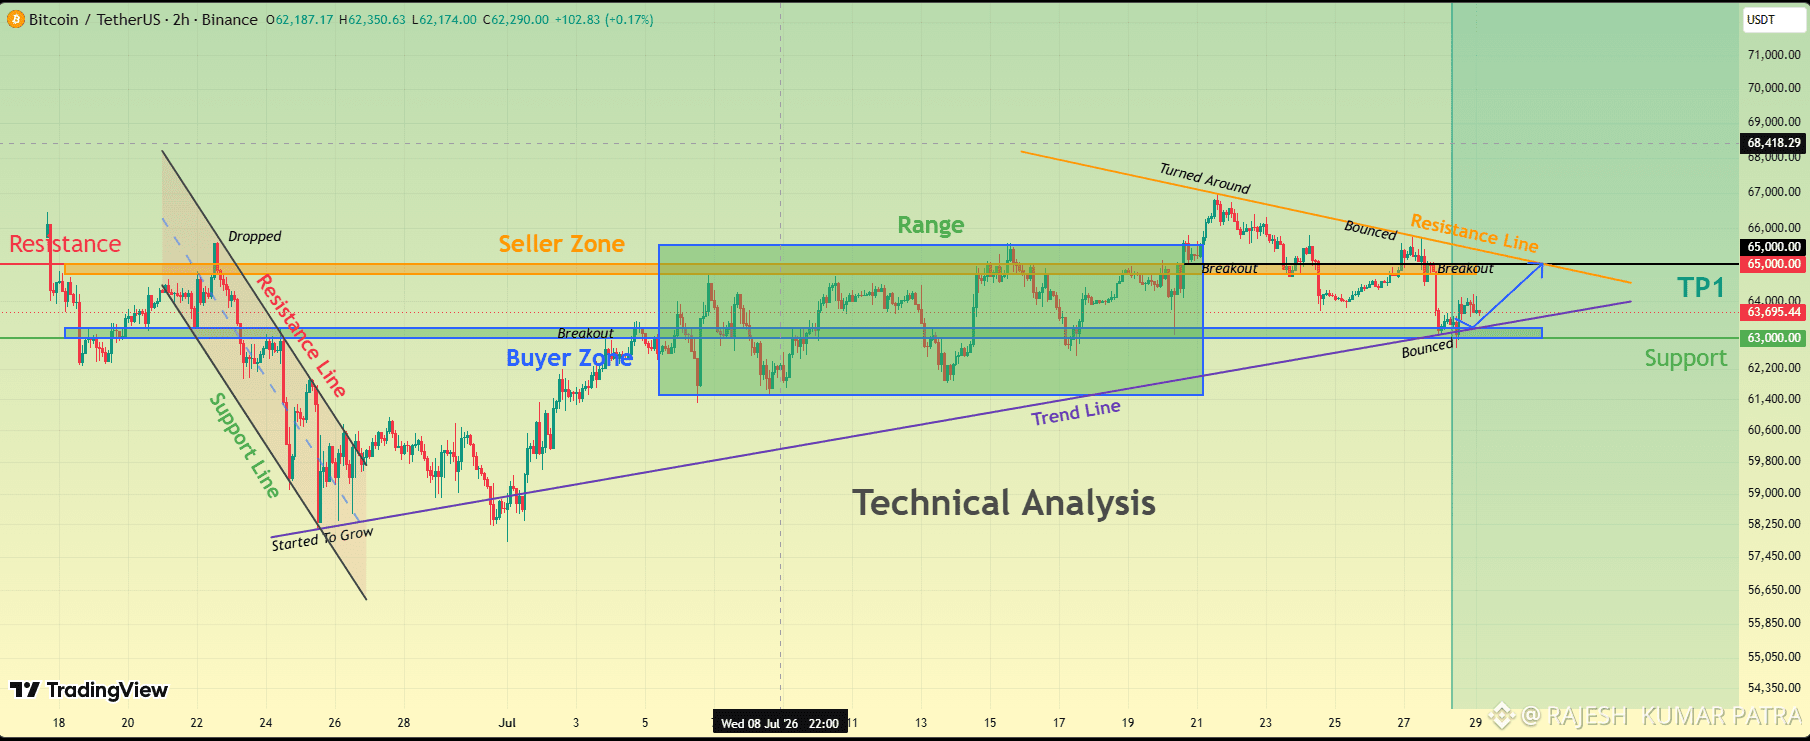
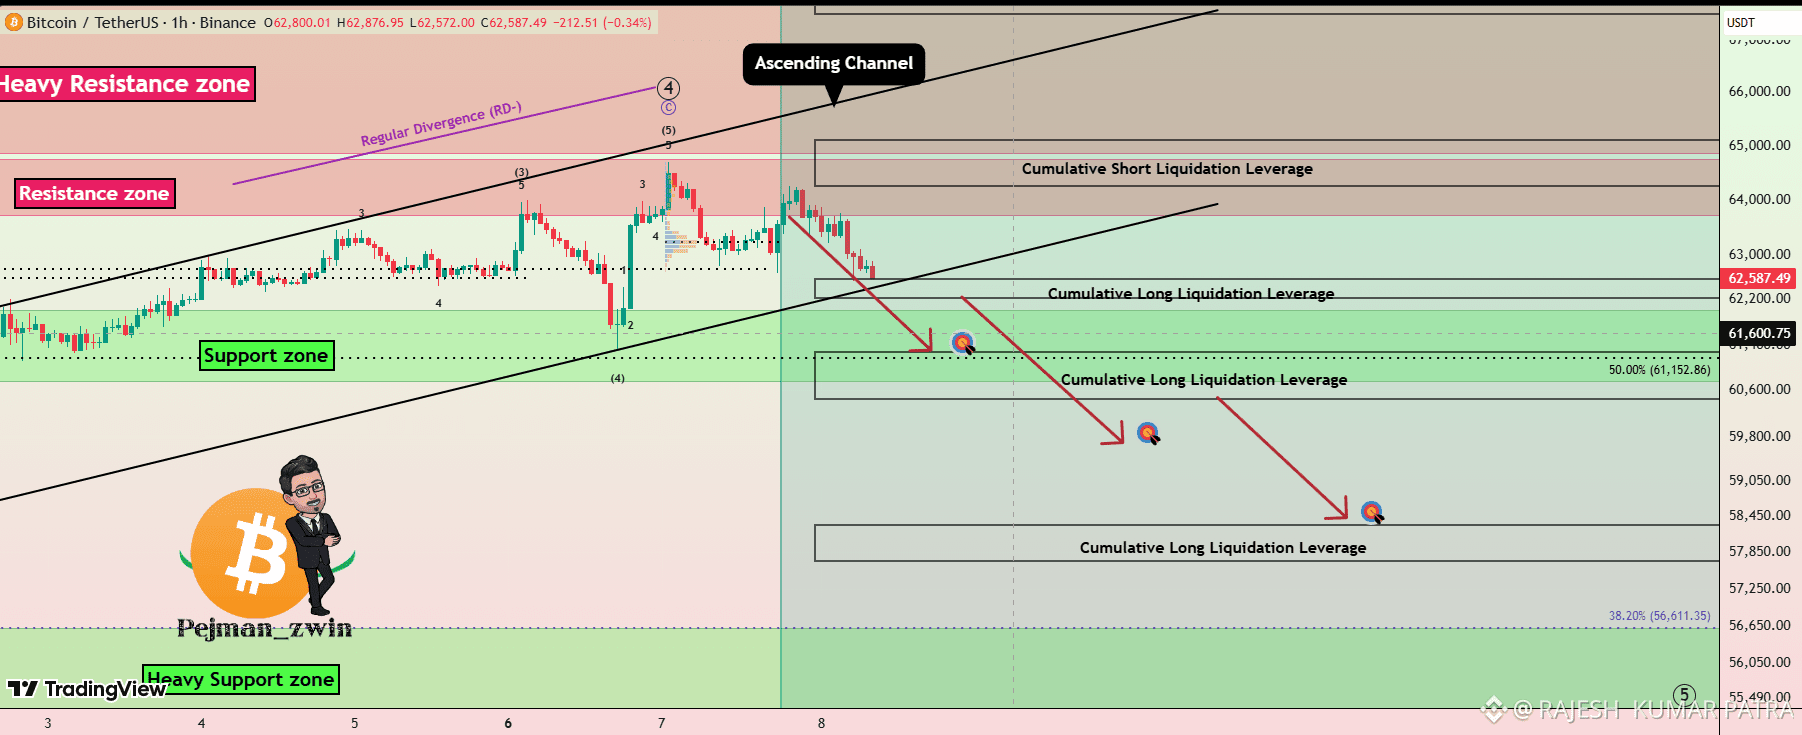
$BTC Bitcoin is trading in a consolidation phase, with traders waiting for a catalyst. The biggest near-term event is the FOMC meeting, which is keeping volatility relatively subdued. Market commentary also notes that recent industry developments have reduced trading activity, contributing to a range-bound market.
Technical Outlook
Trend: Neutral to slightly bearish in the short term. Momentum: Weak; buyers have not yet confirmed a breakout. Volatility: Compressed, suggesting a larger move may follow.
Bullish Scenario
A strong breakout above the current resistance zone with increasing volume could trigger momentum buying. Watch for confirmation on the 4-hour or daily candle before considering long entries.
Bearish Scenario
If Bitcoin loses nearby support, sellers could push price lower as traders reduce risk ahead of macroeconomic announcements. A break below support accompanied by high volume would strengthen the bearish case
{future}(BTCUSDT)
$BTC Bitcoin is trading in a consolidation phase, with traders waiting for a catalyst. The biggest near-term event is the FOMC meeting, which is keeping volatility relatively subdued. Market commentary also notes that recent industry developments have reduced trading activity, contributing to a range-bound market.
Technical Outlook
Trend: Neutral to slightly bearish in the short term. Momentum: Weak; buyers have not yet confirmed a breakout. Volatility: Compressed, suggesting a larger move may follow.
Bullish Scenario
A strong breakout above the current resistance zone with increasing volume could trigger momentum buying. Watch for confirmation on the 4-hour or daily candle before considering long entries.
Bearish Scenario
If Bitcoin loses nearby support, sellers could push price lower as traders reduce risk ahead of macroeconomic announcements. A break below support accompanied by high volume would strengthen the bearish case
69
·
--
#opg $OPG Exploring @OpenGradient today and I’m impressed by the vision of verifiable AI infrastructure. OpenGradient Chat stands out by combining access to leading AI models with privacy-focused architecture that separates user identity from prompts. As AI adoption grows, transparency, security, and cryptographic verification could become essential building blocks for the next generation of intelligent applications. The utility of $OPG within this ecosystem makes the project worth watching as decentralized AI continues to evolve. #OPG
#opg $OPG Exploring @OpenGradient today and I’m impressed by the vision of verifiable AI infrastructure. OpenGradient Chat stands out by combining access to leading AI models with privacy-focused architecture that separates user identity from prompts. As AI adoption grows, transparency, security, and cryptographic verification could become essential building blocks for the next generation of intelligent applications. The utility of $OPG within this ecosystem makes the project worth watching as decentralized AI continues to evolve. #OPG
1
71
·
--
#BinancePickAndWin This is a interesting Event for all binance users🥳🥳🥳
join WC football match prediction and win the big reward🥳
#BinancePickAndWin This is a interesting Event for all binance users🥳🥳🥳
join WC football match prediction and win the big reward🥳
join WC football match prediction and win the big reward🥳

56
·
--
#BinancePickAndWin This is a interesting Event for all binance users🥳🥳🥳
join WC football match prediction and win the big reward🥳
#BinancePickAndWin This is a interesting Event for all binance users🥳🥳🥳
join WC football match prediction and win the big reward🥳
join WC football match prediction and win the big reward🥳

66

Көбірек контент көру үшін кіріңіз
Binance Square платформасында әлемдік криптоқоғамдастыққа қосылыңыз
⚡️ Криптовалюта туралы ең соңғы және пайдалы ақпаратты алыңыз.
💬 Әлемдегі ең ірі криптобиржаның сеніміне ие.
👍 Расталған авторлардың нақты пікірлерін табыңыз.
Электрондық пошта/телефон нөмірі