
RASHADYT
220 Жариялаулар

RASHADYT
Хабарлау
Пайдаланушыны блоктау
83 Жазылым
25 Жазылушылар
231 лайк басылған
Жазбалар
Барлығы
Баға ұсыныстары
·
--
Төмен (кемімелі)
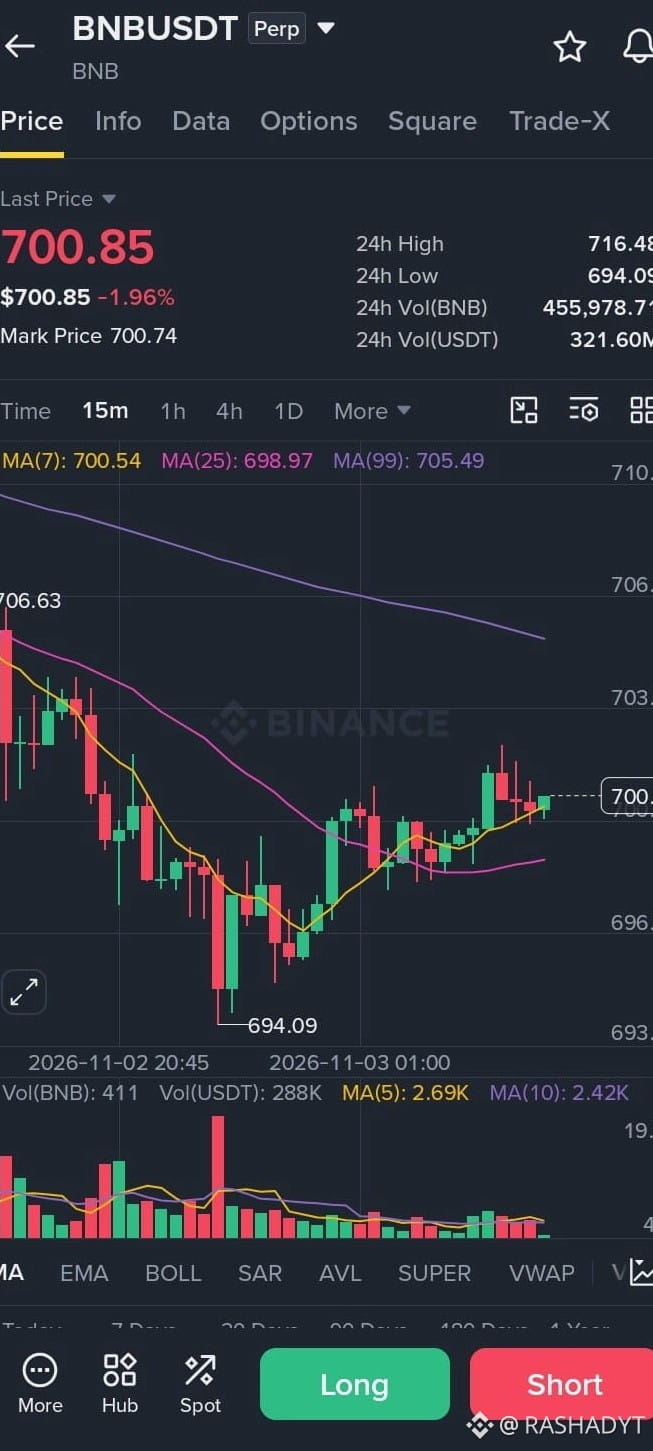
📊 BNB/USDT – Market Update
🔴 Current Price: $700.85
📉 24H Change: -1.96%
📈 24H High: $716.48
📉 24H Low: $694.09
🔍 Technical Analysis (15M)
BNB is showing a short-term recovery after dropping to $694.09. Buyers are attempting to regain control, but the MA(99) at $705.49 remains a key resistance.
🟢 Key Support Levels
- Support 1: $698.00
- Support 2: $696.78
- Major Support: $694.09
🔴 Key Resistance Levels
- Resistance 1: $703.43
- Resistance 2: $705.49
- Major Resistance: $706.75
📈 Bullish Scenario
A strong breakout above $703.43 could open the door toward $705.49–$706.75.
📉 Bearish Scenario
Failure to hold $698.00 may bring another retest of $696.78 and $694.09.
🎯 My Market Outlook
BNB is attempting a recovery, but the overa$ll short-term structure remains cautious. I’m watching volume confirmation and the $703–$705 resistance zone before expecting a stronger move.
💬 What's your prediction? BULLISH 🟢 or BEARISH 🔴?
#BNB $BNB
{spot}(BNBUSDT)
#BNBUSDT #Binance #CryptoAnalysis #TechnicalAnalysis #CryptoMarket #MarketUpdate
📊 BNB/USDT – Market Update
🔴 Current Price: $700.85
📉 24H Change: -1.96%
📈 24H High: $716.48
📉 24H Low: $694.09
🔍 Technical Analysis (15M)
BNB is showing a short-term recovery after dropping to $694.09. Buyers are attempting to regain control, but the MA(99) at $705.49 remains a key resistance.
🟢 Key Support Levels
- Support 1: $698.00
- Support 2: $696.78
- Major Support: $694.09
🔴 Key Resistance Levels
- Resistance 1: $703.43
- Resistance 2: $705.49
- Major Resistance: $706.75
📈 Bullish Scenario
A strong breakout above $703.43 could open the door toward $705.49–$706.75.
📉 Bearish Scenario
Failure to hold $698.00 may bring another retest of $696.78 and $694.09.
🎯 My Market Outlook
BNB is attempting a recovery, but the overa$ll short-term structure remains cautious. I’m watching volume confirmation and the $703–$705 resistance zone before expecting a stronger move.
💬 What's your prediction? BULLISH 🟢 or BEARISH 🔴?
#BNB $BNB
#BNBUSDT #Binance #CryptoAnalysis #TechnicalAnalysis #CryptoMarket #MarketUpdate
🔴 Current Price: $700.85
📉 24H Change: -1.96%
📈 24H High: $716.48
📉 24H Low: $694.09
🔍 Technical Analysis (15M)
BNB is showing a short-term recovery after dropping to $694.09. Buyers are attempting to regain control, but the MA(99) at $705.49 remains a key resistance.
🟢 Key Support Levels
- Support 1: $698.00
- Support 2: $696.78
- Major Support: $694.09
🔴 Key Resistance Levels
- Resistance 1: $703.43
- Resistance 2: $705.49
- Major Resistance: $706.75
📈 Bullish Scenario
A strong breakout above $703.43 could open the door toward $705.49–$706.75.
📉 Bearish Scenario
Failure to hold $698.00 may bring another retest of $696.78 and $694.09.
🎯 My Market Outlook
BNB is attempting a recovery, but the overa$ll short-term structure remains cautious. I’m watching volume confirmation and the $703–$705 resistance zone before expecting a stronger move.
💬 What's your prediction? BULLISH 🟢 or BEARISH 🔴?
#BNB $BNB
#BNBUSDT #Binance #CryptoAnalysis #TechnicalAnalysis #CryptoMarket #MarketUpdate
1
72
·
--
Жоғары (өспелі)
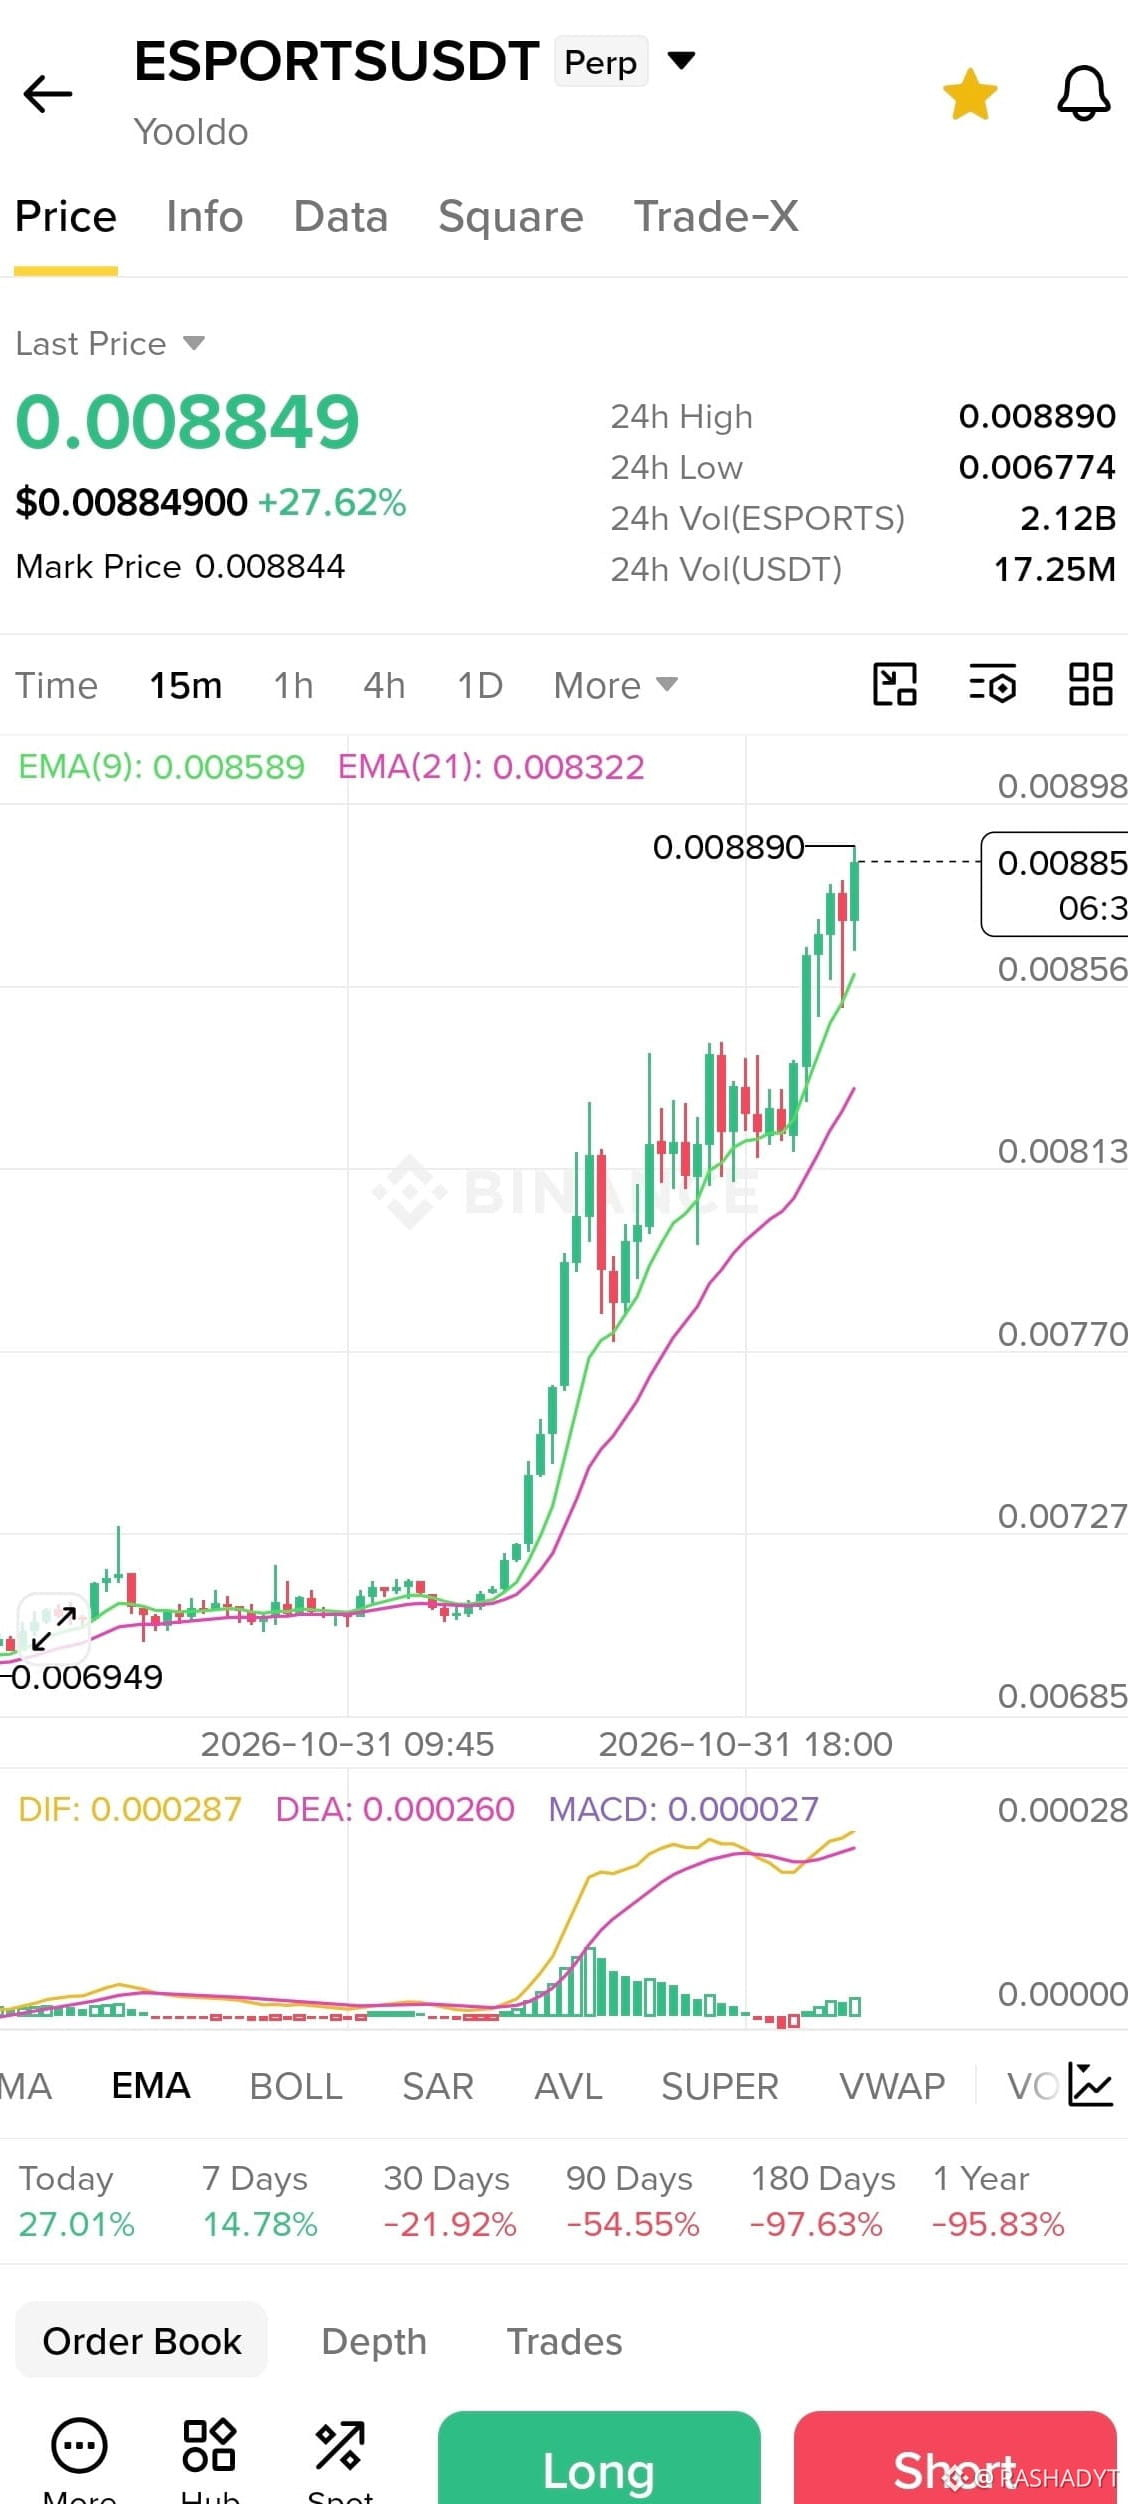
🚀 ESPORTS USDT – MASSIVE BULLISH MOMENTUM! IS ANOTHER BREAKOUT COMING?
📊 MARKET OVERVIEW
🟢 Current Price: $0.008849
📈 24H Change: +27.62%
🔥 24H High: $0.008890
📉 24H Low: $0.006774
💎 24H Volume: 2.12B ESPORTS
💰 USDT Volume: $17.25M
━━━━━━━━━━━━━━
📈 TECHNICAL ANALYSIS
ESPORTS USDT is showing strong bullish momentum on the 15-minute timeframe. Price is trading above both EMA indicators, suggesting buyers are currently in control.
- EMA(9): $0.008589
- EMA(21): $0.008322
- MACD: Positive
- DIF: 0.000287
- DEA: 0.000260
🎯 KEY PRICE LEVELS
🟢 RESISTANCE
- R1: $0.008890
- R2: $0.009000
- R3: $0.009200
🔴 SUPPORT
- S1: $0.008560
- S2: $0.008322
- S3: $0.008133
🐂 BULLISH SCENARIO
A confirmed breakout above $0.008890 with strong volume could create an opportunity for further upside.
🐻 BEARISH SCENARIO
If price fails to hold the $0.008560 support, a short-term pullback toward the EMA support zone may occur.
🔥 WHAT I'M WATCHING
- Resistance breakout confirmation
- EMA(9) and EMA(21) support
- Increasing trading volume
- MACD momentum continuation
💡 FINAL OUTLOOK
ESPORTSUSDT is showing impressive short-term strength after its recent rally. However, chasing a sharp price move can be risky. Waiting for confirmation may be a more disciplined approach.
💬 Can ESPORTS USDT break $0.008890 and reach $0.009200?
Bullish or Bearish? Share your thoughts! 👇
⚠️ Educational analysis only. Not financial advice. Always DYOR and manage risk.
#ESPORTS #ESPORTSUSDT #Binance #CryptoAnalysis #Altcoins #BullishMomentum #TechnicalAnalysis #CryptoMarket
🚀 ESPORTS USDT – MASSIVE BULLISH MOMENTUM! IS ANOTHER BREAKOUT COMING?
📊 MARKET OVERVIEW
🟢 Current Price: $0.008849
📈 24H Change: +27.62%
🔥 24H High: $0.008890
📉 24H Low: $0.006774
💎 24H Volume: 2.12B ESPORTS
💰 USDT Volume: $17.25M
━━━━━━━━━━━━━━
📈 TECHNICAL ANALYSIS
ESPORTS USDT is showing strong bullish momentum on the 15-minute timeframe. Price is trading above both EMA indicators, suggesting buyers are currently in control.
- EMA(9): $0.008589
- EMA(21): $0.008322
- MACD: Positive
- DIF: 0.000287
- DEA: 0.000260
🎯 KEY PRICE LEVELS
🟢 RESISTANCE
- R1: $0.008890
- R2: $0.009000
- R3: $0.009200
🔴 SUPPORT
- S1: $0.008560
- S2: $0.008322
- S3: $0.008133
🐂 BULLISH SCENARIO
A confirmed breakout above $0.008890 with strong volume could create an opportunity for further upside.
🐻 BEARISH SCENARIO
If price fails to hold the $0.008560 support, a short-term pullback toward the EMA support zone may occur.
🔥 WHAT I'M WATCHING
- Resistance breakout confirmation
- EMA(9) and EMA(21) support
- Increasing trading volume
- MACD momentum continuation
💡 FINAL OUTLOOK
ESPORTSUSDT is showing impressive short-term strength after its recent rally. However, chasing a sharp price move can be risky. Waiting for confirmation may be a more disciplined approach.
💬 Can ESPORTS USDT break $0.008890 and reach $0.009200?
Bullish or Bearish? Share your thoughts! 👇
⚠️ Educational analysis only. Not financial advice. Always DYOR and manage risk.
#ESPORTS #ESPORTSUSDT #Binance #CryptoAnalysis #Altcoins #BullishMomentum #TechnicalAnalysis #CryptoMarket
📊 MARKET OVERVIEW
🟢 Current Price: $0.008849
📈 24H Change: +27.62%
🔥 24H High: $0.008890
📉 24H Low: $0.006774
💎 24H Volume: 2.12B ESPORTS
💰 USDT Volume: $17.25M
━━━━━━━━━━━━━━
📈 TECHNICAL ANALYSIS
ESPORTS USDT is showing strong bullish momentum on the 15-minute timeframe. Price is trading above both EMA indicators, suggesting buyers are currently in control.
- EMA(9): $0.008589
- EMA(21): $0.008322
- MACD: Positive
- DIF: 0.000287
- DEA: 0.000260
🎯 KEY PRICE LEVELS
🟢 RESISTANCE
- R1: $0.008890
- R2: $0.009000
- R3: $0.009200
🔴 SUPPORT
- S1: $0.008560
- S2: $0.008322
- S3: $0.008133
🐂 BULLISH SCENARIO
A confirmed breakout above $0.008890 with strong volume could create an opportunity for further upside.
🐻 BEARISH SCENARIO
If price fails to hold the $0.008560 support, a short-term pullback toward the EMA support zone may occur.
🔥 WHAT I'M WATCHING
- Resistance breakout confirmation
- EMA(9) and EMA(21) support
- Increasing trading volume
- MACD momentum continuation
💡 FINAL OUTLOOK
ESPORTSUSDT is showing impressive short-term strength after its recent rally. However, chasing a sharp price move can be risky. Waiting for confirmation may be a more disciplined approach.
💬 Can ESPORTS USDT break $0.008890 and reach $0.009200?
Bullish or Bearish? Share your thoughts! 👇
⚠️ Educational analysis only. Not financial advice. Always DYOR and manage risk.
#ESPORTS #ESPORTSUSDT #Binance #CryptoAnalysis #Altcoins #BullishMomentum #TechnicalAnalysis #CryptoMarket
1
47
·
--
Төмен (кемімелі)
🐸 $PEPE – BULLISH MOMENTUM IS BACK? 🚀
The Pepe community continues to attract attention as traders watch for the next potential market move.
📊 Key Market Insights:
- 🟢 Bullish momentum could create new opportunities.
- 📈 Watch for increasing trading volume.
- 🎯 A strong breakout needs confirmation.
- ⚠️ Sudden reversals and volatility remain possible.
🔥 What's Next for $PEPE?
If buyers maintain momentum and volume increases, PEPE could attempt another upward move. However, traders should watch key support and resistance levels before making decisions.
💡 Trade Smart. Stay Patient. Manage Risk.
🐸 Are you still bullish on $PEPE
{spot}(PEPEUSDT)
PE?
#PEPE #PepeCoin #Binance #CryptoMarket #Memecoin #Altcoins #CryptoTrading #BullishMomentum
🐸 $PEPE – BULLISH MOMENTUM IS BACK? 🚀
The Pepe community continues to attract attention as traders watch for the next potential market move.
📊 Key Market Insights:
- 🟢 Bullish momentum could create new opportunities.
- 📈 Watch for increasing trading volume.
- 🎯 A strong breakout needs confirmation.
- ⚠️ Sudden reversals and volatility remain possible.
🔥 What's Next for $PEPE ?
If buyers maintain momentum and volume increases, PEPE could attempt another upward move. However, traders should watch key support and resistance levels before making decisions.
💡 Trade Smart. Stay Patient. Manage Risk.
🐸 Are you still bullish on $PEPE
PE?
#PEPE #PepeCoin #Binance #CryptoMarket #Memecoin #Altcoins #CryptoTrading #BullishMomentum
The Pepe community continues to attract attention as traders watch for the next potential market move.
📊 Key Market Insights:
- 🟢 Bullish momentum could create new opportunities.
- 📈 Watch for increasing trading volume.
- 🎯 A strong breakout needs confirmation.
- ⚠️ Sudden reversals and volatility remain possible.
🔥 What's Next for $PEPE ?
If buyers maintain momentum and volume increases, PEPE could attempt another upward move. However, traders should watch key support and resistance levels before making decisions.
💡 Trade Smart. Stay Patient. Manage Risk.
🐸 Are you still bullish on $PEPE
PE?
#PEPE #PepeCoin #Binance #CryptoMarket #Memecoin #Altcoins #CryptoTrading #BullishMomentum

1
2
52
·
--
Жоғары (өспелі)
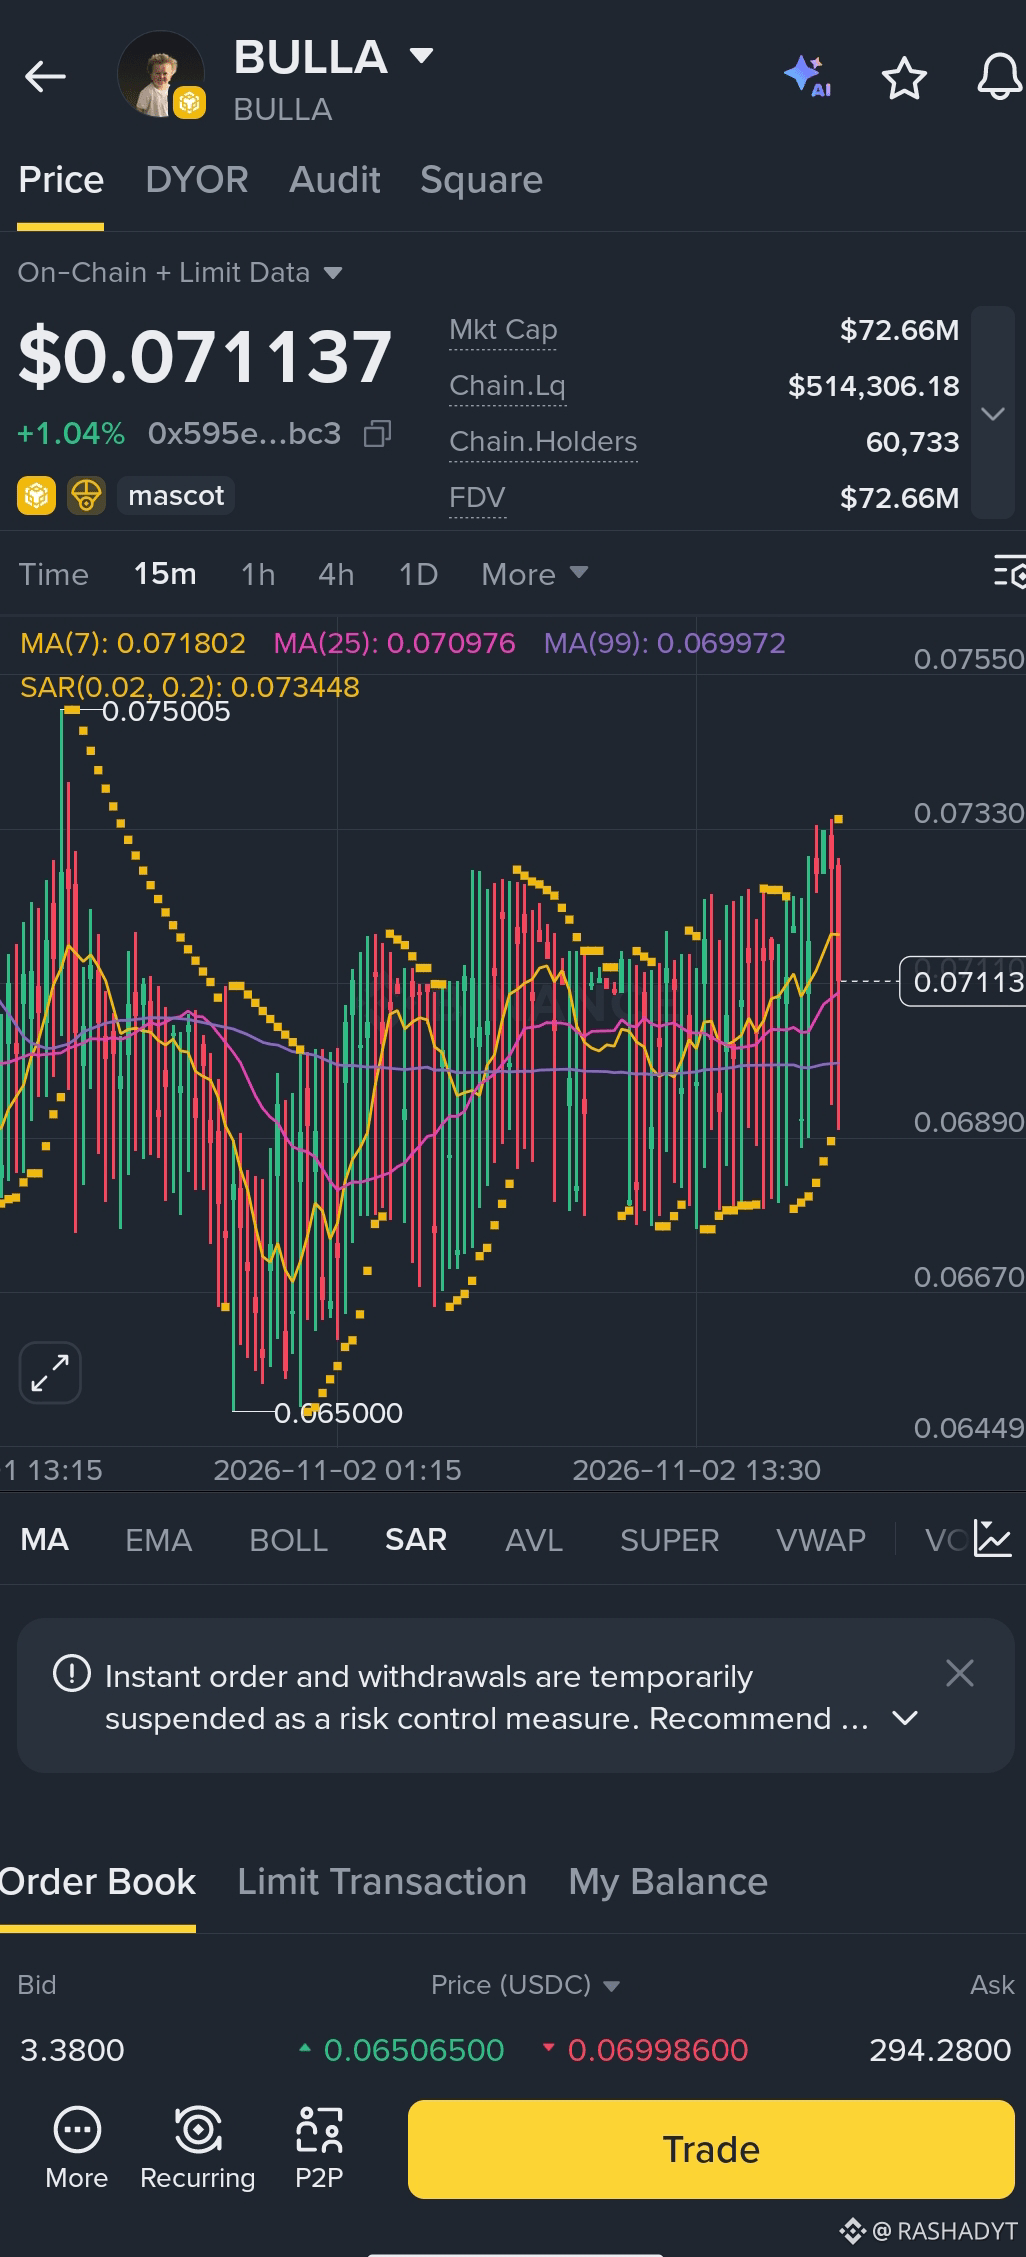
🚨 $BULLA LA UPDATE: BIG BREAKOUT COMING OR BEARISH REVERSAL? 🐂
$BULLA is currently trading at $0.071137, showing a 1.04% gain.
📊 15M Technical Analysis
- MA(7): $0.071802
- MA(25): $0.070976
- MA(99): $0.069972
- SAR: $0.073448
🔥 Key Price Levels
🟢 Support 1: $0.070000
🟢 Support 2: $0.068902
🟢 Major Support: $0.065000
🔴 Resistance 1: $0.073448
🔴 Resistance 2: $0.075005
📈 Market Outlook
BULLA is moving within a volatile range. The price remains above MA(25) and MA(99), but below MA(7).
The SAR indicator is also above the current price, suggesting short-term selling pressure.
A confirmed breakout above $0.07345 could strengthen bullish momentum.
However, losing $0.07000 may bring another support test.
👀 WHAT TO WATCH NEXT
✅ $0.07345 breakout
✅ $0.07500 resistance
✅ $0.07000 support
✅ Volume confirmation
✅ 15M candle closing strength
💬 YOUR OPINION?
Will $BULLA reach $0.07500, or are we heading toward another pullback?
Let's discuss! 🚀
#BULLA
{future}(BULLAUSDT)
#BinanceSquare #CryptoAnalysis #Altcoins #TechnicalAnalysis #CryptoMarket
🚨 $BULLA LA UPDATE: BIG BREAKOUT COMING OR BEARISH REVERSAL? 🐂
$BULLA is currently trading at $0.071137, showing a 1.04% gain.
📊 15M Technical Analysis
- MA(7): $0.071802
- MA(25): $0.070976
- MA(99): $0.069972
- SAR: $0.073448
🔥 Key Price Levels
🟢 Support 1: $0.070000
🟢 Support 2: $0.068902
🟢 Major Support: $0.065000
🔴 Resistance 1: $0.073448
🔴 Resistance 2: $0.075005
📈 Market Outlook
BULLA is moving within a volatile range. The price remains above MA(25) and MA(99), but below MA(7).
The SAR indicator is also above the current price, suggesting short-term selling pressure.
A confirmed breakout above $0.07345 could strengthen bullish momentum.
However, losing $0.07000 may bring another support test.
👀 WHAT TO WATCH NEXT
✅ $0.07345 breakout
✅ $0.07500 resistance
✅ $0.07000 support
✅ Volume confirmation
✅ 15M candle closing strength
💬 YOUR OPINION?
Will $BULLA reach $0.07500, or are we heading toward another pullback?
Let's discuss! 🚀
#BULLA
#BinanceSquare #CryptoAnalysis #Altcoins #TechnicalAnalysis #CryptoMarket
$BULLA is currently trading at $0.071137, showing a 1.04% gain.
📊 15M Technical Analysis
- MA(7): $0.071802
- MA(25): $0.070976
- MA(99): $0.069972
- SAR: $0.073448
🔥 Key Price Levels
🟢 Support 1: $0.070000
🟢 Support 2: $0.068902
🟢 Major Support: $0.065000
🔴 Resistance 1: $0.073448
🔴 Resistance 2: $0.075005
📈 Market Outlook
BULLA is moving within a volatile range. The price remains above MA(25) and MA(99), but below MA(7).
The SAR indicator is also above the current price, suggesting short-term selling pressure.
A confirmed breakout above $0.07345 could strengthen bullish momentum.
However, losing $0.07000 may bring another support test.
👀 WHAT TO WATCH NEXT
✅ $0.07345 breakout
✅ $0.07500 resistance
✅ $0.07000 support
✅ Volume confirmation
✅ 15M candle closing strength
💬 YOUR OPINION?
Will $BULLA reach $0.07500, or are we heading toward another pullback?
Let's discuss! 🚀
#BULLA
#BinanceSquare #CryptoAnalysis #Altcoins #TechnicalAnalysis #CryptoMarket
1
1
71
·
--
Төмен (кемімелі)
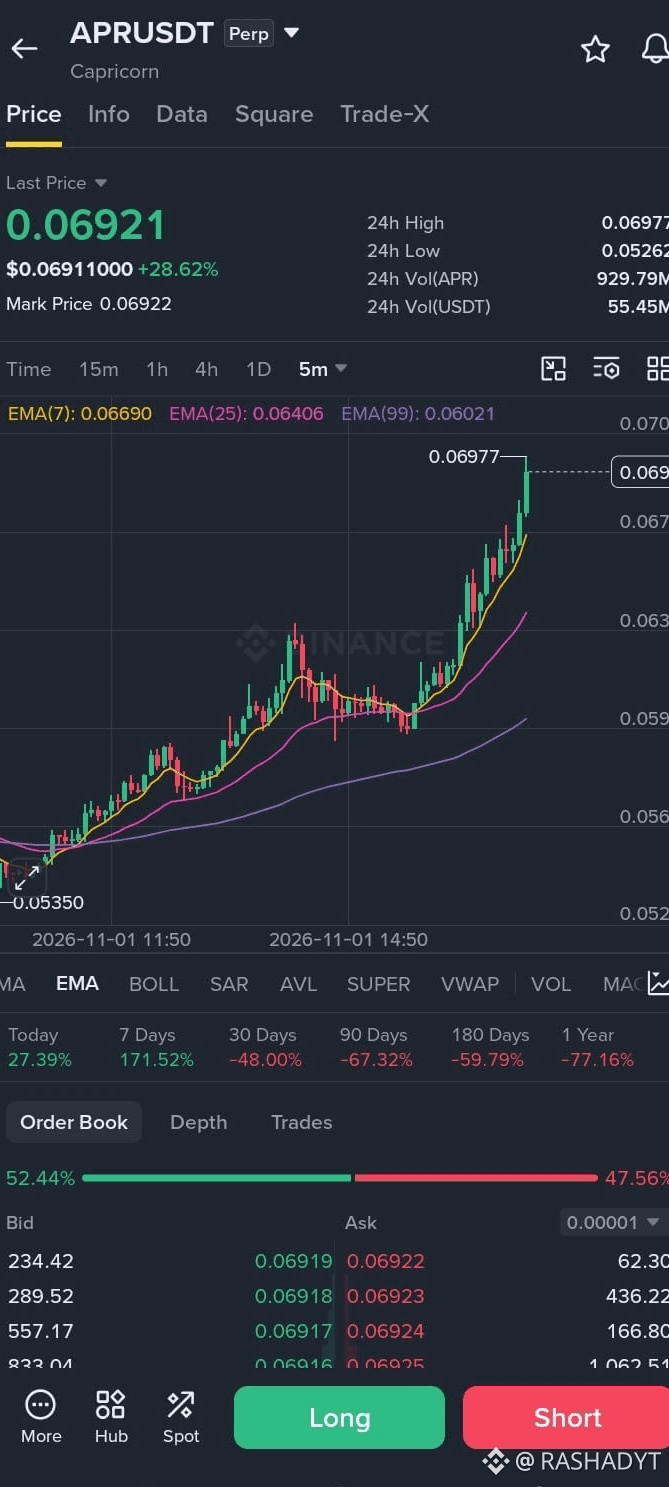
🚀 APR MARKET UPDATE: BULLS ARE TAKING CONTROL! 🐂
$APR (Capricorn) is showing strong bullish momentum, currently trading around $0.06921, with an impressive 24-hour gain of 28.62%.
📊 Technical Analysis – 5M Chart
🔹 Current Price: $0.06921
🔹 24H High: $0.06977
🔹 24H Low: $0.05262
🔹 24H Volume: 929.79M APR
🔹 Trading Volume (USDT): $55.45M
📈 EMA Indicators:
- EMA(7): $0.06690
- EMA(25): $0.06406
- EMA(99): $0.06021
🔥 Important Price Levels:
🟢 Immediate Support: $0.06700
🟢 Secondary Support: $0.06400
🔴 Immediate Resistance: $0.06977
🔴 Next Resistance: $0.07059
🚀 Market Outlook:
APR is showing strong upward momentum, with price trading above all three EMAs.
The EMA alignment suggests a bullish short-term trend. However, after such a strong rally, a temporary pullback or consolidation is also possible.
A confirmed breakout above $0.06977 could support further upside momentum.
👀 What I'm Watching Next:
✅ Breakout above $0.06977
✅ Sustained volume
✅ EMA(7) support
✅ Healthy price consolidation
✅ Confirmation on higher timeframes
💬 COMMUNITY QUESTION:
Can $APR break above $0.07000 and continue its bullish run?
Or are we going to see a short-term correction?
Share your thoughts below! 🔥
#APR
{future}(APRUSDT)
#Capricorn #BinanceSquare #CryptoAnalysis #BullishMomentum #Altcoins #TechnicalAnalysis
🚀 APR MARKET UPDATE: BULLS ARE TAKING CONTROL! 🐂
$APR (Capricorn) is showing strong bullish momentum, currently trading around $0.06921, with an impressive 24-hour gain of 28.62%.
📊 Technical Analysis – 5M Chart
🔹 Current Price: $0.06921
🔹 24H High: $0.06977
🔹 24H Low: $0.05262
🔹 24H Volume: 929.79M APR
🔹 Trading Volume (USDT): $55.45M
📈 EMA Indicators:
- EMA(7): $0.06690
- EMA(25): $0.06406
- EMA(99): $0.06021
🔥 Important Price Levels:
🟢 Immediate Support: $0.06700
🟢 Secondary Support: $0.06400
🔴 Immediate Resistance: $0.06977
🔴 Next Resistance: $0.07059
🚀 Market Outlook:
APR is showing strong upward momentum, with price trading above all three EMAs.
The EMA alignment suggests a bullish short-term trend. However, after such a strong rally, a temporary pullback or consolidation is also possible.
A confirmed breakout above $0.06977 could support further upside momentum.
👀 What I'm Watching Next:
✅ Breakout above $0.06977
✅ Sustained volume
✅ EMA(7) support
✅ Healthy price consolidation
✅ Confirmation on higher timeframes
💬 COMMUNITY QUESTION:
Can $APR break above $0.07000 and continue its bullish run?
Or are we going to see a short-term correction?
Share your thoughts below! 🔥
#APR
#Capricorn #BinanceSquare #CryptoAnalysis #BullishMomentum #Altcoins #TechnicalAnalysis
$APR (Capricorn) is showing strong bullish momentum, currently trading around $0.06921, with an impressive 24-hour gain of 28.62%.
📊 Technical Analysis – 5M Chart
🔹 Current Price: $0.06921
🔹 24H High: $0.06977
🔹 24H Low: $0.05262
🔹 24H Volume: 929.79M APR
🔹 Trading Volume (USDT): $55.45M
📈 EMA Indicators:
- EMA(7): $0.06690
- EMA(25): $0.06406
- EMA(99): $0.06021
🔥 Important Price Levels:
🟢 Immediate Support: $0.06700
🟢 Secondary Support: $0.06400
🔴 Immediate Resistance: $0.06977
🔴 Next Resistance: $0.07059
🚀 Market Outlook:
APR is showing strong upward momentum, with price trading above all three EMAs.
The EMA alignment suggests a bullish short-term trend. However, after such a strong rally, a temporary pullback or consolidation is also possible.
A confirmed breakout above $0.06977 could support further upside momentum.
👀 What I'm Watching Next:
✅ Breakout above $0.06977
✅ Sustained volume
✅ EMA(7) support
✅ Healthy price consolidation
✅ Confirmation on higher timeframes
💬 COMMUNITY QUESTION:
Can $APR break above $0.07000 and continue its bullish run?
Or are we going to see a short-term correction?
Share your thoughts below! 🔥
#APR
#Capricorn #BinanceSquare #CryptoAnalysis #BullishMomentum #Altcoins #TechnicalAnalysis
1
1
396
·
--
Төмен (кемімелі)
{future}(LABUSDT)
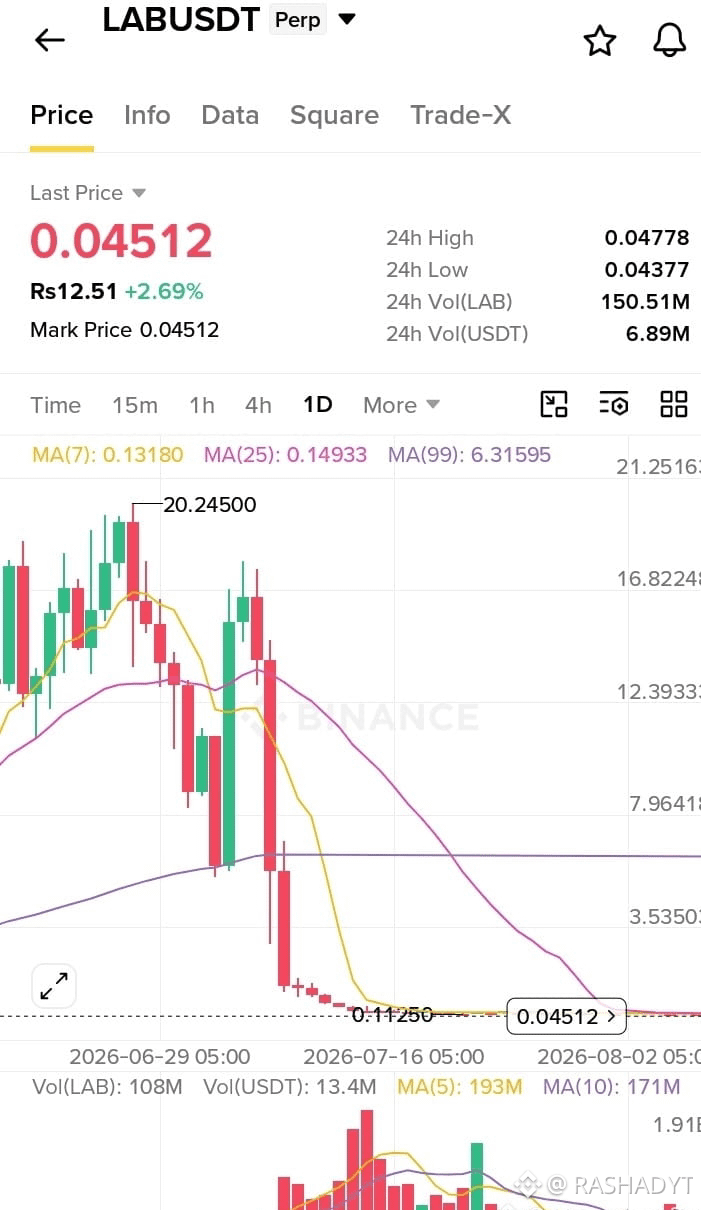
🚨 $LAB B MARKET UPDATE: Is LAB Showing Signs of Recovery?
$LAB is currently trading around $0.04512, showing a 24-hour gain of approximately 2.69%.
📊 Market Overview (1D Chart)
🔹 Current Price: $0.04512
🔹 24H Change: +2.69%
🔹 24H High: $0.04778
🔹 24H Low: $0.04377
🔹 24H Volume (LAB): 150.51M
🔹 24H Volume (USDT): $6.89M
📉 Technical Analysis
LAB has experienced a significant long-term decline from its previous highs.
The latest price movement shows a small recovery, but the broader chart structure remains weak.
Moving Average Data:
- MA(7): 0.13180
- MA(25): 0.14933
- MA(99): 6.31595
🔥 Important Levels to Watch
🟢 Immediate Support: $0.04377
🔴 Immediate Resistance: $0.04778
A breakout above the 24H high could indicate improving short-term momentum.
However, losing the 24H low may increase selling pressure.
👀 What I'm Watching Next:
✅ Daily candle confirmation
✅ Volume expansion
✅ Breakout above $0.04778
✅ Buyers defending $0.04377
✅ Signs of a stronger trend reversal
💬 COMMUNITY QUESTION
Is $LAB preparing for a recovery, or is this just a temporary bounce?
Share your analysis below! 🚀
#LAB ##LABUSDT #BinanceSquare #CryptoAnalysis #Altcoins #CryptoMarket #TechnicalAnalysis
🚨 $LAB B MARKET UPDATE: Is LAB Showing Signs of Recovery?
$LAB is currently trading around $0.04512, showing a 24-hour gain of approximately 2.69%.
📊 Market Overview (1D Chart)
🔹 Current Price: $0.04512
🔹 24H Change: +2.69%
🔹 24H High: $0.04778
🔹 24H Low: $0.04377
🔹 24H Volume (LAB): 150.51M
🔹 24H Volume (USDT): $6.89M
📉 Technical Analysis
LAB has experienced a significant long-term decline from its previous highs.
The latest price movement shows a small recovery, but the broader chart structure remains weak.
Moving Average Data:
- MA(7): 0.13180
- MA(25): 0.14933
- MA(99): 6.31595
🔥 Important Levels to Watch
🟢 Immediate Support: $0.04377
🔴 Immediate Resistance: $0.04778
A breakout above the 24H high could indicate improving short-term momentum.
However, losing the 24H low may increase selling pressure.
👀 What I'm Watching Next:
✅ Daily candle confirmation
✅ Volume expansion
✅ Breakout above $0.04778
✅ Buyers defending $0.04377
✅ Signs of a stronger trend reversal
💬 COMMUNITY QUESTION
Is $LAB preparing for a recovery, or is this just a temporary bounce?
Share your analysis below! 🚀
#LAB ##LABUSDT #BinanceSquare #CryptoAnalysis #Altcoins #CryptoMarket #TechnicalAnalysis
$LAB is currently trading around $0.04512, showing a 24-hour gain of approximately 2.69%.
📊 Market Overview (1D Chart)
🔹 Current Price: $0.04512
🔹 24H Change: +2.69%
🔹 24H High: $0.04778
🔹 24H Low: $0.04377
🔹 24H Volume (LAB): 150.51M
🔹 24H Volume (USDT): $6.89M
📉 Technical Analysis
LAB has experienced a significant long-term decline from its previous highs.
The latest price movement shows a small recovery, but the broader chart structure remains weak.
Moving Average Data:
- MA(7): 0.13180
- MA(25): 0.14933
- MA(99): 6.31595
🔥 Important Levels to Watch
🟢 Immediate Support: $0.04377
🔴 Immediate Resistance: $0.04778
A breakout above the 24H high could indicate improving short-term momentum.
However, losing the 24H low may increase selling pressure.
👀 What I'm Watching Next:
✅ Daily candle confirmation
✅ Volume expansion
✅ Breakout above $0.04778
✅ Buyers defending $0.04377
✅ Signs of a stronger trend reversal
💬 COMMUNITY QUESTION
Is $LAB preparing for a recovery, or is this just a temporary bounce?
Share your analysis below! 🚀
#LAB ##LABUSDT #BinanceSquare #CryptoAnalysis #Altcoins #CryptoMarket #TechnicalAnalysis
1
1
500
·
--
Төмен (кемімелі)
{spot}(PEPEUSDT)
if$PEPE PE ever reaches $1, I'll be a billionaire. 🐸
What if $PEPE changes everything? 🚀
#CryptoDreams #100xGem
if$PEPE PE ever reaches $1, I'll be a billionaire. 🐸
What if $PEPE changes everything? 🚀
#CryptoDreams #100xGem
What if $PEPE changes everything? 🚀
#CryptoDreams #100xGem

4
60
·
--
Төмен (кемімелі)
{future}(BULLAUSDT)
🚀 🐂 $BULLA LLA MARKET UPDATE: BULLISH BREAKOUT OR BEARISH REVERSAL?
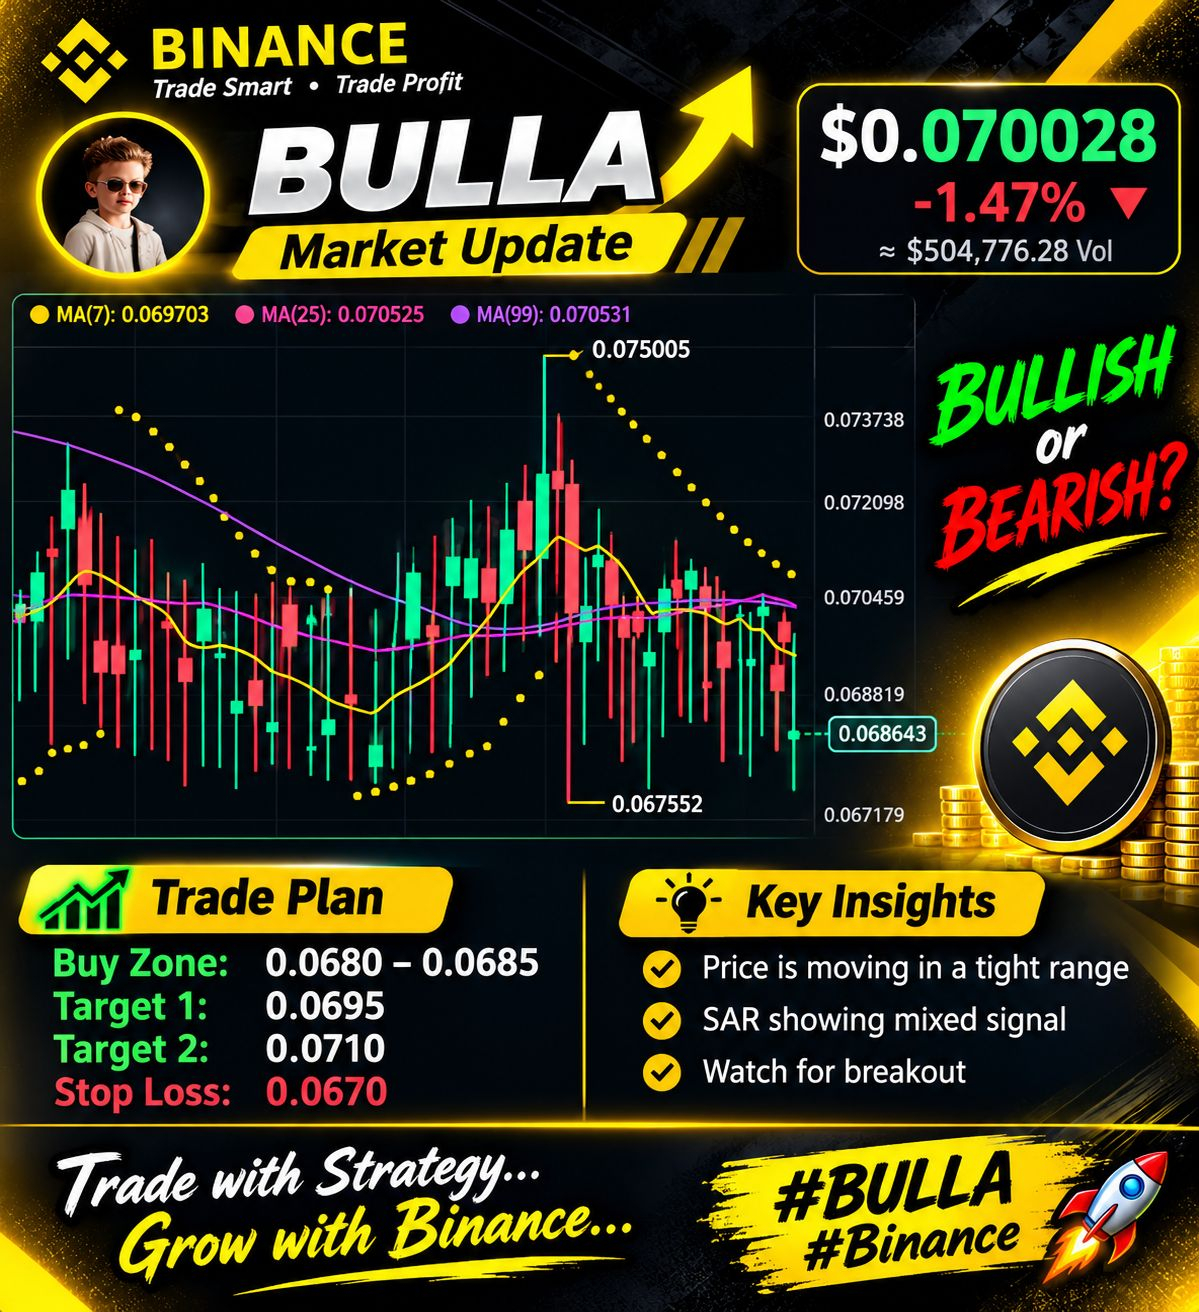
$BULLA is showing mixed signals as the price continues moving within a tight range.
📊 Technical Analysis:
- MA(7): $0.069703
- MA(25): $0.070525
- MA(99): $0.070531
- Current Price (headline): $0.070028
- Daily Change: -1.47%
🔥 Key Price Levels:
🟢 Support Zone: $0.0680 – $0.0685
🔴 Resistance Zone: $0.0705 – $0.0710
🎯 Potential Upside Target 1: $0.0695
🎯 Potential Upside Target 2: $0.0710
⚠️ Important Support: $0.0670
📈 Market Outlook:
BULLA is currently showing consolidation with mixed technical signals.
The price needs to reclaim the short-term moving averages to strengthen bullish momentum.
A confirmed breakout above $0.0710 could attract additional buying interest, while a breakdown below $0.0670 may increase bearish pressure.
👀 What I'm Watching Next:
✅ Price reaction around $0.0680
✅ Breakout confirmation above $0.0710
✅ Trading volume expansion
✅ Overall market sentiment
💬 COMMUNITY QUESTION:
Are you expecting a bullish breakout or another bearish move for $BULLA?
Share your thoughts and technical analysis below! 🚀
#BULLA2026 #BinanceSquare #CryptoAnalysis #Altcoins #TechnicalAnalysis #CryptoTrading #MarketUpdate
🚀 🐂 $BULLA LLA MARKET UPDATE: BULLISH BREAKOUT OR BEARISH REVERSAL?
$BULLA is showing mixed signals as the price continues moving within a tight range.
📊 Technical Analysis:
- MA(7): $0.069703
- MA(25): $0.070525
- MA(99): $0.070531
- Current Price (headline): $0.070028
- Daily Change: -1.47%
🔥 Key Price Levels:
🟢 Support Zone: $0.0680 – $0.0685
🔴 Resistance Zone: $0.0705 – $0.0710
🎯 Potential Upside Target 1: $0.0695
🎯 Potential Upside Target 2: $0.0710
⚠️ Important Support: $0.0670
📈 Market Outlook:
BULLA is currently showing consolidation with mixed technical signals.
The price needs to reclaim the short-term moving averages to strengthen bullish momentum.
A confirmed breakout above $0.0710 could attract additional buying interest, while a breakdown below $0.0670 may increase bearish pressure.
👀 What I'm Watching Next:
✅ Price reaction around $0.0680
✅ Breakout confirmation above $0.0710
✅ Trading volume expansion
✅ Overall market sentiment
💬 COMMUNITY QUESTION:
Are you expecting a bullish breakout or another bearish move for $BULLA ?
Share your thoughts and technical analysis below! 🚀
#BULLA2026 #BinanceSquare #CryptoAnalysis #Altcoins #TechnicalAnalysis #CryptoTrading #MarketUpdate
$BULLA is showing mixed signals as the price continues moving within a tight range.
📊 Technical Analysis:
- MA(7): $0.069703
- MA(25): $0.070525
- MA(99): $0.070531
- Current Price (headline): $0.070028
- Daily Change: -1.47%
🔥 Key Price Levels:
🟢 Support Zone: $0.0680 – $0.0685
🔴 Resistance Zone: $0.0705 – $0.0710
🎯 Potential Upside Target 1: $0.0695
🎯 Potential Upside Target 2: $0.0710
⚠️ Important Support: $0.0670
📈 Market Outlook:
BULLA is currently showing consolidation with mixed technical signals.
The price needs to reclaim the short-term moving averages to strengthen bullish momentum.
A confirmed breakout above $0.0710 could attract additional buying interest, while a breakdown below $0.0670 may increase bearish pressure.
👀 What I'm Watching Next:
✅ Price reaction around $0.0680
✅ Breakout confirmation above $0.0710
✅ Trading volume expansion
✅ Overall market sentiment
💬 COMMUNITY QUESTION:
Are you expecting a bullish breakout or another bearish move for $BULLA ?
Share your thoughts and technical analysis below! 🚀
#BULLA2026 #BinanceSquare #CryptoAnalysis #Altcoins #TechnicalAnalysis #CryptoTrading #MarketUpdate
1
1
169
·
--
Төмен (кемімелі)
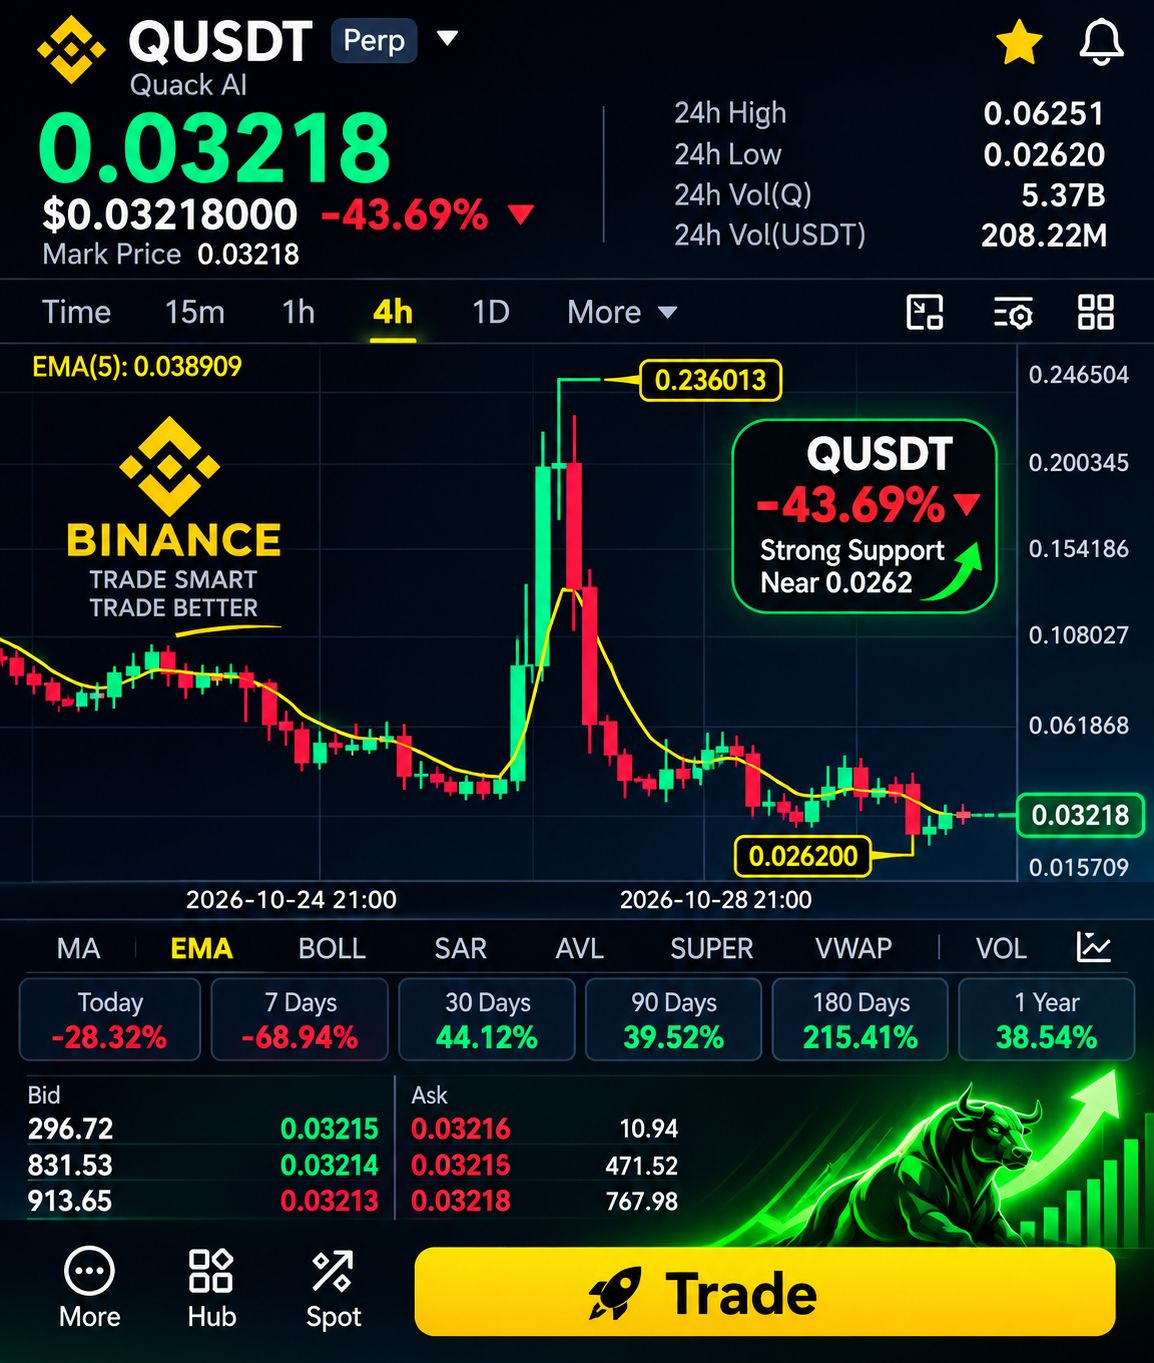
🚨 $Q USDT MARKET ALERT: Can Quack AI Recover After a Massive Drop?
$Q USDT is currently trading around $0.03218, down approximately 43.69%.
📊 4H Technical Analysis
- Current Price: $0.03218
- 24H High: $0.06251
- 24H Low: $0.02620
- EMA(5): $0.038909
- 24H Trading Volume: $208.22M
🔑 Important Price Levels
🟢 Major Support: $0.02620
🔴 Resistance 1: $0.03890
🔴 Resistance 2: $0.05000
🔴 Major Resistance: $0.06186
📉 Market Outlook
QUSDT has experienced significant selling pressure following its previous price spike.
The current price remains below the 4H EMA(5), indicating that bearish momentum is still present.
A recovery above $0.0389 could be an early sign of improving momentum. However, losing the $0.0262 support could expose the price to further downside.
👀 What to Watch Next:
✅ Reaction around $0.0262 support
✅ Breakout above $0.0389
✅ Increasing buying volume
✅ Confirmation on the 4H timeframe
💬 Community Question:
Can $QUSDT recover from this sharp correction, or will sellers push it lower?
Share your thoughts below! 🚀
#Q
{future}(QUSDT)
USDT #QuackAI #BinanceSquare #CryptoAnalysis #Altcoins #TechnicalAnalysis #CryptoMarket
🚨 $Q USDT MARKET ALERT: Can Quack AI Recover After a Massive Drop?
$Q USDT is currently trading around $0.03218, down approximately 43.69%.
📊 4H Technical Analysis
- Current Price: $0.03218
- 24H High: $0.06251
- 24H Low: $0.02620
- EMA(5): $0.038909
- 24H Trading Volume: $208.22M
🔑 Important Price Levels
🟢 Major Support: $0.02620
🔴 Resistance 1: $0.03890
🔴 Resistance 2: $0.05000
🔴 Major Resistance: $0.06186
📉 Market Outlook
QUSDT has experienced significant selling pressure following its previous price spike.
The current price remains below the 4H EMA(5), indicating that bearish momentum is still present.
A recovery above $0.0389 could be an early sign of improving momentum. However, losing the $0.0262 support could expose the price to further downside.
👀 What to Watch Next:
✅ Reaction around $0.0262 support
✅ Breakout above $0.0389
✅ Increasing buying volume
✅ Confirmation on the 4H timeframe
💬 Community Question:
Can $QUSDT recover from this sharp correction, or will sellers push it lower?
Share your thoughts below! 🚀
#Q
USDT #QuackAI #BinanceSquare #CryptoAnalysis #Altcoins #TechnicalAnalysis #CryptoMarket
$Q USDT is currently trading around $0.03218, down approximately 43.69%.
📊 4H Technical Analysis
- Current Price: $0.03218
- 24H High: $0.06251
- 24H Low: $0.02620
- EMA(5): $0.038909
- 24H Trading Volume: $208.22M
🔑 Important Price Levels
🟢 Major Support: $0.02620
🔴 Resistance 1: $0.03890
🔴 Resistance 2: $0.05000
🔴 Major Resistance: $0.06186
📉 Market Outlook
QUSDT has experienced significant selling pressure following its previous price spike.
The current price remains below the 4H EMA(5), indicating that bearish momentum is still present.
A recovery above $0.0389 could be an early sign of improving momentum. However, losing the $0.0262 support could expose the price to further downside.
👀 What to Watch Next:
✅ Reaction around $0.0262 support
✅ Breakout above $0.0389
✅ Increasing buying volume
✅ Confirmation on the 4H timeframe
💬 Community Question:
Can $QUSDT recover from this sharp correction, or will sellers push it lower?
Share your thoughts below! 🚀
#Q
USDT #QuackAI #BinanceSquare #CryptoAnalysis #Altcoins #TechnicalAnalysis #CryptoMarket
2
556
·
--
Жоғары (өспелі)
⚠️ $AIN
{future}(AINUSDT)
N WARNING: Is This a Short Trap or Market Manipulation?
Crypto traders, stay alert! 🚨
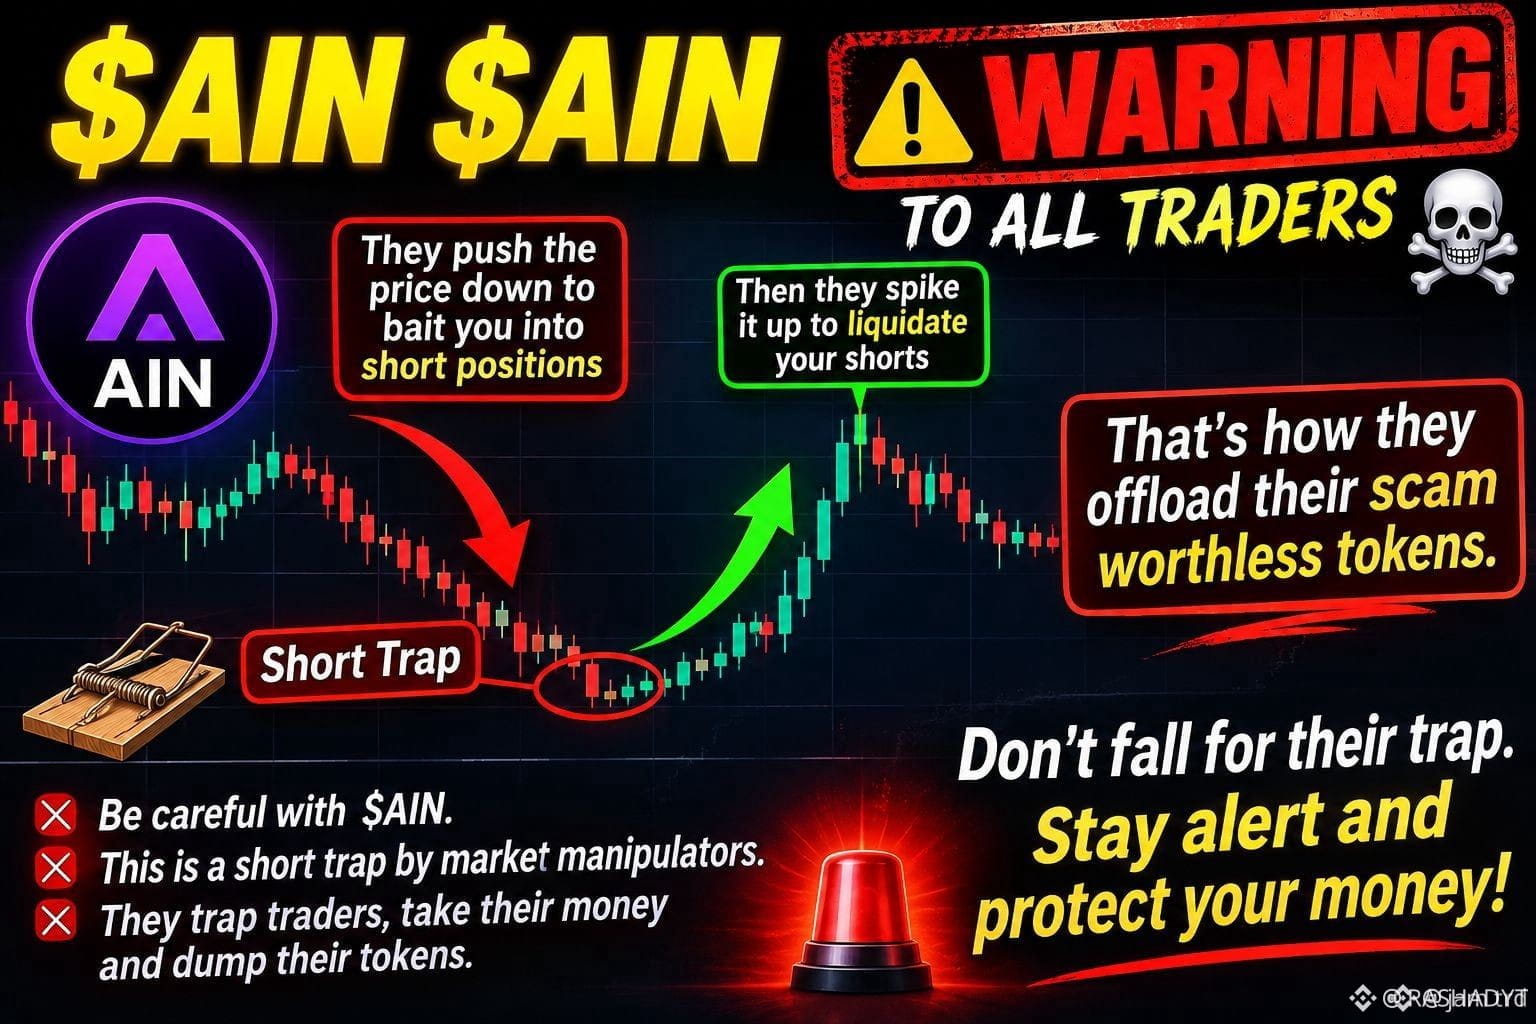
The $AIN chart highlights a potential volatility trap where a sudden price drop is followed by a sharp upward recovery.
📉 What Traders Should Watch:
🔴 Sudden price drops can create fear and attract short sellers.
🟢 Sharp rebounds can trigger short liquidations.
⚠️ High volatility can expose traders to unexpected losses.
📊 My Market Observation:
Don't assume every breakdown is a confirmed bearish trend. Watch trading volume, liquidity, price action, and confirmation before making decisions.
🔥 Important Reminders:
- Avoid emotional trading.
- Be careful with high-leverage positions.
- Always manage risk.
- Never trust unverified manipulation claims.
- Do your own research before trading.
💬 Discussion:
Do you think $AIN is showing a potential short trap, or is this simply normal market volatility?
Share your thoughts below! 👇
#AIN #CryptoWarning #BinanceSquare #CryptoAnalysis #MarketVolatility #TradingRisk #Altcoins
⚠️ $AIN
N WARNING: Is This a Short Trap or Market Manipulation?
Crypto traders, stay alert! 🚨
The $AIN chart highlights a potential volatility trap where a sudden price drop is followed by a sharp upward recovery.
📉 What Traders Should Watch:
🔴 Sudden price drops can create fear and attract short sellers.
🟢 Sharp rebounds can trigger short liquidations.
⚠️ High volatility can expose traders to unexpected losses.
📊 My Market Observation:
Don't assume every breakdown is a confirmed bearish trend. Watch trading volume, liquidity, price action, and confirmation before making decisions.
🔥 Important Reminders:
- Avoid emotional trading.
- Be careful with high-leverage positions.
- Always manage risk.
- Never trust unverified manipulation claims.
- Do your own research before trading.
💬 Discussion:
Do you think $AIN is showing a potential short trap, or is this simply normal market volatility?
Share your thoughts below! 👇
#AIN #CryptoWarning #BinanceSquare #CryptoAnalysis #MarketVolatility #TradingRisk #Altcoins
N WARNING: Is This a Short Trap or Market Manipulation?
Crypto traders, stay alert! 🚨
The $AIN chart highlights a potential volatility trap where a sudden price drop is followed by a sharp upward recovery.
📉 What Traders Should Watch:
🔴 Sudden price drops can create fear and attract short sellers.
🟢 Sharp rebounds can trigger short liquidations.
⚠️ High volatility can expose traders to unexpected losses.
📊 My Market Observation:
Don't assume every breakdown is a confirmed bearish trend. Watch trading volume, liquidity, price action, and confirmation before making decisions.
🔥 Important Reminders:
- Avoid emotional trading.
- Be careful with high-leverage positions.
- Always manage risk.
- Never trust unverified manipulation claims.
- Do your own research before trading.
💬 Discussion:
Do you think $AIN is showing a potential short trap, or is this simply normal market volatility?
Share your thoughts below! 👇
#AIN #CryptoWarning #BinanceSquare #CryptoAnalysis #MarketVolatility #TradingRisk #Altcoins
1
424
·
--
Төмен (кемімелі)
🐸 $PEPE
{spot}(PEPEUSDT)
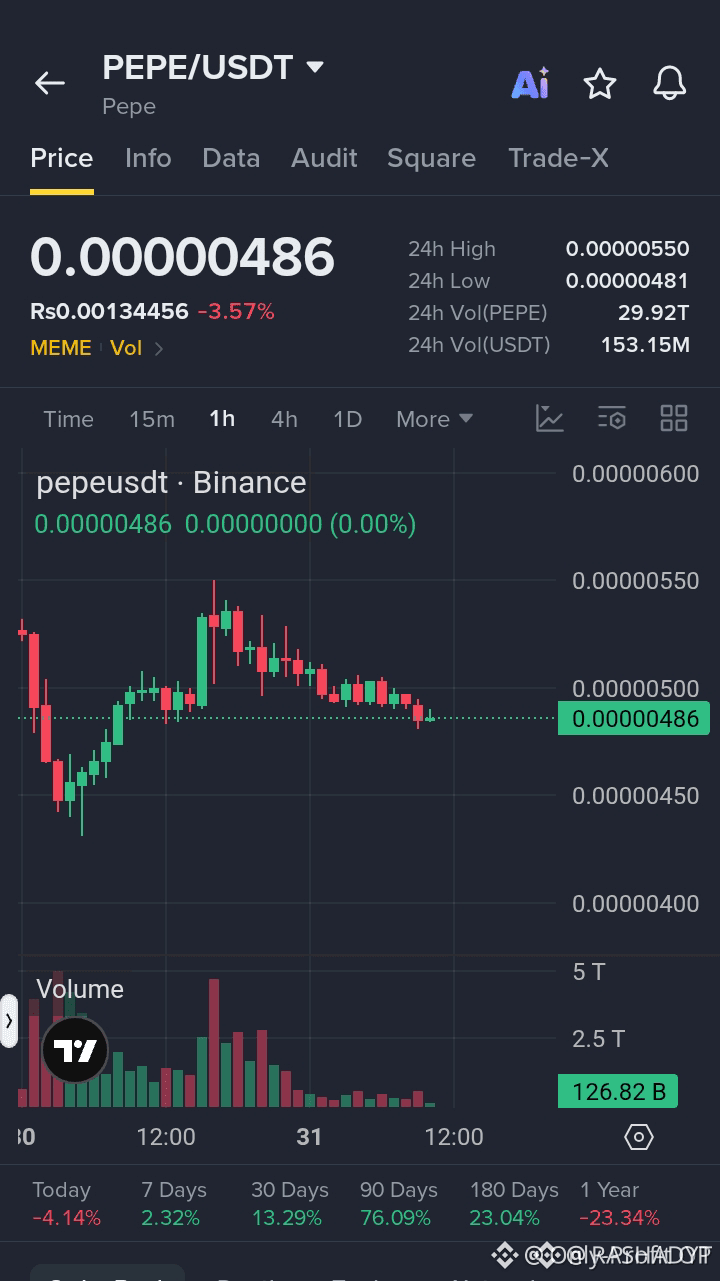
E – Can Bulls Make a Comeback? 🚀
PEPE is trading around $0.00000486, showing a slight pullback of 3.57%.
📊 Key Levels to Watch:
- Resistance: $0.00000500 – $0.00000550
- Support: $0.00000481 – $0.00000450
👀 Buyers need stronger momentum to push the price higher. A break below support could bring more downside pressure.
🔥 Is $PEPE preparing for its next big move?
Are you BULLISH or BEARISH? 👇
#PEPE #PEPEUSDT #Memecoin #Crypto #BinanceSquare
🐸 $PEPE
E – Can Bulls Make a Comeback? 🚀
PEPE is trading around $0.00000486, showing a slight pullback of 3.57%.
📊 Key Levels to Watch:
- Resistance: $0.00000500 – $0.00000550
- Support: $0.00000481 – $0.00000450
👀 Buyers need stronger momentum to push the price higher. A break below support could bring more downside pressure.
🔥 Is $PEPE preparing for its next big move?
Are you BULLISH or BEARISH? 👇
#PEPE #PEPEUSDT #Memecoin #Crypto #BinanceSquare
E – Can Bulls Make a Comeback? 🚀
PEPE is trading around $0.00000486, showing a slight pullback of 3.57%.
📊 Key Levels to Watch:
- Resistance: $0.00000500 – $0.00000550
- Support: $0.00000481 – $0.00000450
👀 Buyers need stronger momentum to push the price higher. A break below support could bring more downside pressure.
🔥 Is $PEPE preparing for its next big move?
Are you BULLISH or BEARISH? 👇
#PEPE #PEPEUSDT #Memecoin #Crypto #BinanceSquare
1
47
·
--
Төмен (кемімелі)
🚀 $BULLA A MARKET UPDATE: Bulls Preparing for Another Move? 🐂
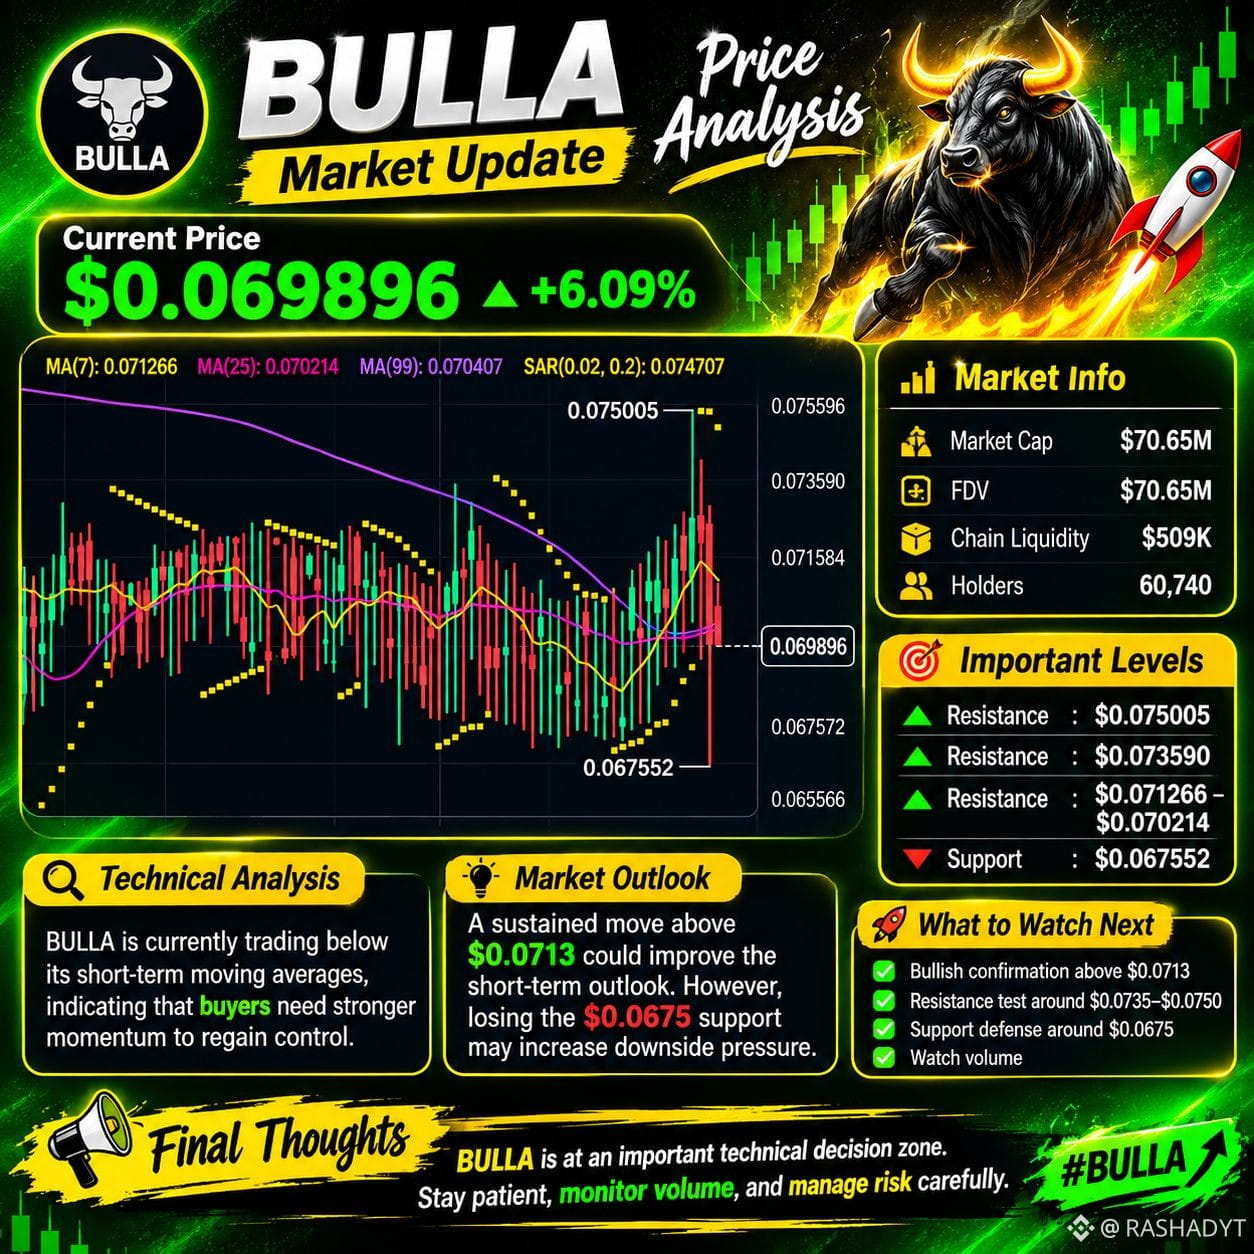
$BULLA is currently trading around $0.069896, showing a 24-hour gain of approximately 6.09%.
📊 Technical Analysis:
- MA(7): $0.071266
- MA(25): $0.070214
- MA(99): $0.070407
- SAR: $0.074707
🔥 Key Price Levels:
🟢 Support: $0.067552 – $0.067500
🔴 Resistance 1: $0.071266
🔴 Resistance 2: $0.073590
🎯 Major Resistance: $0.075005
📈 Market Outlook:
BULLA is showing signs of recovery, but the price remains below its short-term moving averages.
A confirmed breakout above $0.0713 could improve bullish momentum and open the door toward $0.0735–$0.0750.
However, losing the $0.0675 support zone could increase selling pressure.
👀 What I'm Watching Next:
✅ Breakout above $0.0713
✅ Volume confirmation
✅ Resistance test near $0.0735
✅ Support defense around $0.0675
💬 Your Opinion Matters!
Can BULLA break above $0.0750, or will sellers take control again?
#BULLA
{future}(BULLAUSDT)
#BinanceSquare #CryptoAnalysis #Altcoins #CryptoMarket #TechnicalAnalysis #MarketUpdate
🚀 $BULLA A MARKET UPDATE: Bulls Preparing for Another Move? 🐂
$BULLA is currently trading around $0.069896, showing a 24-hour gain of approximately 6.09%.
📊 Technical Analysis:
- MA(7): $0.071266
- MA(25): $0.070214
- MA(99): $0.070407
- SAR: $0.074707
🔥 Key Price Levels:
🟢 Support: $0.067552 – $0.067500
🔴 Resistance 1: $0.071266
🔴 Resistance 2: $0.073590
🎯 Major Resistance: $0.075005
📈 Market Outlook:
BULLA is showing signs of recovery, but the price remains below its short-term moving averages.
A confirmed breakout above $0.0713 could improve bullish momentum and open the door toward $0.0735–$0.0750.
However, losing the $0.0675 support zone could increase selling pressure.
👀 What I'm Watching Next:
✅ Breakout above $0.0713
✅ Volume confirmation
✅ Resistance test near $0.0735
✅ Support defense around $0.0675
💬 Your Opinion Matters!
Can BULLA break above $0.0750, or will sellers take control again?
#BULLA
#BinanceSquare #CryptoAnalysis #Altcoins #CryptoMarket #TechnicalAnalysis #MarketUpdate
$BULLA is currently trading around $0.069896, showing a 24-hour gain of approximately 6.09%.
📊 Technical Analysis:
- MA(7): $0.071266
- MA(25): $0.070214
- MA(99): $0.070407
- SAR: $0.074707
🔥 Key Price Levels:
🟢 Support: $0.067552 – $0.067500
🔴 Resistance 1: $0.071266
🔴 Resistance 2: $0.073590
🎯 Major Resistance: $0.075005
📈 Market Outlook:
BULLA is showing signs of recovery, but the price remains below its short-term moving averages.
A confirmed breakout above $0.0713 could improve bullish momentum and open the door toward $0.0735–$0.0750.
However, losing the $0.0675 support zone could increase selling pressure.
👀 What I'm Watching Next:
✅ Breakout above $0.0713
✅ Volume confirmation
✅ Resistance test near $0.0735
✅ Support defense around $0.0675
💬 Your Opinion Matters!
Can BULLA break above $0.0750, or will sellers take control again?
#BULLA
#BinanceSquare #CryptoAnalysis #Altcoins #CryptoMarket #TechnicalAnalysis #MarketUpdate
1
1
132
·
--
Жоғары (өспелі)
🚀 $BULLA LA – Is a Big Move Coming?
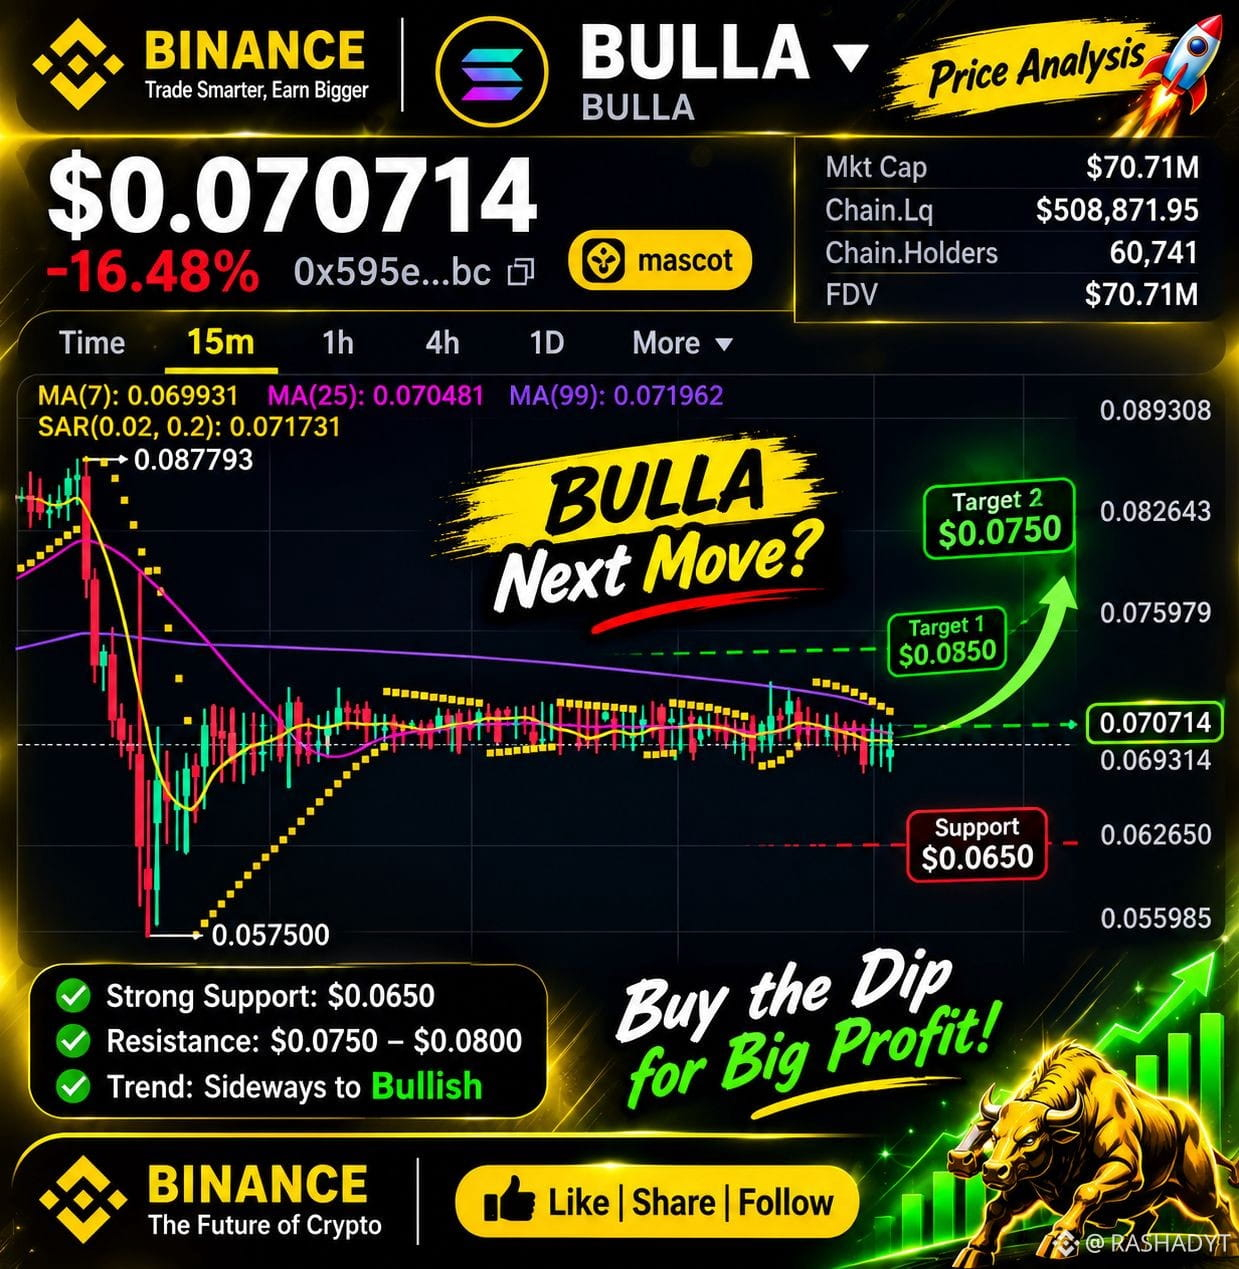
$BULLA is currently trading around $0.070714, down 16.48% in the latest snapshot.
📊 Technical Market Overview:
- Current Price: $0.070714
- Market Cap: $70.71M
- Holders: 60,741
- Support Zone: $0.0650
- Resistance Zone: $0.0750 – $0.0800
🔥 Key Levels to Watch:
🟢 Support: $0.0650
🎯 Target 1: $0.0750
🎯 Target 2: $0.0850
📈 Market Outlook:
BULLA is consolidating after a sharp decline. Traders should watch for a confirmed breakout above resistance before assuming a bullish reversal.
⚠️ My Strategy: Patience is important. Watch volume, price action, and key support levels before making any decision.
💬 What do you think about $BULLA?
Can it recover and make a strong move?
👍 Like | 🔁 Share | 💬 Comment | ⭐ Follow
#BULLA
{future}(BULLAUSDT)
#Binance #Crypto #Altcoins #CryptoAnalysis #Trading #BinanceSquare
🚀 $BULLA LA – Is a Big Move Coming?
$BULLA is currently trading around $0.070714, down 16.48% in the latest snapshot.
📊 Technical Market Overview:
- Current Price: $0.070714
- Market Cap: $70.71M
- Holders: 60,741
- Support Zone: $0.0650
- Resistance Zone: $0.0750 – $0.0800
🔥 Key Levels to Watch:
🟢 Support: $0.0650
🎯 Target 1: $0.0750
🎯 Target 2: $0.0850
📈 Market Outlook:
BULLA is consolidating after a sharp decline. Traders should watch for a confirmed breakout above resistance before assuming a bullish reversal.
⚠️ My Strategy: Patience is important. Watch volume, price action, and key support levels before making any decision.
💬 What do you think about $BULLA ?
Can it recover and make a strong move?
👍 Like | 🔁 Share | 💬 Comment | ⭐ Follow
#BULLA
#Binance #Crypto #Altcoins #CryptoAnalysis #Trading #BinanceSquare
$BULLA is currently trading around $0.070714, down 16.48% in the latest snapshot.
📊 Technical Market Overview:
- Current Price: $0.070714
- Market Cap: $70.71M
- Holders: 60,741
- Support Zone: $0.0650
- Resistance Zone: $0.0750 – $0.0800
🔥 Key Levels to Watch:
🟢 Support: $0.0650
🎯 Target 1: $0.0750
🎯 Target 2: $0.0850
📈 Market Outlook:
BULLA is consolidating after a sharp decline. Traders should watch for a confirmed breakout above resistance before assuming a bullish reversal.
⚠️ My Strategy: Patience is important. Watch volume, price action, and key support levels before making any decision.
💬 What do you think about $BULLA ?
Can it recover and make a strong move?
👍 Like | 🔁 Share | 💬 Comment | ⭐ Follow
#BULLA
#Binance #Crypto #Altcoins #CryptoAnalysis #Trading #BinanceSquare
2
650
·
--
Төмен (кемімелі)
🚀 $BULLA
{future}(BULLAUSDT)
A Market Analysis – Consolidation Before a Big Move?
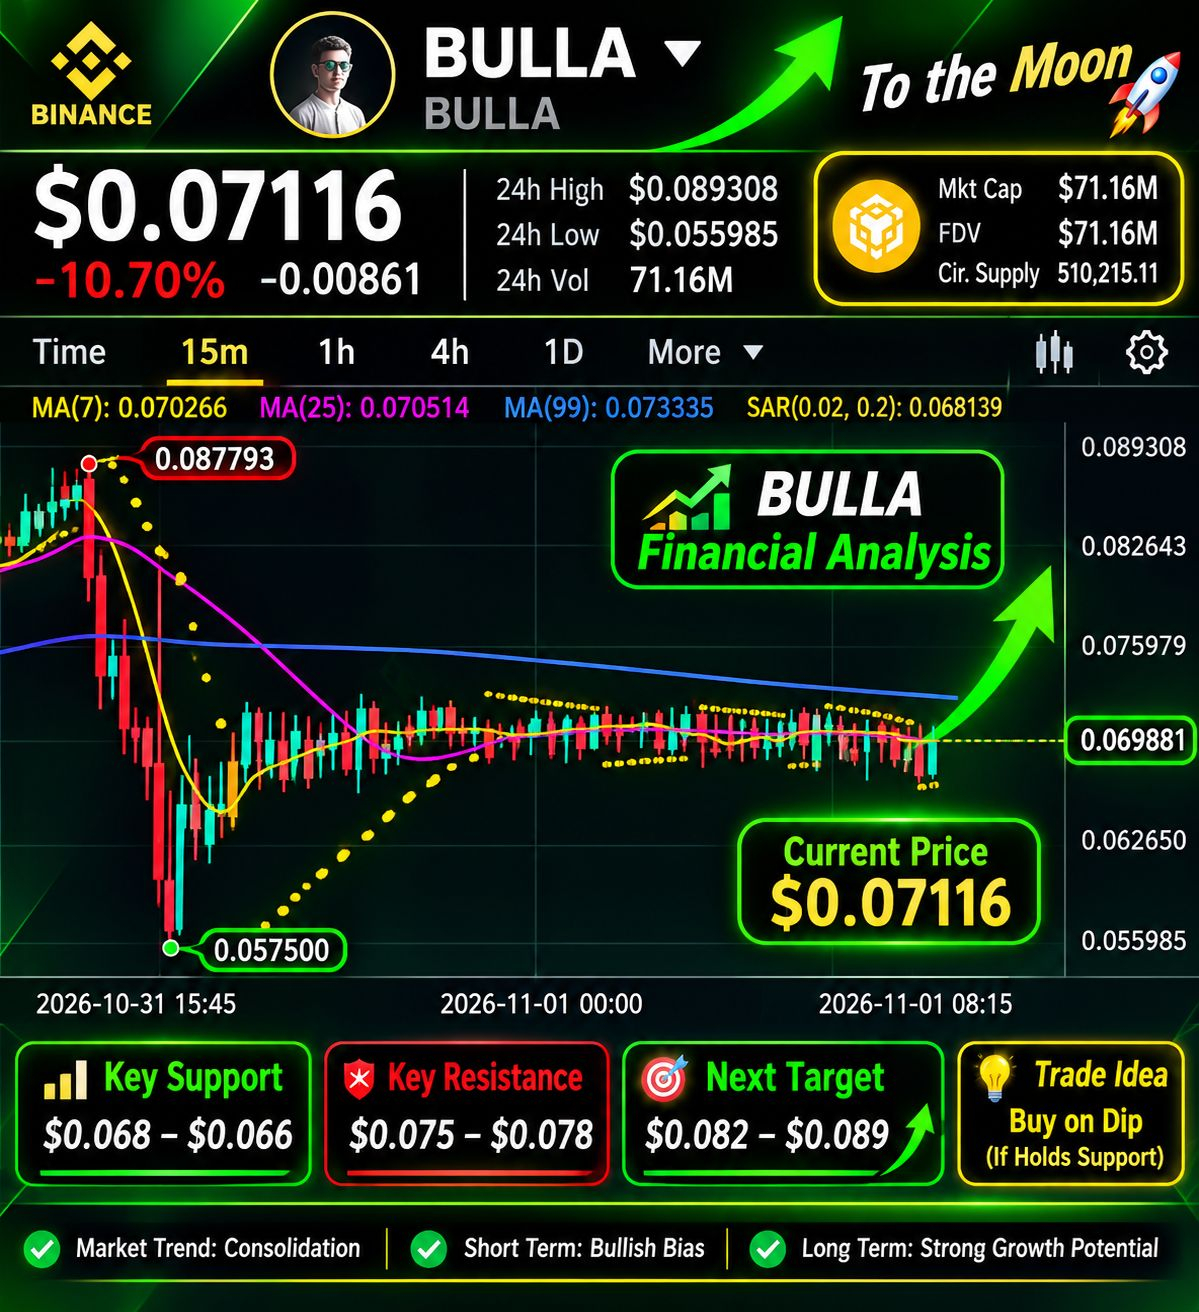
$BULLA is currently trading around $0.07116, down approximately 10.70%.
📊 Technical Overview (15M Chart):
- MA(7): $0.070266
- MA(25): $0.070514
- MA(99): $0.073335
- SAR: $0.068139
🔍 Key Price Levels:
🟢 Support Zone: $0.068 – $0.066
🔴 Resistance Zone: $0.075 – $0.078
🎯 Potential Upside Target: $0.082 – $0.089
📈 Market Outlook:
BULLA is showing sideways consolidation after a sharp decline. The price is attempting to stabilize around the $0.070 area.
A breakout above resistance could improve bullish momentum, while losing the support zone may bring further downside pressure.
⚠️ My Observation:
Watch volume, support and resistance before making any trading decisions. No breakout is confirmed yet.
What do you think? Can $BULLA recover from here? 👀
#BULLA #Binance #CryptoAnalysis #Altcoins #CryptoMarket #TechnicalAnalysis #Trading
🚀 $BULLA
A Market Analysis – Consolidation Before a Big Move?
$BULLA is currently trading around $0.07116, down approximately 10.70%.
📊 Technical Overview (15M Chart):
- MA(7): $0.070266
- MA(25): $0.070514
- MA(99): $0.073335
- SAR: $0.068139
🔍 Key Price Levels:
🟢 Support Zone: $0.068 – $0.066
🔴 Resistance Zone: $0.075 – $0.078
🎯 Potential Upside Target: $0.082 – $0.089
📈 Market Outlook:
BULLA is showing sideways consolidation after a sharp decline. The price is attempting to stabilize around the $0.070 area.
A breakout above resistance could improve bullish momentum, while losing the support zone may bring further downside pressure.
⚠️ My Observation:
Watch volume, support and resistance before making any trading decisions. No breakout is confirmed yet.
What do you think? Can $BULLA recover from here? 👀
#BULLA #Binance #CryptoAnalysis #Altcoins #CryptoMarket #TechnicalAnalysis #Trading
A Market Analysis – Consolidation Before a Big Move?
$BULLA is currently trading around $0.07116, down approximately 10.70%.
📊 Technical Overview (15M Chart):
- MA(7): $0.070266
- MA(25): $0.070514
- MA(99): $0.073335
- SAR: $0.068139
🔍 Key Price Levels:
🟢 Support Zone: $0.068 – $0.066
🔴 Resistance Zone: $0.075 – $0.078
🎯 Potential Upside Target: $0.082 – $0.089
📈 Market Outlook:
BULLA is showing sideways consolidation after a sharp decline. The price is attempting to stabilize around the $0.070 area.
A breakout above resistance could improve bullish momentum, while losing the support zone may bring further downside pressure.
⚠️ My Observation:
Watch volume, support and resistance before making any trading decisions. No breakout is confirmed yet.
What do you think? Can $BULLA recover from here? 👀
#BULLA #Binance #CryptoAnalysis #Altcoins #CryptoMarket #TechnicalAnalysis #Trading
1
317
·
--
Жоғары (өспелі)
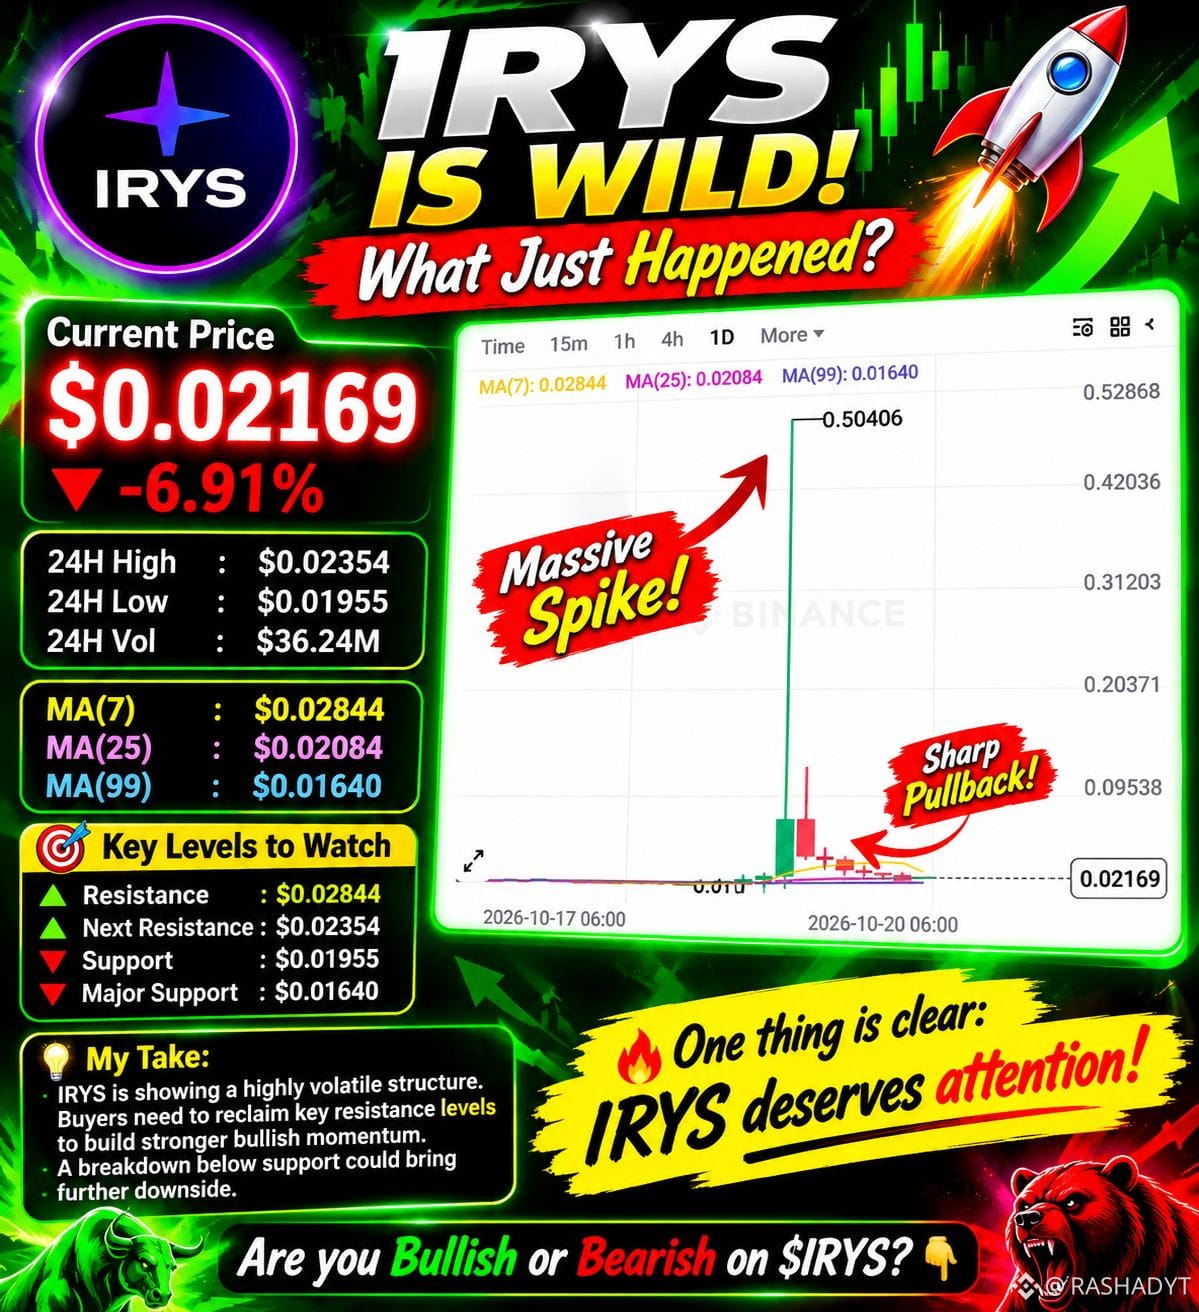
🚀 $IRYS is still in the spotlight! After a massive spike, the market is watching the next move. Will bulls make a comeback? 👀🔥
#IRYS
{future}(IRYSUSDT)
#Crypto #BinanceSquare
🚀 $IRYS is still in the spotlight! After a massive spike, the market is watching the next move. Will bulls make a comeback? 👀🔥
#IRYS
#Crypto #BinanceSquare
#IRYS
#Crypto #BinanceSquare
1
2
573
·
--
Жоғары (өспелі)
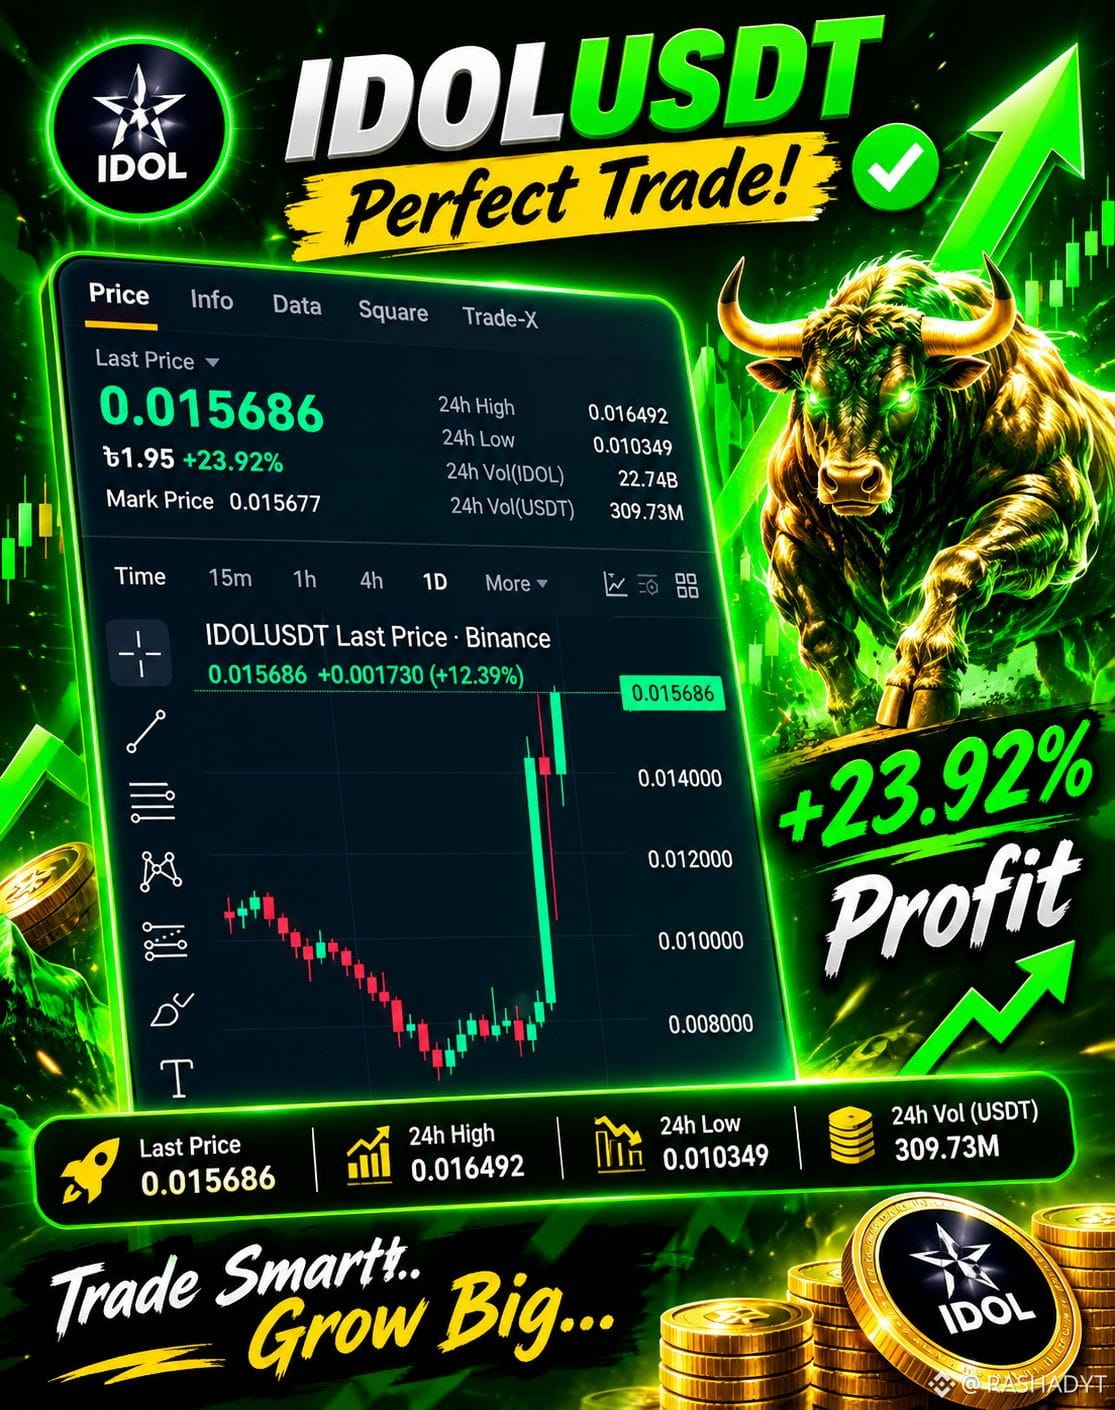
🚀 IDOLUSDT IS MAKING A BIG MOVE! 🔥
$IDOL L is showing impressive bullish momentum! 📈
According to the chart snapshot, IDOL is trading at $0.015686, up approximately 23.92% in 24 hours.
🔥 Key Market Data:
- 💰 Last Price: $0.015686
- 📈 24H Change: +23.92%
- 🎯 24H High: $0.016492
- 📉 24H Low: $0.010349
- 📊 24H Volume: 309.73M USDT
What I'm Watching Next 👀
Can ID
{future}(IDOLUSDT)
OL maintain its bullish momentum and challenge the $0.016492 resistance?
If buyers remain active, another move upward could be interesting. However, a pullback is also possible after such a strong rally.
💬 Let's Discuss:
Do you think $IDOL can break above $0.0165?
🟢 BULLISH or 🔴 BEARISH?
Drop your thoughts in the comments!
DYOR. Not financial advice. Always manage your risk.
#IDOL #IDOL USDT #Binance #Crypto #Altcoins! oins #CryptoTrading #BinanceSquare #MarketAnalysis
🚀 IDOLUSDT IS MAKING A BIG MOVE! 🔥
$IDOL L is showing impressive bullish momentum! 📈
According to the chart snapshot, IDOL is trading at $0.015686, up approximately 23.92% in 24 hours.
🔥 Key Market Data:
- 💰 Last Price: $0.015686
- 📈 24H Change: +23.92%
- 🎯 24H High: $0.016492
- 📉 24H Low: $0.010349
- 📊 24H Volume: 309.73M USDT
What I'm Watching Next 👀
Can ID
OL maintain its bullish momentum and challenge the $0.016492 resistance?
If buyers remain active, another move upward could be interesting. However, a pullback is also possible after such a strong rally.
💬 Let's Discuss:
Do you think $IDOL can break above $0.0165?
🟢 BULLISH or 🔴 BEARISH?
Drop your thoughts in the comments!
DYOR. Not financial advice. Always manage your risk.
#IDOL #IDOL USDT #Binance #Crypto #Altcoins! oins #CryptoTrading #BinanceSquare #MarketAnalysis
$IDOL L is showing impressive bullish momentum! 📈
According to the chart snapshot, IDOL is trading at $0.015686, up approximately 23.92% in 24 hours.
🔥 Key Market Data:
- 💰 Last Price: $0.015686
- 📈 24H Change: +23.92%
- 🎯 24H High: $0.016492
- 📉 24H Low: $0.010349
- 📊 24H Volume: 309.73M USDT
What I'm Watching Next 👀
Can ID
OL maintain its bullish momentum and challenge the $0.016492 resistance?
If buyers remain active, another move upward could be interesting. However, a pullback is also possible after such a strong rally.
💬 Let's Discuss:
Do you think $IDOL can break above $0.0165?
🟢 BULLISH or 🔴 BEARISH?
Drop your thoughts in the comments!
DYOR. Not financial advice. Always manage your risk.
#IDOL #IDOL USDT #Binance #Crypto #Altcoins! oins #CryptoTrading #BinanceSquare #MarketAnalysis
2
296
·
--
Жоғары (өспелі)
🚀 $GSTOCK CK – WATCHING FOR THE NEXT BIG MOVE! 📈
$GSTOCK is currently trading around $0.0039146, showing a slight pullback of 1.35%.
🔍 15M Chart Analysis:
- Current Price: $0.0039146
- MA(7): $0.0039641
- MA(25): $0.0039463
- MA(99): $0.0039788
- SAR: $0.0037393
📊 Key Levels to Watch:
🟢 Support Zone: $0.00367 – $0.00347
🔴 Resistance Zone: $0.00396 – $0.00412
🔥 My Market View:
GST
{alpha}(560xcafdbce93477261db8250e42bdae6e66733f9e20)
OCK is showing a consolidation phase. A strong breakout above the moving averages could improve the short-term outlook. However, a breakdown below support may bring further downside pressure.
👀 Keep watching volume and price action before making any decisions.
💎 Trade smart. Stay patient. Manage your risk!
#GSTOCK CK #Crypto #BinanceSquare #CryptoAnalysis #Altcoins #Trading #TechnicalAnalysis
🚀 $GSTOCK CK – WATCHING FOR THE NEXT BIG MOVE! 📈
$GSTOCK is currently trading around $0.0039146, showing a slight pullback of 1.35%.
🔍 15M Chart Analysis:
- Current Price: $0.0039146
- MA(7): $0.0039641
- MA(25): $0.0039463
- MA(99): $0.0039788
- SAR: $0.0037393
📊 Key Levels to Watch:
🟢 Support Zone: $0.00367 – $0.00347
🔴 Resistance Zone: $0.00396 – $0.00412
🔥 My Market View:
GST
OCK is showing a consolidation phase. A strong breakout above the moving averages could improve the short-term outlook. However, a breakdown below support may bring further downside pressure.
👀 Keep watching volume and price action before making any decisions.
💎 Trade smart. Stay patient. Manage your risk!
#GSTOCK CK #Crypto #BinanceSquare #CryptoAnalysis #Altcoins #Trading #TechnicalAnalysis
$GSTOCK is currently trading around $0.0039146, showing a slight pullback of 1.35%.
🔍 15M Chart Analysis:
- Current Price: $0.0039146
- MA(7): $0.0039641
- MA(25): $0.0039463
- MA(99): $0.0039788
- SAR: $0.0037393
📊 Key Levels to Watch:
🟢 Support Zone: $0.00367 – $0.00347
🔴 Resistance Zone: $0.00396 – $0.00412
🔥 My Market View:
GST
OCK is showing a consolidation phase. A strong breakout above the moving averages could improve the short-term outlook. However, a breakdown below support may bring further downside pressure.
👀 Keep watching volume and price action before making any decisions.
💎 Trade smart. Stay patient. Manage your risk!
#GSTOCK CK #Crypto #BinanceSquare #CryptoAnalysis #Altcoins #Trading #TechnicalAnalysis

1
4
928
·
--
Жоғары (өспелі)
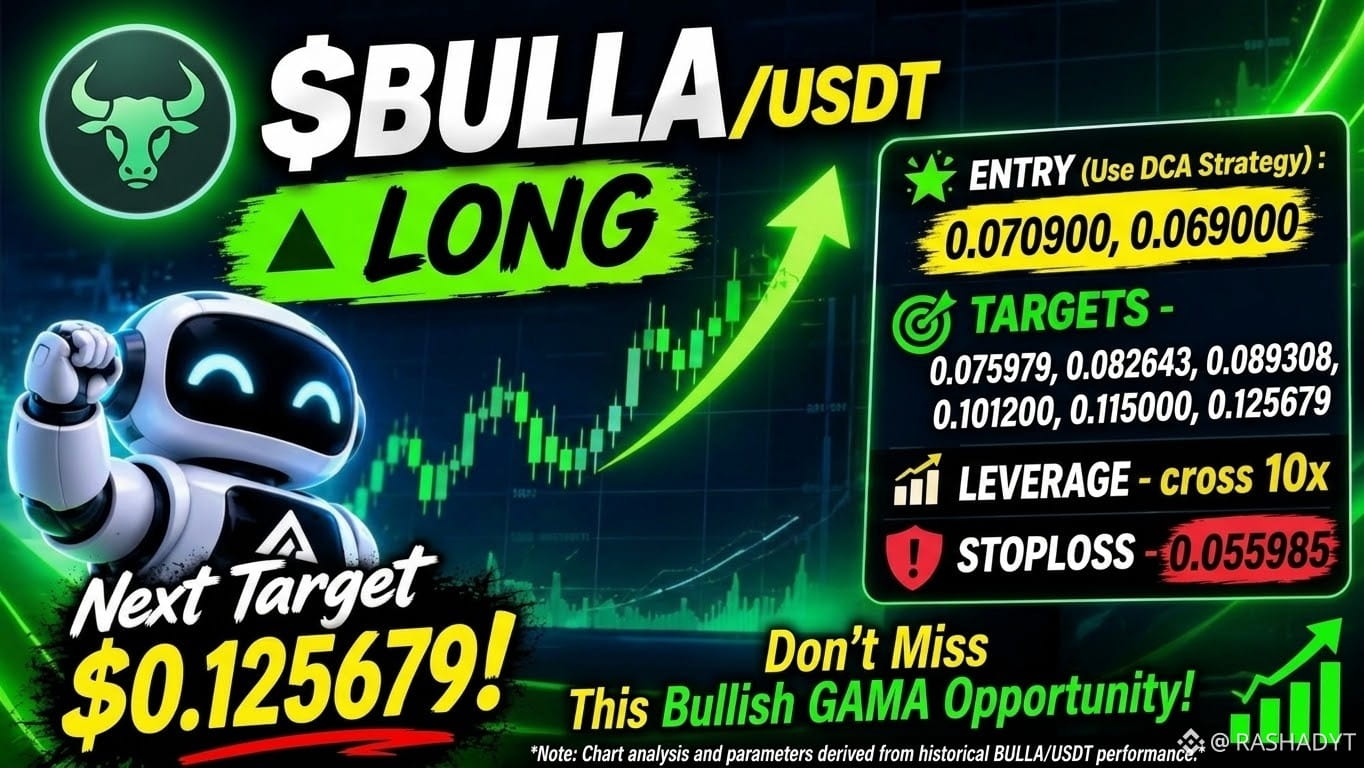
Here is the complete banner text and post caption in English, ready to be used on Binance Square or other crypto platforms:
📢 Banner and Post Details:
Text for the Banner:
* Coin Name: $BULLA
{future}(BULLAUSDT)
A / USDT
* Position: 🟢 LONG
* Entry Zone: 0.070900, 0.069000
* Targets: 0.075979, 0.082643, 0.089308, 0.101200, 0.115000, 0.125679
* Leverage: Cross 10x
* Stop Loss: 0.055985
* Next Big Target: Next Target $0.125679!
Post Caption:
> 🚀 $BULLA / USDT Trading Signal
> Based on the market trend and chart analysis, there is a great LONG opportunity for $BULLA. You can enter using the DCA strategy!
> * 🟢 Entry: 0.070900, 0.069000
> * 🎯 Targets: 0.075979, 0.082643, 0.089308, 0.101200, 0.115000, 0.125679
> * 📈 Leverage: Cross 10x
> * 🛑 Stop Loss: 0.055985
> Don't miss this bullish opportunity! Always manage your own risk before trading.
> #BULLA #CryptoTrading #BinanceSquare #LongSignal #CryptoSignals
>
Here is the complete banner text and post caption in English, ready to be used on Binance Square or other crypto platforms:
📢 Banner and Post Details:
Text for the Banner:
* Coin Name: $BULLA
A / USDT
* Position: 🟢 LONG
* Entry Zone: 0.070900, 0.069000
* Targets: 0.075979, 0.082643, 0.089308, 0.101200, 0.115000, 0.125679
* Leverage: Cross 10x
* Stop Loss: 0.055985
* Next Big Target: Next Target $0.125679!
Post Caption:
> 🚀 $BULLA / USDT Trading Signal
> Based on the market trend and chart analysis, there is a great LONG opportunity for $BULLA . You can enter using the DCA strategy!
> * 🟢 Entry: 0.070900, 0.069000
> * 🎯 Targets: 0.075979, 0.082643, 0.089308, 0.101200, 0.115000, 0.125679
> * 📈 Leverage: Cross 10x
> * 🛑 Stop Loss: 0.055985
> Don't miss this bullish opportunity! Always manage your own risk before trading.
> #BULLA #CryptoTrading #BinanceSquare #LongSignal #CryptoSignals
>
📢 Banner and Post Details:
Text for the Banner:
* Coin Name: $BULLA
A / USDT
* Position: 🟢 LONG
* Entry Zone: 0.070900, 0.069000
* Targets: 0.075979, 0.082643, 0.089308, 0.101200, 0.115000, 0.125679
* Leverage: Cross 10x
* Stop Loss: 0.055985
* Next Big Target: Next Target $0.125679!
Post Caption:
> 🚀 $BULLA / USDT Trading Signal
> Based on the market trend and chart analysis, there is a great LONG opportunity for $BULLA . You can enter using the DCA strategy!
> * 🟢 Entry: 0.070900, 0.069000
> * 🎯 Targets: 0.075979, 0.082643, 0.089308, 0.101200, 0.115000, 0.125679
> * 📈 Leverage: Cross 10x
> * 🛑 Stop Loss: 0.055985
> Don't miss this bullish opportunity! Always manage your own risk before trading.
> #BULLA #CryptoTrading #BinanceSquare #LongSignal #CryptoSignals
>
2
402
·
--
Жоғары (өспелі)
Here is the English version of your Binance post:
$AIOT /USDT Long Setup! 🚀
Entry Zone: 8400, 8100
(Use DCA Strategy)
{future}(AIOTUSDT)
Targets:
🎯 8850
🎯 9150
🎯 9600
🎯 10100
🎯 10250
🎯 10600
🛑 Stop Loss: 7900
⚙️ Leverage: Cross 10x
Get ready for the new ATH! 🔥
Here is the English version of your Binance post:
$AIOT /USDT Long Setup! 🚀
Entry Zone: 8400, 8100
(Use DCA Strategy)
Targets:
🎯 8850
🎯 9150
🎯 9600
🎯 10100
🎯 10250
🎯 10600
🛑 Stop Loss: 7900
⚙️ Leverage: Cross 10x
Get ready for the new ATH! 🔥
$AIOT /USDT Long Setup! 🚀
Entry Zone: 8400, 8100
(Use DCA Strategy)
Targets:
🎯 8850
🎯 9150
🎯 9600
🎯 10100
🎯 10250
🎯 10600
🛑 Stop Loss: 7900
⚙️ Leverage: Cross 10x
Get ready for the new ATH! 🔥

2
65
·
--
Жоғары (өспелі)
🚀 $BULLA A – Recovery Attempt After a Major Correction!
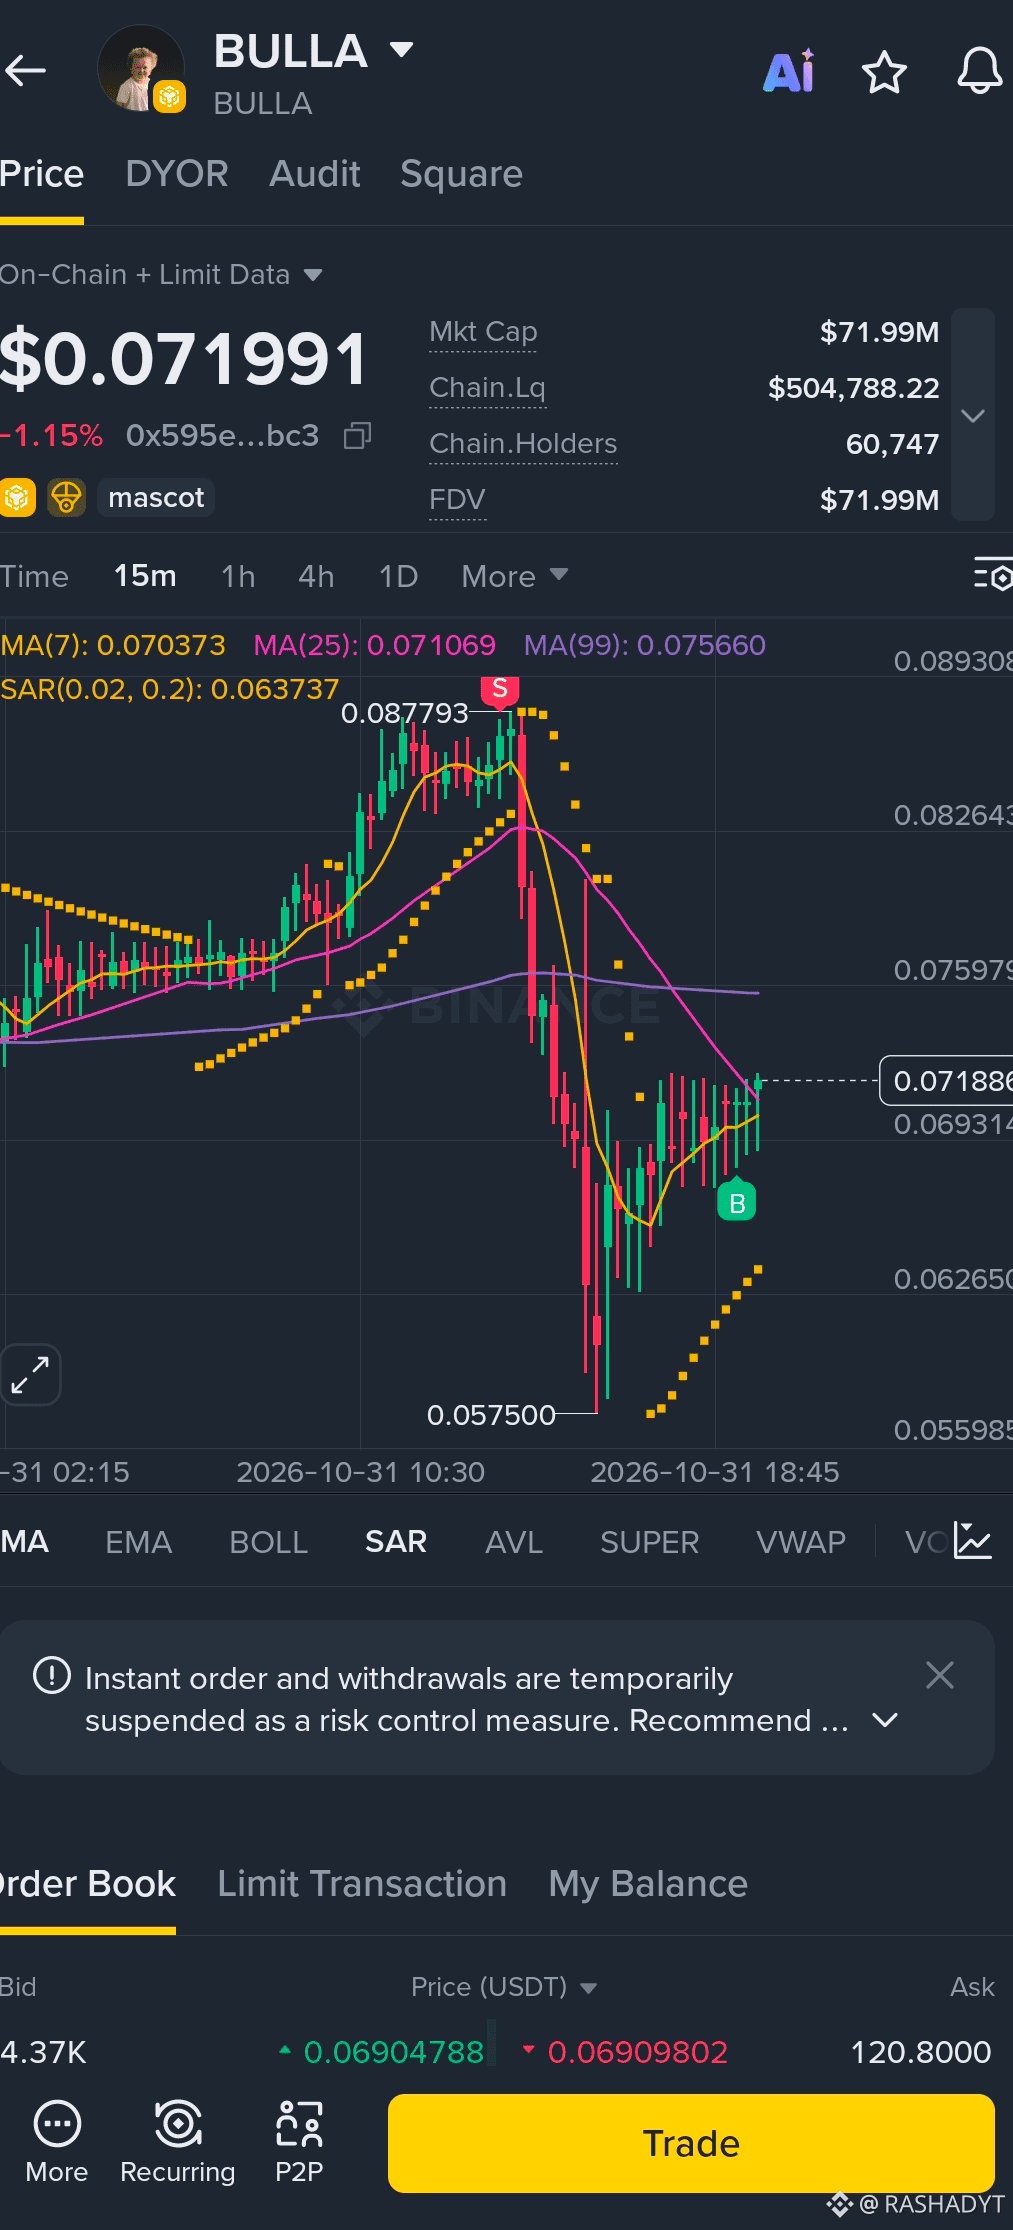
$BULLA is trading around $0.071991, down 1.15%. After dropping from $0.087793 to $USDC 0.057500, buyers are attempting to regain control.
📊 Technical Analysis (15M):
* MA(7): 0.070373
* MA(25): 0.071069
* MA(99): 0.075660
* SAR: 0.063737
🎯 Key Levels to Watch:
* Resistance 1: $0.072000
* Resistance 2: $0.075660
* Resistance 3: $0.082643
* Support 1: $0.069314
* Support 2: $0.063737
* Major Support: $0.057500
🔥 Bullish Scenario: A confirmed breakout above $0.072000 could strengthen recovery momentum toward $0.075660.
⚠️ Bearish Scenario: Failure to hold $0.069314 could bring another downward move.
Market Outlook: Short-term recovery attempt, but the overall trend remains cautious below MA(99).
💎 Patience before the next move. Trade smart!
#BULLA
{future}(BULLAUSDT)
#CryptoAnalysis #Binance #Altcoins #BullishRecovery #CryptoTrading
🚀 $BULLA A – Recovery Attempt After a Major Correction!
$BULLA is trading around $0.071991, down 1.15%. After dropping from $0.087793 to $USDC 0.057500, buyers are attempting to regain control.
📊 Technical Analysis (15M):
* MA(7): 0.070373
* MA(25): 0.071069
* MA(99): 0.075660
* SAR: 0.063737
🎯 Key Levels to Watch:
* Resistance 1: $0.072000
* Resistance 2: $0.075660
* Resistance 3: $0.082643
* Support 1: $0.069314
* Support 2: $0.063737
* Major Support: $0.057500
🔥 Bullish Scenario: A confirmed breakout above $0.072000 could strengthen recovery momentum toward $0.075660.
⚠️ Bearish Scenario: Failure to hold $0.069314 could bring another downward move.
Market Outlook: Short-term recovery attempt, but the overall trend remains cautious below MA(99).
💎 Patience before the next move. Trade smart!
#BULLA
#CryptoAnalysis #Binance #Altcoins #BullishRecovery #CryptoTrading
$BULLA is trading around $0.071991, down 1.15%. After dropping from $0.087793 to $USDC 0.057500, buyers are attempting to regain control.
📊 Technical Analysis (15M):
* MA(7): 0.070373
* MA(25): 0.071069
* MA(99): 0.075660
* SAR: 0.063737
🎯 Key Levels to Watch:
* Resistance 1: $0.072000
* Resistance 2: $0.075660
* Resistance 3: $0.082643
* Support 1: $0.069314
* Support 2: $0.063737
* Major Support: $0.057500
🔥 Bullish Scenario: A confirmed breakout above $0.072000 could strengthen recovery momentum toward $0.075660.
⚠️ Bearish Scenario: Failure to hold $0.069314 could bring another downward move.
Market Outlook: Short-term recovery attempt, but the overall trend remains cautious below MA(99).
💎 Patience before the next move. Trade smart!
#BULLA
#CryptoAnalysis #Binance #Altcoins #BullishRecovery #CryptoTrading
2
414
Көбірек контент көру үшін кіріңіз
Binance Square платформасында әлемдік криптоқоғамдастыққа қосылыңыз
⚡️ Криптовалюта туралы ең соңғы және пайдалы ақпаратты алыңыз.
💬 Әлемдегі ең ірі криптобиржаның сеніміне ие.
👍 Расталған авторлардың нақты пікірлерін табыңыз.
Электрондық пошта/телефон нөмірі
Трендтегі тақырыптар
BinanceReopensWithdrawalsForMoreAssets
3,497 рет көрілді
244 адам талқылап жатыр
Security Incident | Recovery Update #6: Withdrawals Reopen for More Assets (2026-11-03)
Binance Announcement
·77 лайк
·180.4k рет көрілді
AppleReportsMixedResults
3,539 рет көрілді
231 адам талқылап жатыр
BinanceWithdrawalScamWarning
83,128 рет көрілді
1,053 адам талқылап жатыр