#BNB smart analysis — BNBUSDT
Executive view: The chart structure remains weak, although the latest 1-day move is nearly flat. BNB is trading below its key daily moving averages, while momentum indicators remain soft. Short-term oversold readings mean volatility can stay elevated; they do not establish a reversal.
Chart read
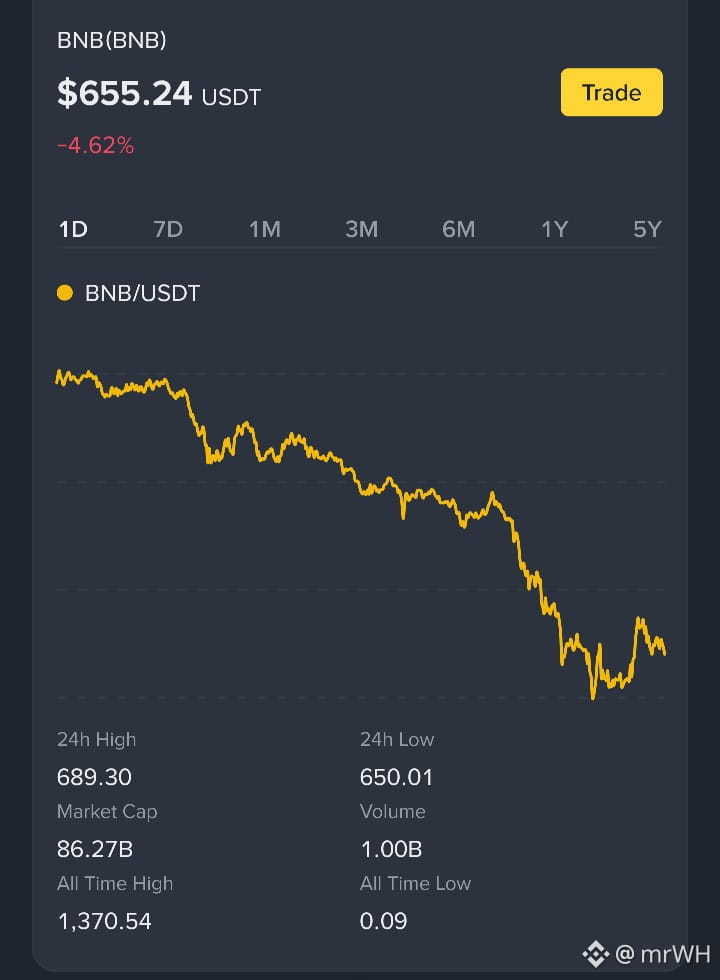
Live spot price: $655.50
24h range: $650.01–$689.30
4h chart: 59 closed candles, from Nov 2–12 UTC
Over that chart window, BNB moved from $699.25 to $654.57, a 6.39% decline.
The latest closed 4h candle was O $664.40 / H $665.24 / L $650.01 / C $654.57.
Recent performance from spot data: +0.15% over 1 day, −4.86% over 7 days, and −11.89% over 30 days.
Technical structure
Using the 1-day indicators:
BNB is below EMA 7: $689.06, EMA 25: $710.31, and EMA 99: $706.30.
The daily Bollinger lower band is $662.93; the live price is below it.
RSI 6: 33.06 and RSI 12: 36.75 show weak momentum, but not the extreme hourly readings in the stored research report.
MACD DIF: −2.2973, consistent with negative momentum.
Observed chart references are the recent low near $650.01, the daily lower band at $662.93, and the EMA cluster around $689–$710. These are historical reference levels, not trade instructions.
Flow and research context
The latest 4h large-order capital-flow block shows net inflow of 1,402.49 BNB.
The stored research report describes a different earlier snapshot with cumulative spot outflows above $25 million and large-order selling above $11.5 million in its final four-hour segment. Because the snapshots and timing differ, I would not merge them into one flow signal.
The report also recorded hourly RSI 6 at 5.39 and hourly RSI 12 at 14.55, indicating much more extreme short-term exhaustion at that report snapshot. The newer daily readings are less extreme.
Binance Square community poll
The limited Square poll shows:
Bearish: 218 of 379 votes, 57.5%
Bullish: 161 of 379 votes, 42.5%
This is a changing, limited community sample—not a measurement of overall market sentiment or a representative survey.
Executive view: The chart structure remains weak, although the latest 1-day move is nearly flat. BNB is trading below its key daily moving averages, while momentum indicators remain soft. Short-term oversold readings mean volatility can stay elevated; they do not establish a reversal.
Chart read
Live spot price: $655.50
24h range: $650.01–$689.30
4h chart: 59 closed candles, from Nov 2–12 UTC
Over that chart window, BNB moved from $699.25 to $654.57, a 6.39% decline.
The latest closed 4h candle was O $664.40 / H $665.24 / L $650.01 / C $654.57.
Recent performance from spot data: +0.15% over 1 day, −4.86% over 7 days, and −11.89% over 30 days.
Technical structure
Using the 1-day indicators:
BNB is below EMA 7: $689.06, EMA 25: $710.31, and EMA 99: $706.30.
The daily Bollinger lower band is $662.93; the live price is below it.
RSI 6: 33.06 and RSI 12: 36.75 show weak momentum, but not the extreme hourly readings in the stored research report.
MACD DIF: −2.2973, consistent with negative momentum.
Observed chart references are the recent low near $650.01, the daily lower band at $662.93, and the EMA cluster around $689–$710. These are historical reference levels, not trade instructions.
Flow and research context
The latest 4h large-order capital-flow block shows net inflow of 1,402.49 BNB.
The stored research report describes a different earlier snapshot with cumulative spot outflows above $25 million and large-order selling above $11.5 million in its final four-hour segment. Because the snapshots and timing differ, I would not merge them into one flow signal.
The report also recorded hourly RSI 6 at 5.39 and hourly RSI 12 at 14.55, indicating much more extreme short-term exhaustion at that report snapshot. The newer daily readings are less extreme.
Binance Square community poll
The limited Square poll shows:
Bearish: 218 of 379 votes, 57.5%
Bullish: 161 of 379 votes, 42.5%
This is a changing, limited community sample—not a measurement of overall market sentiment or a representative survey.