$DOT **DOT/USDT (1H) – Quick Analysis**
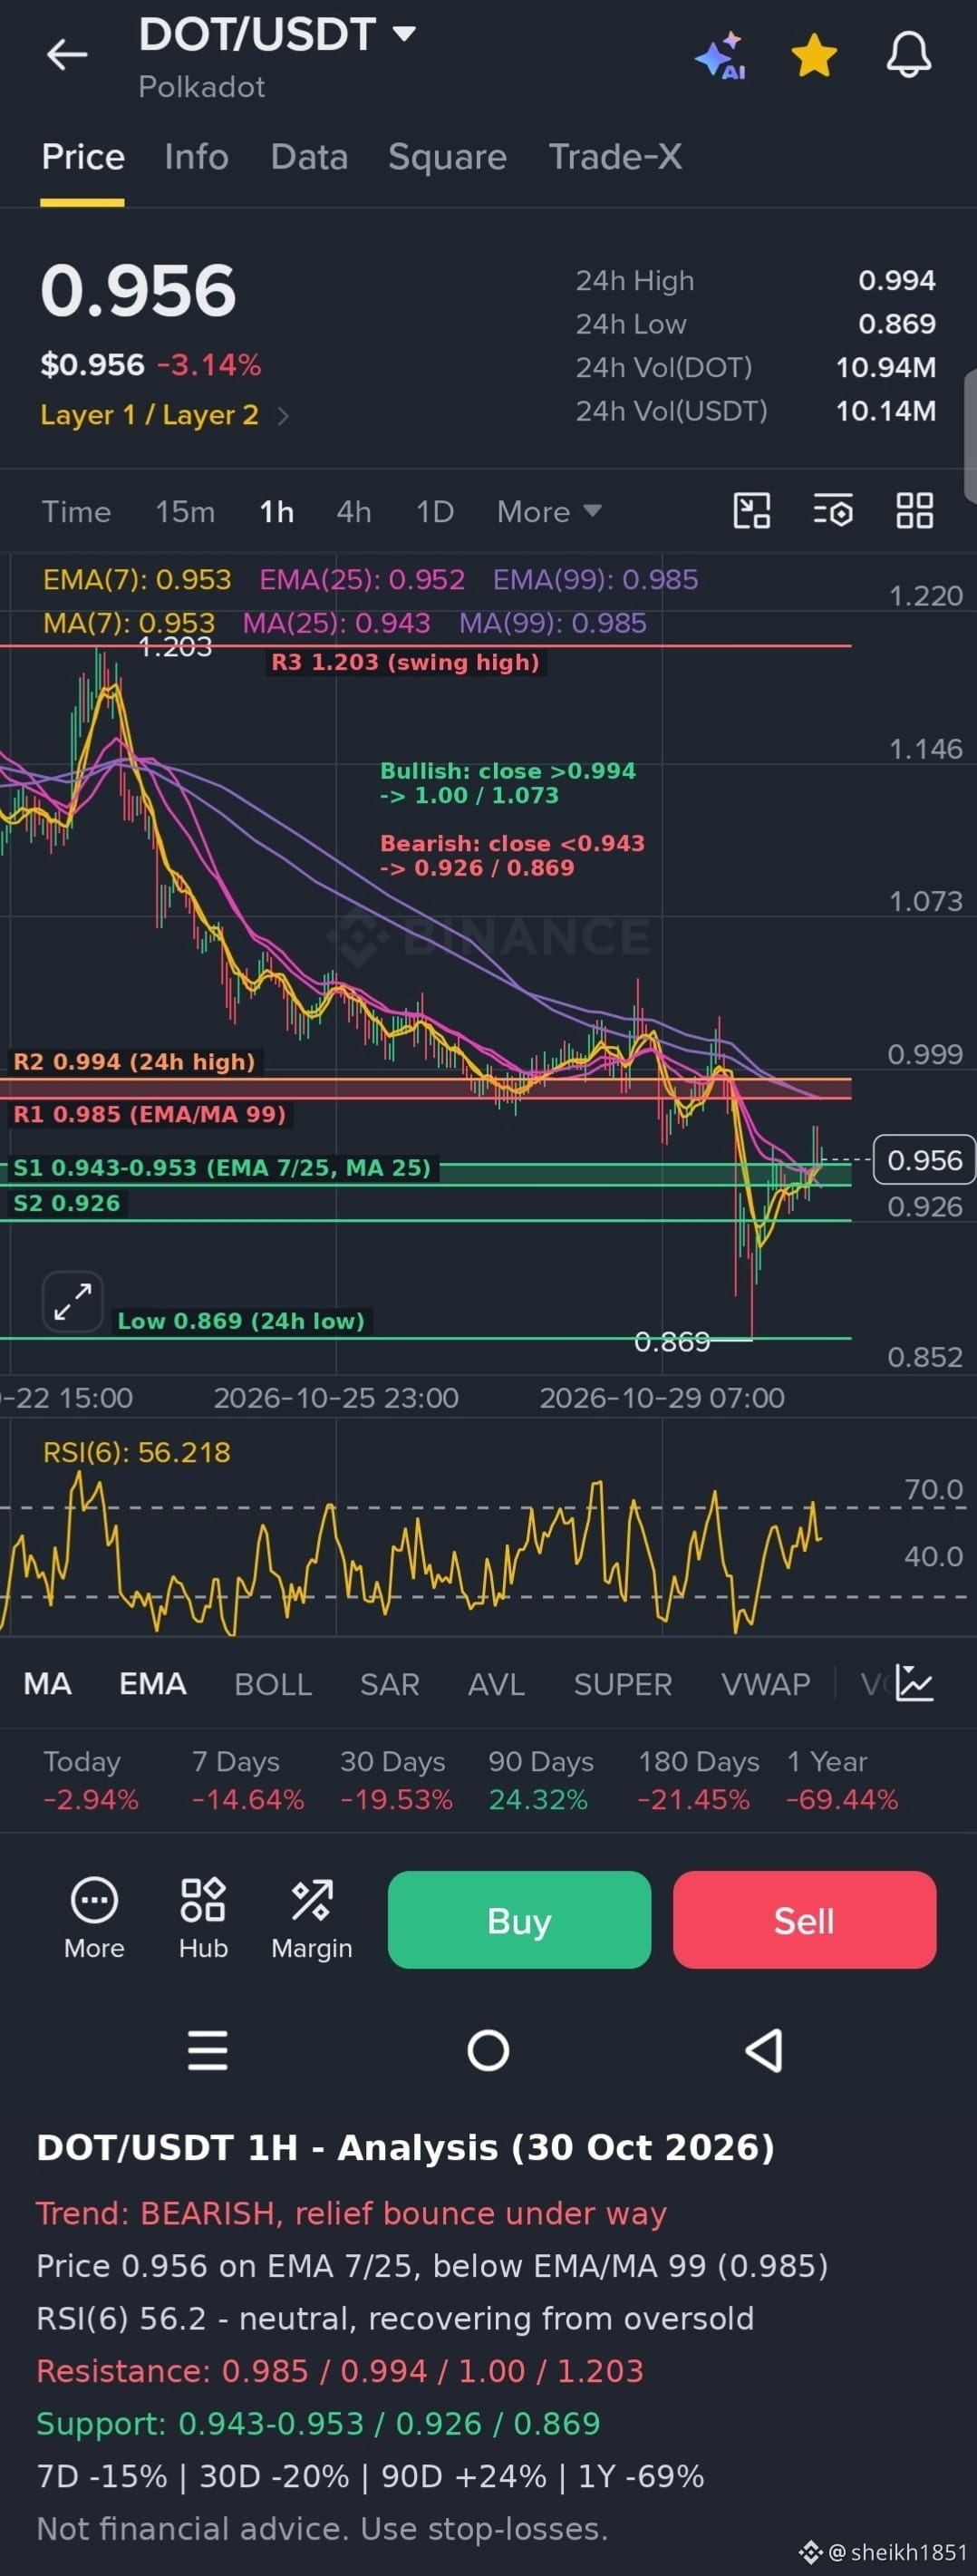
**Trend:** Bearish overall, with a relief bounce under way. Price (0.956) has been in a steady downtrend since the 1.203 peak, making lower highs. It then flushed sharply to 0.869 (the 24h low) and recovered quickly. It now sits just above EMA(7) 0.953 and EMA(25) 0.952, but below EMA(99) and MA(99) at 0.985, and those are still sloping down. The longer picture is weak: down about 15% over 7 days, 20% over 30 days and 69% over one year, though up about 24% over 90 days.
**Momentum:** RSI(6) is about 56, which is neutral and recovering from oversold. The bounce has cleared the short-term averages, but there is no strong buying pressure yet. Volume is moderate (about 10.1M USDT).
**Key levels:**
- **Resistance:** 0.985 (EMA/MA 99), then 0.994 (24h high), then about 1.00 to 1.07 and the 1.203 swing high.
- **Support:** 0.952 to 0.953 (EMA 7 and 25), then 0.943 (MA 25), then 0.926. Below that, 0.869 is the key low.
**Outlook:** Price is at a decision point between the 0.95 averages and the 0.985 resistance. A 1H close above 0.994 with rising volume would be the first sign that the downtrend is weakening and could open 1.00 and higher. A close below 0.943 would suggest the bounce has failed and put 0.926, then 0.869, back in play. Until 0.985 is reclaimed, rallies are more likely to be sold.
This is a technical read not financial advice. Use stop-losses and keep position sizes small.
#USMidtermElections #BİNANCE
**Trend:** Bearish overall, with a relief bounce under way. Price (0.956) has been in a steady downtrend since the 1.203 peak, making lower highs. It then flushed sharply to 0.869 (the 24h low) and recovered quickly. It now sits just above EMA(7) 0.953 and EMA(25) 0.952, but below EMA(99) and MA(99) at 0.985, and those are still sloping down. The longer picture is weak: down about 15% over 7 days, 20% over 30 days and 69% over one year, though up about 24% over 90 days.
**Momentum:** RSI(6) is about 56, which is neutral and recovering from oversold. The bounce has cleared the short-term averages, but there is no strong buying pressure yet. Volume is moderate (about 10.1M USDT).
**Key levels:**
- **Resistance:** 0.985 (EMA/MA 99), then 0.994 (24h high), then about 1.00 to 1.07 and the 1.203 swing high.
- **Support:** 0.952 to 0.953 (EMA 7 and 25), then 0.943 (MA 25), then 0.926. Below that, 0.869 is the key low.
**Outlook:** Price is at a decision point between the 0.95 averages and the 0.985 resistance. A 1H close above 0.994 with rising volume would be the first sign that the downtrend is weakening and could open 1.00 and higher. A close below 0.943 would suggest the bounce has failed and put 0.926, then 0.869, back in play. Until 0.985 is reclaimed, rallies are more likely to be sold.
This is a technical read not financial advice. Use stop-losses and keep position sizes small.
#USMidtermElections #BİNANCE