#cryptotradingpro #BTC
🔥 $BTC /USDT Analysis: Local consolidation before a push to $90,000?
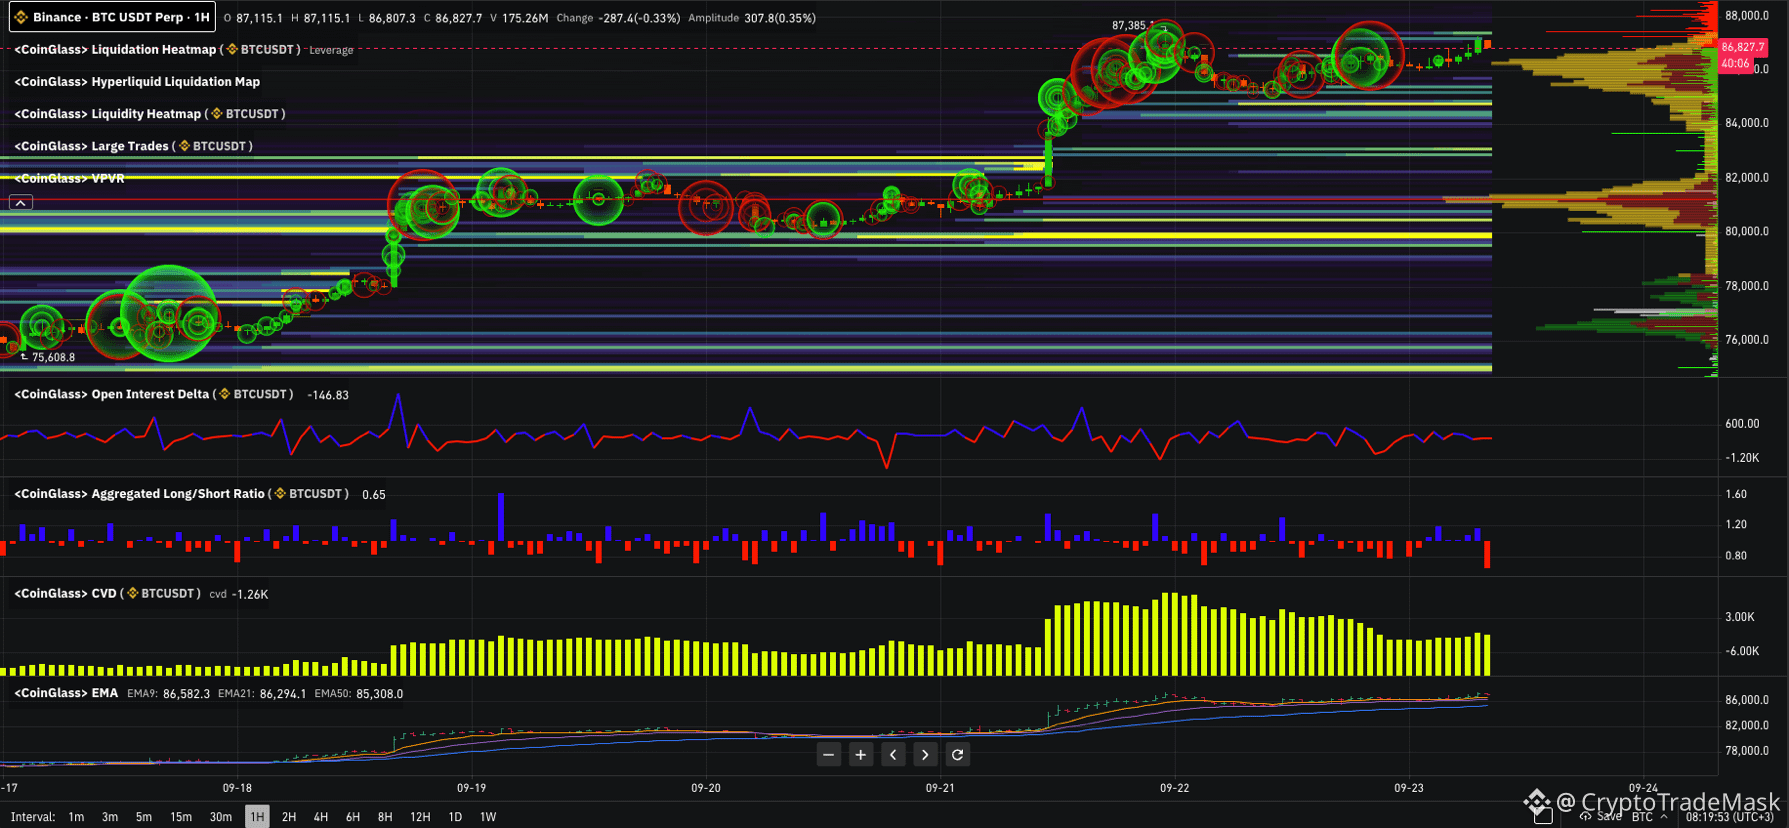
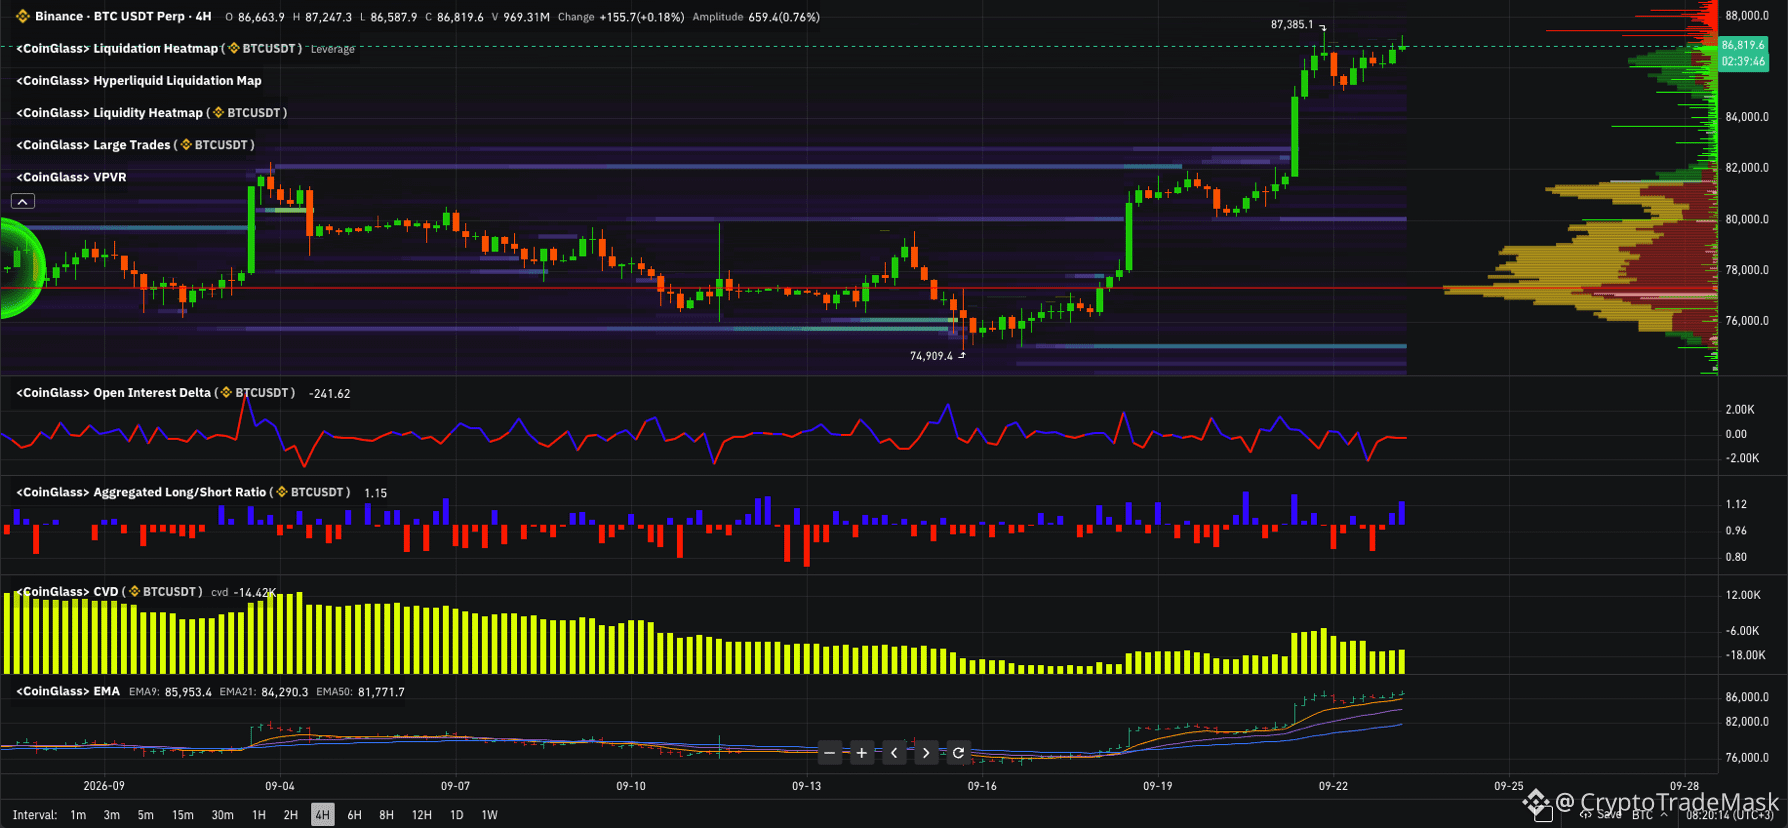
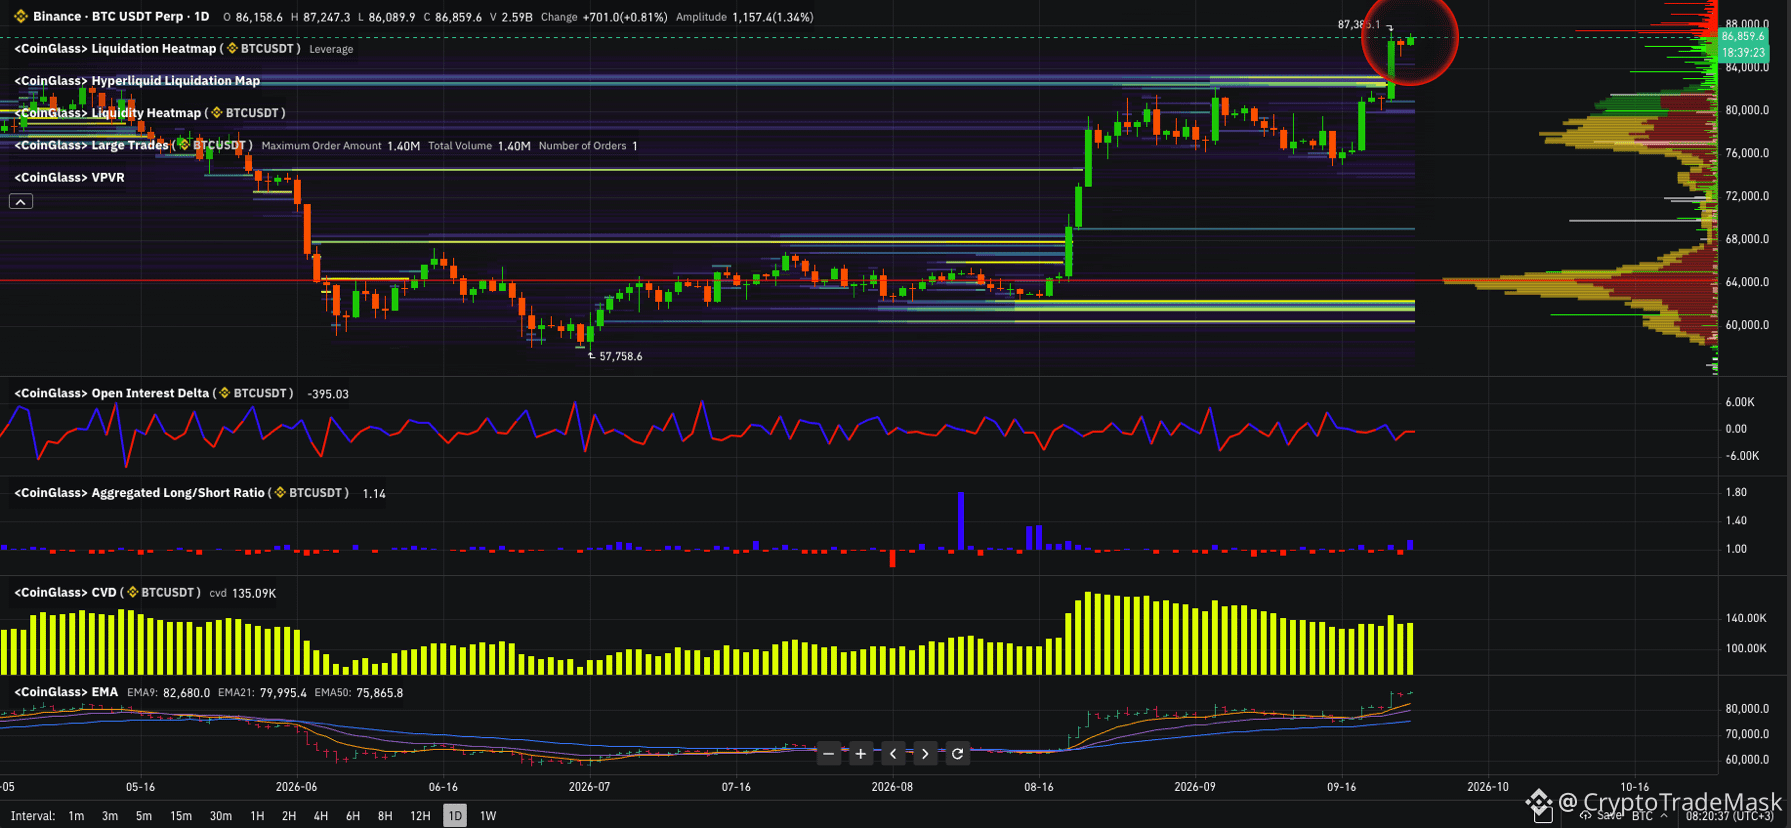
Bitcoin continues its strong upward trend, holding in the $86,800–$87,300 range and setting a new local high at $87,385. Let’s break down what the CoinGlass metrics reveal:
📊 Key indicators and factors:
➡️ Liquidity zones (Heatmap): A significant cluster of cascading short-position liquidations has formed above, in the $87,500–$88,000+ range. The price is actively being "magnetized" toward this level. The nearest buyer support below lies at $84,000–$85,000.
➡️ Volume Profile (VPVR): Major trading volumes remain significantly lower ($64k–$68k and $80k–$82k). The current zone above $86,000 shows low volume density, creating room for impulsive price movements.
➡️ Technical status (EMA): The 9/21/50 EMAs on the daily timeframe are arranged in a clear bullish fan formation below the price ($82,680 / $79,995 / $75,865), confirming the resilience of the medium-term trend.
➡️ Market behavior (CVD & OI): Buyer aggression (CVD) has slowed slightly on lower timeframes, and Open Interest (OI) is showing signs of flattening—indicating that some traders are taking local profits. At the same time, the Long/Short ratio remains healthy (around 1.15).
🎯 Price action scenarios:
🟢 Primary (bullish): A test and liquidity sweep of the $87,500–$88,000 level. Establishing support above $87,500 opens a clear path to the psychological $90,000 mark.
🟡 Local correction (technical pullback): A false breakout (sweep) of the $87,385 high, followed by a pullback to the $85,300–$84,000 support zones to deleverage. As long as the price holds above $82,600, any pullback is viewed as accumulation prior to a new upward move.
⚠️ Summary: The market maintains a strong bullish structure. The priority is to trade with the trend following a liquidity sweep or during local pullbacks to support zones.
🔥 $BTC /USDT Analysis: Local consolidation before a push to $90,000?
Bitcoin continues its strong upward trend, holding in the $86,800–$87,300 range and setting a new local high at $87,385. Let’s break down what the CoinGlass metrics reveal:
📊 Key indicators and factors:
➡️ Liquidity zones (Heatmap): A significant cluster of cascading short-position liquidations has formed above, in the $87,500–$88,000+ range. The price is actively being "magnetized" toward this level. The nearest buyer support below lies at $84,000–$85,000.
➡️ Volume Profile (VPVR): Major trading volumes remain significantly lower ($64k–$68k and $80k–$82k). The current zone above $86,000 shows low volume density, creating room for impulsive price movements.
➡️ Technical status (EMA): The 9/21/50 EMAs on the daily timeframe are arranged in a clear bullish fan formation below the price ($82,680 / $79,995 / $75,865), confirming the resilience of the medium-term trend.
➡️ Market behavior (CVD & OI): Buyer aggression (CVD) has slowed slightly on lower timeframes, and Open Interest (OI) is showing signs of flattening—indicating that some traders are taking local profits. At the same time, the Long/Short ratio remains healthy (around 1.15).
🎯 Price action scenarios:
🟢 Primary (bullish): A test and liquidity sweep of the $87,500–$88,000 level. Establishing support above $87,500 opens a clear path to the psychological $90,000 mark.
🟡 Local correction (technical pullback): A false breakout (sweep) of the $87,385 high, followed by a pullback to the $85,300–$84,000 support zones to deleverage. As long as the price holds above $82,600, any pullback is viewed as accumulation prior to a new upward move.
⚠️ Summary: The market maintains a strong bullish structure. The priority is to trade with the trend following a liquidity sweep or during local pullbacks to support zones.