
Arthur Mint
3.7k Жариялаулар

Arthur Mint
 «Square расталған+» белгісі
Хабарлау
Пайдаланушыны блоктау
Arthur is here. Crypto Expert. Web3 Builder. Verified KOL on Binance Square. Let's keep growing together: X - @ArthurMint_
71 Жазылым
42.4K+ Жазылушылар
13.9K+ лайк басылған
Жазбалар
·
--
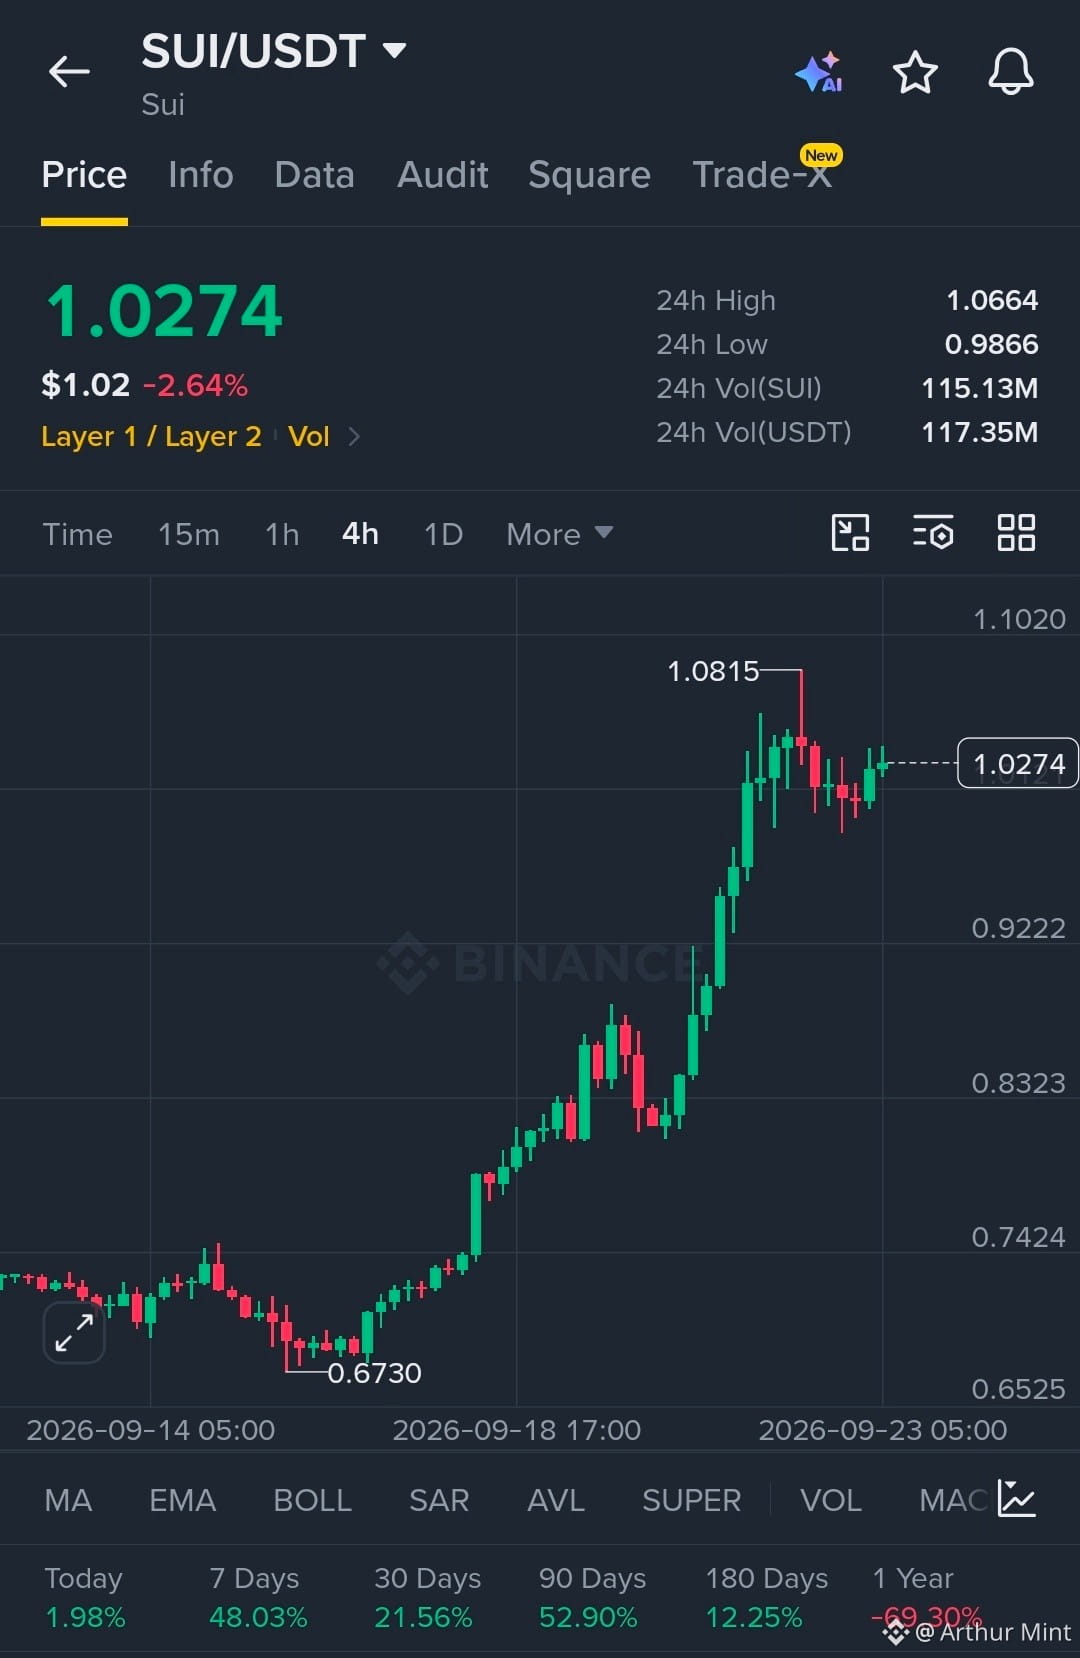
$SUI is holding strong momentum after a sharp breakout and consolidation near the highs.
Structure remains firmly controlled by buyers above the 1.00 zone.
EP
1.00–1.03
TP
TP1 1.08
TP2 1.12
TP3 1.18
SL
0.97
Liquidity remains stacked above 1.08, while price is reacting positively from the recent breakout zone. As long as SUI holds the 1.00–1.03 structure, continuation remains technically supported.
Let’s go $SUI
$SUI is holding strong momentum after a sharp breakout and consolidation near the highs.
Structure remains firmly controlled by buyers above the 1.00 zone.
EP
1.00–1.03
TP
TP1 1.08
TP2 1.12
TP3 1.18
SL
0.97
Liquidity remains stacked above 1.08, while price is reacting positively from the recent breakout zone. As long as SUI holds the 1.00–1.03 structure, continuation remains technically supported.
Let’s go $SUI
Structure remains firmly controlled by buyers above the 1.00 zone.
EP
1.00–1.03
TP
TP1 1.08
TP2 1.12
TP3 1.18
SL
0.97
Liquidity remains stacked above 1.08, while price is reacting positively from the recent breakout zone. As long as SUI holds the 1.00–1.03 structure, continuation remains technically supported.
Let’s go $SUI
1
528
·
--
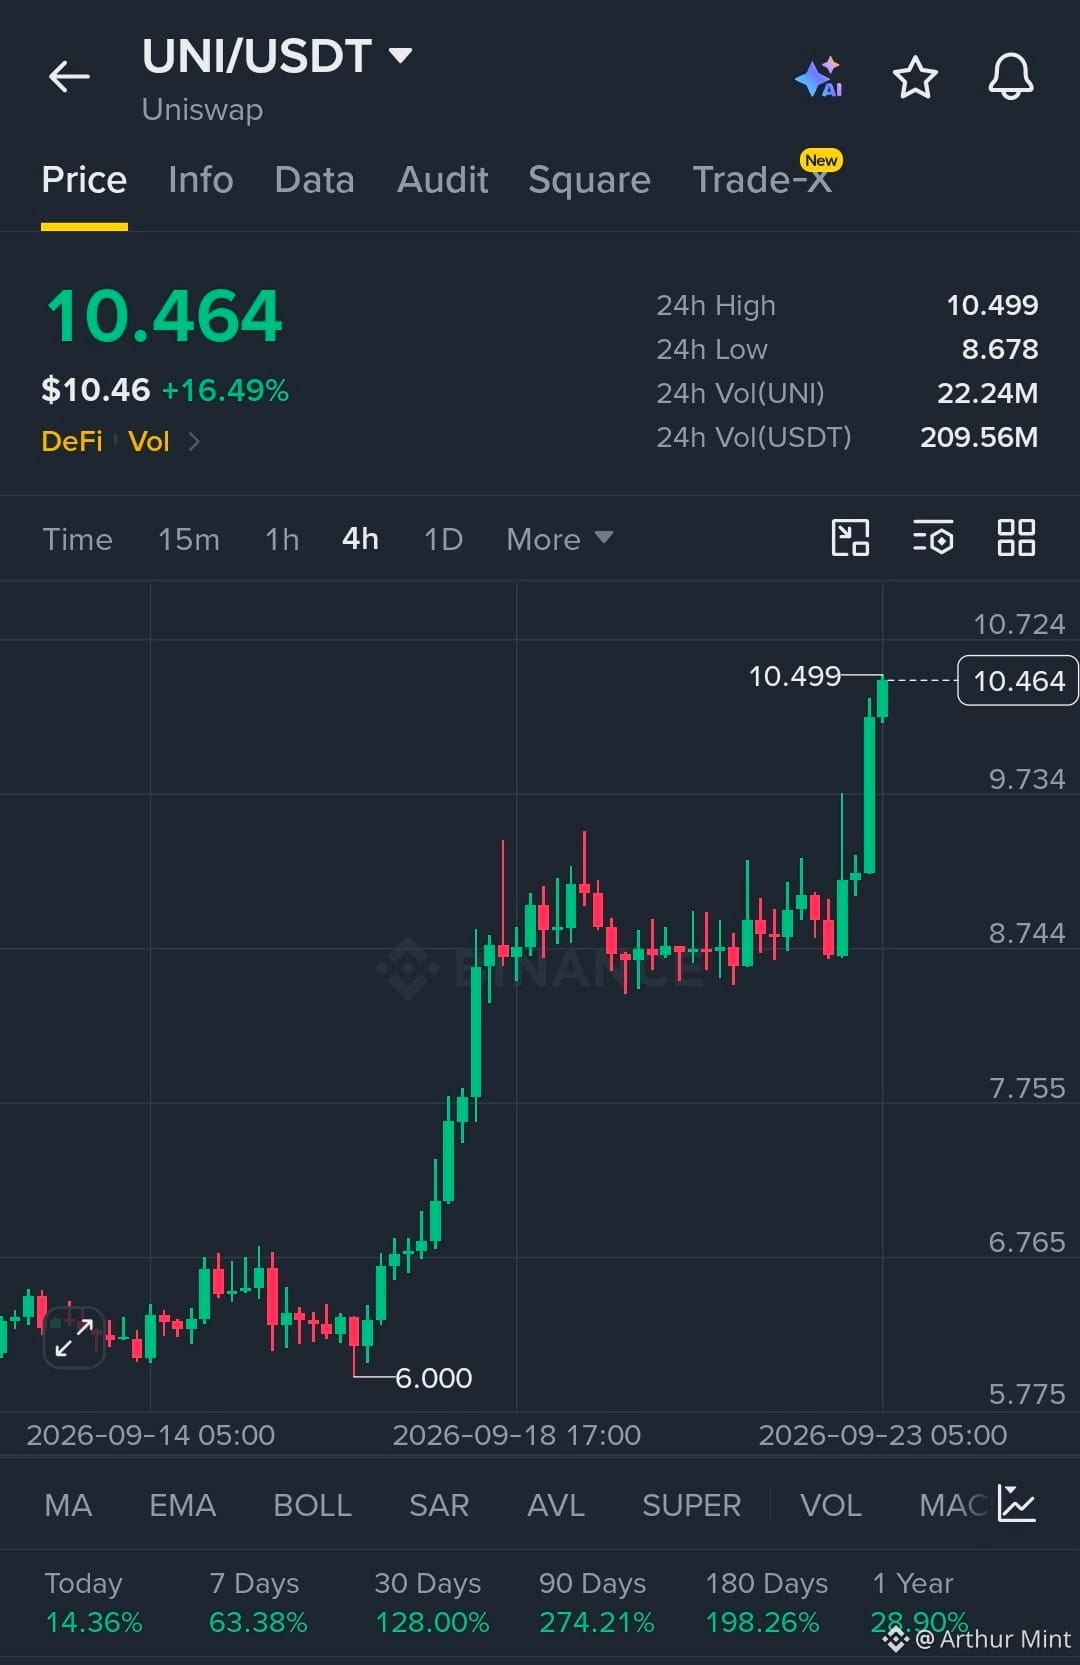
$UNI is showing strong bullish momentum with a clean breakout toward fresh highs.
Structure remains firmly controlled by buyers above the breakout zone.
EP
10.20–10.45
TP
TP1 10.72
TP2 11.20
TP3 11.80
SL
9.73
Liquidity has been swept above the prior range, and price is holding the breakout with strong reaction. As long as UNI maintains the 9.73–10.20 structure, continuation remains technically supported.
Let’s go $UNI
$UNI is showing strong bullish momentum with a clean breakout toward fresh highs.
Structure remains firmly controlled by buyers above the breakout zone.
EP
10.20–10.45
TP
TP1 10.72
TP2 11.20
TP3 11.80
SL
9.73
Liquidity has been swept above the prior range, and price is holding the breakout with strong reaction. As long as UNI maintains the 9.73–10.20 structure, continuation remains technically supported.
Let’s go $UNI
Structure remains firmly controlled by buyers above the breakout zone.
EP
10.20–10.45
TP
TP1 10.72
TP2 11.20
TP3 11.80
SL
9.73
Liquidity has been swept above the prior range, and price is holding the breakout with strong reaction. As long as UNI maintains the 9.73–10.20 structure, continuation remains technically supported.
Let’s go $UNI
485
·
--
Жоғары (өспелі)
BTC MOMENTUM SIGNAL FLASHES BULLISH AGAIN
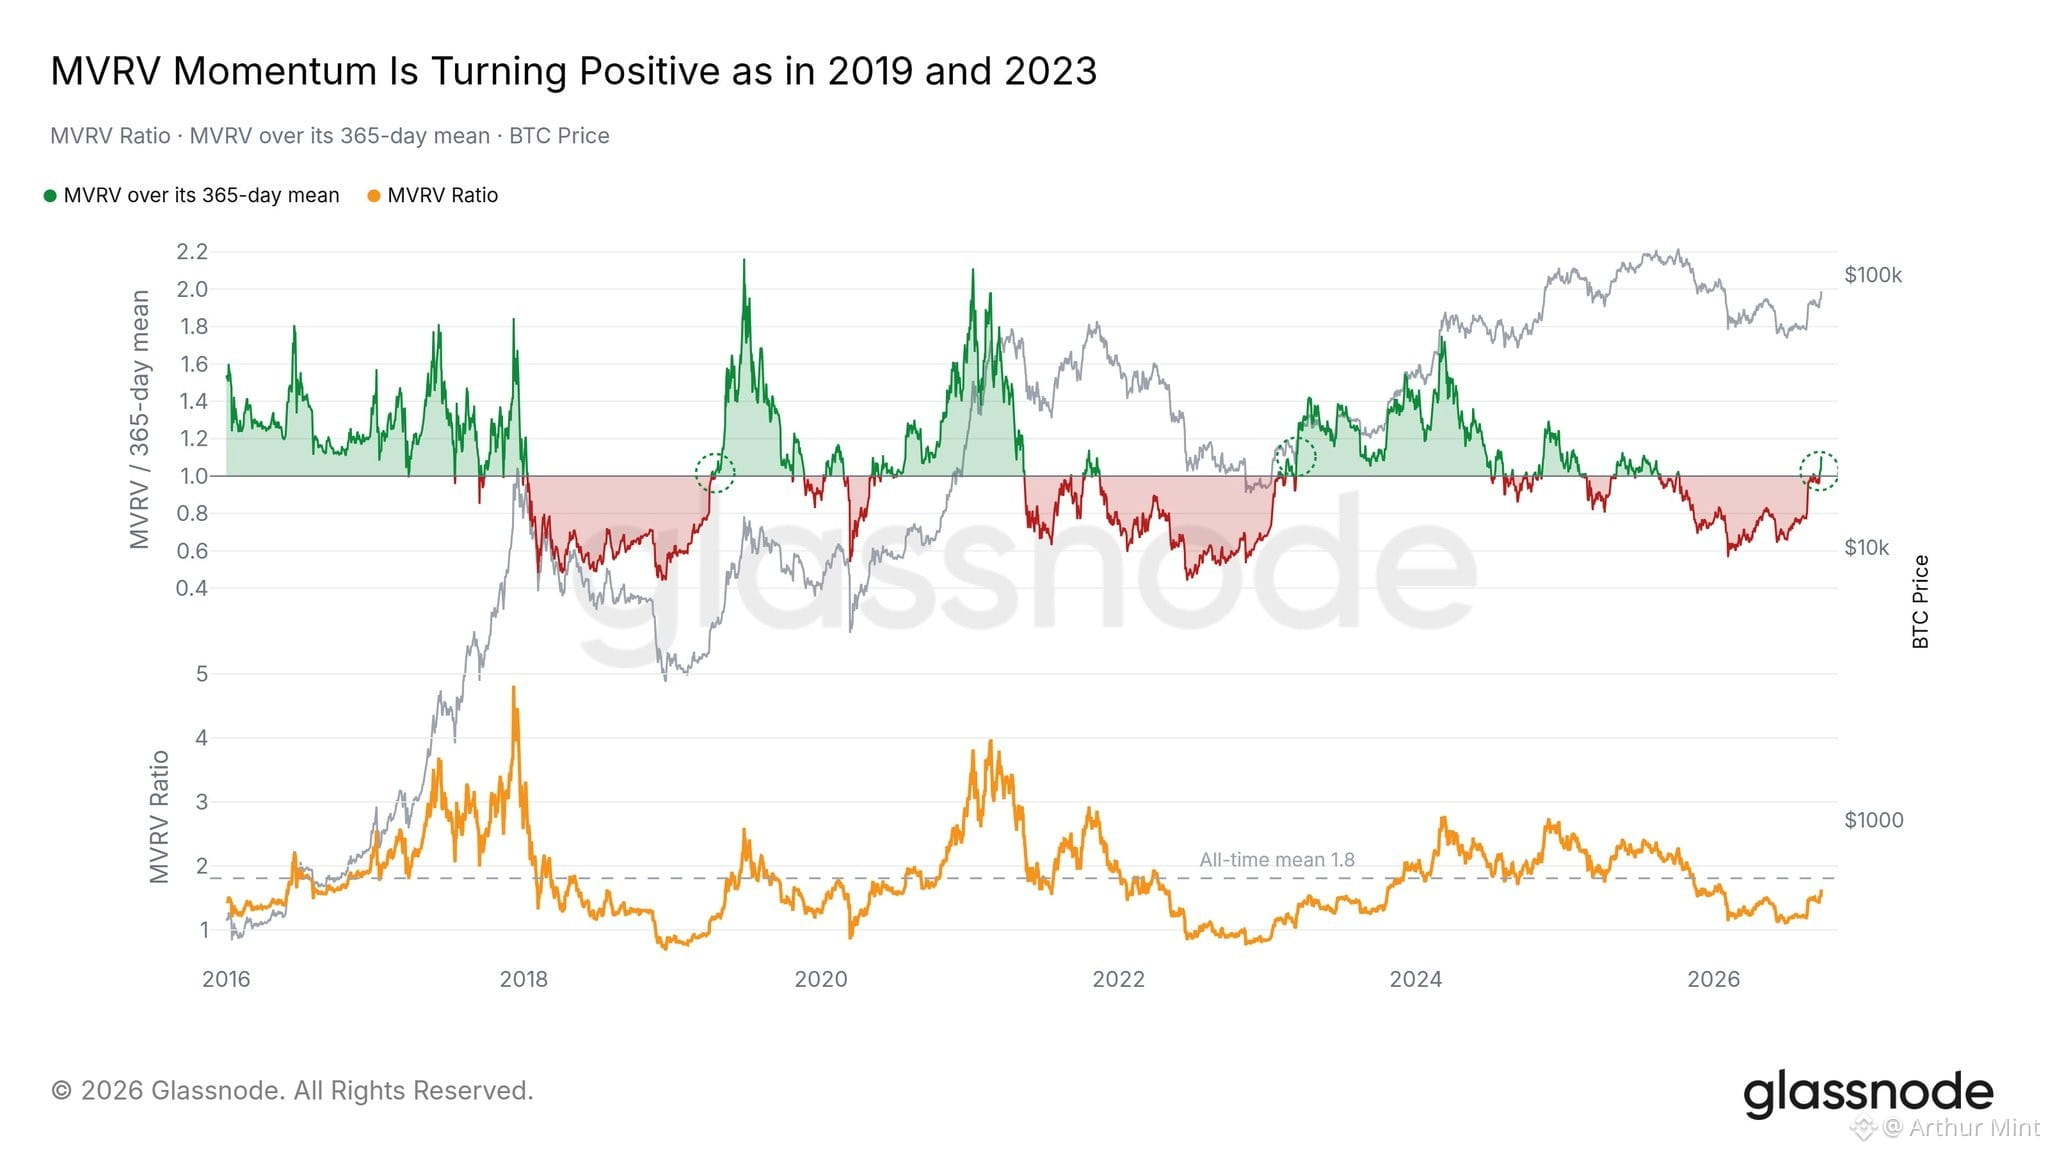
Bitcoin’s MVRV has moved back above its 365-day average, a momentum shift clearly highlighted on the chart.
Notably, the same crossover appeared in 2019 and 2023, near the beginning of major $BTC bull markets.
That makes the current setup worth watching closely, as momentum may be turning positive again across crypto.
Still, this signal is not a guarantee of future gains.
Is Bitcoin entering another major momentum phase?
BTC MOMENTUM SIGNAL FLASHES BULLISH AGAIN
Bitcoin’s MVRV has moved back above its 365-day average, a momentum shift clearly highlighted on the chart.
Notably, the same crossover appeared in 2019 and 2023, near the beginning of major $BTC bull markets.
That makes the current setup worth watching closely, as momentum may be turning positive again across crypto.
Still, this signal is not a guarantee of future gains.
Is Bitcoin entering another major momentum phase?
Bitcoin’s MVRV has moved back above its 365-day average, a momentum shift clearly highlighted on the chart.
Notably, the same crossover appeared in 2019 and 2023, near the beginning of major $BTC bull markets.
That makes the current setup worth watching closely, as momentum may be turning positive again across crypto.
Still, this signal is not a guarantee of future gains.
Is Bitcoin entering another major momentum phase?
286
·
--
Жоғары (өспелі)
Расталды
AI STOCKS ARE RISING — BUT THE NEXT OPPORTUNITY MAY NOT BE ANOTHER AI STOCK.
The AI rally is no longer just a semiconductor story.
Nvidia’s latest outlook points to another major leg of AI infrastructure demand. The company expects roughly 70% revenue growth for its next fiscal year, while its data-center business generated $89B in the latest quarter. Gartner estimates global AI spending could reach $2.7T in 2026, up 49.5% YoY.
So the bigger question is:
Where does the money go after the obvious AI winners?
Every AI data center needs much more than GPUs. It needs electricity, networking, servers, storage, cooling, construction and cybersecurity.
That means the next phase of the AI trade could spread into the companies building the infrastructure underneath the models.
Power is already becoming a key pressure point. Data-center expansion is forcing markets to focus on electricity supply and grid capacity.
Cybersecurity is another area to watch. As AI agents and autonomous systems expand, so does the potential attack surface. Gartner expects AI cybersecurity spending to grow sharply through 2027.
But there is another side to the trade.
AI infrastructure requires enormous capital spending. The key question is no longer simply “Is AI demand real?”
It is:
Can AI revenues grow fast enough to justify the cost of building all this capacity?
I’m bullish on the AI theme, but selective on AI stocks.
I would watch the broader ecosystem: power and grid infrastructure, data-center equipment, networking, cybersecurity and software that can turn AI adoption into recurring revenue.
The first phase of AI rewarded the companies selling the picks and shovels.
The next phase may reward the companies building the power, roads, security and infrastructure around the AI boom.
The real question isn’t whether AI is getting bigger.
It’s who captures the economics as the AI buildout gets bigger.
#AIStocksWhatNext
AI STOCKS ARE RISING — BUT THE NEXT OPPORTUNITY MAY NOT BE ANOTHER AI STOCK.
The AI rally is no longer just a semiconductor story.
Nvidia’s latest outlook points to another major leg of AI infrastructure demand. The company expects roughly 70% revenue growth for its next fiscal year, while its data-center business generated $89B in the latest quarter. Gartner estimates global AI spending could reach $2.7T in 2026, up 49.5% YoY.
So the bigger question is:
Where does the money go after the obvious AI winners?
Every AI data center needs much more than GPUs. It needs electricity, networking, servers, storage, cooling, construction and cybersecurity.
That means the next phase of the AI trade could spread into the companies building the infrastructure underneath the models.
Power is already becoming a key pressure point. Data-center expansion is forcing markets to focus on electricity supply and grid capacity.
Cybersecurity is another area to watch. As AI agents and autonomous systems expand, so does the potential attack surface. Gartner expects AI cybersecurity spending to grow sharply through 2027.
But there is another side to the trade.
AI infrastructure requires enormous capital spending. The key question is no longer simply “Is AI demand real?”
It is:
Can AI revenues grow fast enough to justify the cost of building all this capacity?
I’m bullish on the AI theme, but selective on AI stocks.
I would watch the broader ecosystem: power and grid infrastructure, data-center equipment, networking, cybersecurity and software that can turn AI adoption into recurring revenue.
The first phase of AI rewarded the companies selling the picks and shovels.
The next phase may reward the companies building the power, roads, security and infrastructure around the AI boom.
The real question isn’t whether AI is getting bigger.
It’s who captures the economics as the AI buildout gets bigger.
#AIStocksWhatNext
The AI rally is no longer just a semiconductor story.
Nvidia’s latest outlook points to another major leg of AI infrastructure demand. The company expects roughly 70% revenue growth for its next fiscal year, while its data-center business generated $89B in the latest quarter. Gartner estimates global AI spending could reach $2.7T in 2026, up 49.5% YoY.
So the bigger question is:
Where does the money go after the obvious AI winners?
Every AI data center needs much more than GPUs. It needs electricity, networking, servers, storage, cooling, construction and cybersecurity.
That means the next phase of the AI trade could spread into the companies building the infrastructure underneath the models.
Power is already becoming a key pressure point. Data-center expansion is forcing markets to focus on electricity supply and grid capacity.
Cybersecurity is another area to watch. As AI agents and autonomous systems expand, so does the potential attack surface. Gartner expects AI cybersecurity spending to grow sharply through 2027.
But there is another side to the trade.
AI infrastructure requires enormous capital spending. The key question is no longer simply “Is AI demand real?”
It is:
Can AI revenues grow fast enough to justify the cost of building all this capacity?
I’m bullish on the AI theme, but selective on AI stocks.
I would watch the broader ecosystem: power and grid infrastructure, data-center equipment, networking, cybersecurity and software that can turn AI adoption into recurring revenue.
The first phase of AI rewarded the companies selling the picks and shovels.
The next phase may reward the companies building the power, roads, security and infrastructure around the AI boom.
The real question isn’t whether AI is getting bigger.
It’s who captures the economics as the AI buildout gets bigger.
#AIStocksWhatNext

1
569
·
--
BITCOIN BUYERS ARE STACKING BIDS BELOW $85K
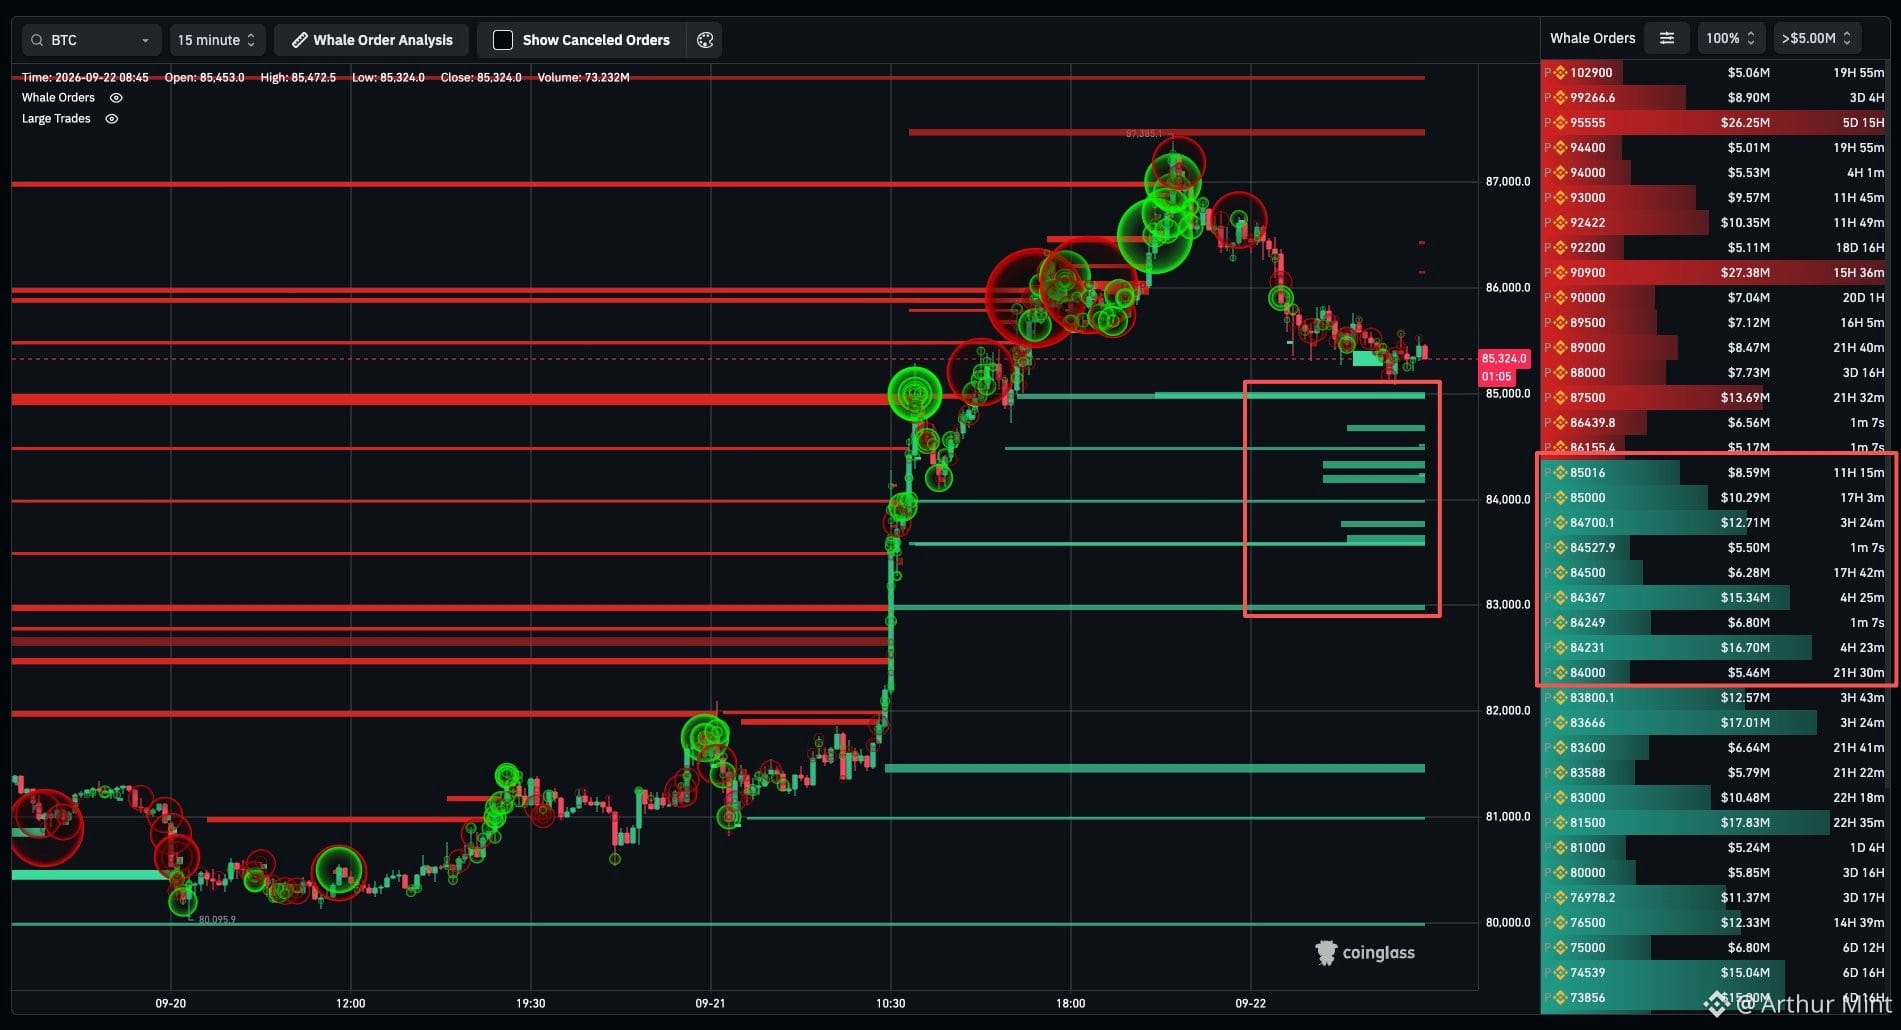
The order book shows layered green buy liquidity beneath Bitcoin’s current area, suggesting buyers are waiting lower rather than chasing the move.
Notable bid clusters sit around $84,367, $84,231, $83,666 and $81,500, with sizeable orders visible at each level.
That matters because strong bids can create potential support if selling accelerates.
Still, large orders can move or disappear before execution.
Will these bids absorb the next pullback?
BITCOIN BUYERS ARE STACKING BIDS BELOW $85K
The order book shows layered green buy liquidity beneath Bitcoin’s current area, suggesting buyers are waiting lower rather than chasing the move.
Notable bid clusters sit around $84,367, $84,231, $83,666 and $81,500, with sizeable orders visible at each level.
That matters because strong bids can create potential support if selling accelerates.
Still, large orders can move or disappear before execution.
Will these bids absorb the next pullback?
The order book shows layered green buy liquidity beneath Bitcoin’s current area, suggesting buyers are waiting lower rather than chasing the move.
Notable bid clusters sit around $84,367, $84,231, $83,666 and $81,500, with sizeable orders visible at each level.
That matters because strong bids can create potential support if selling accelerates.
Still, large orders can move or disappear before execution.
Will these bids absorb the next pullback?
2
1.3k
·
--
Жоғары (өспелі)
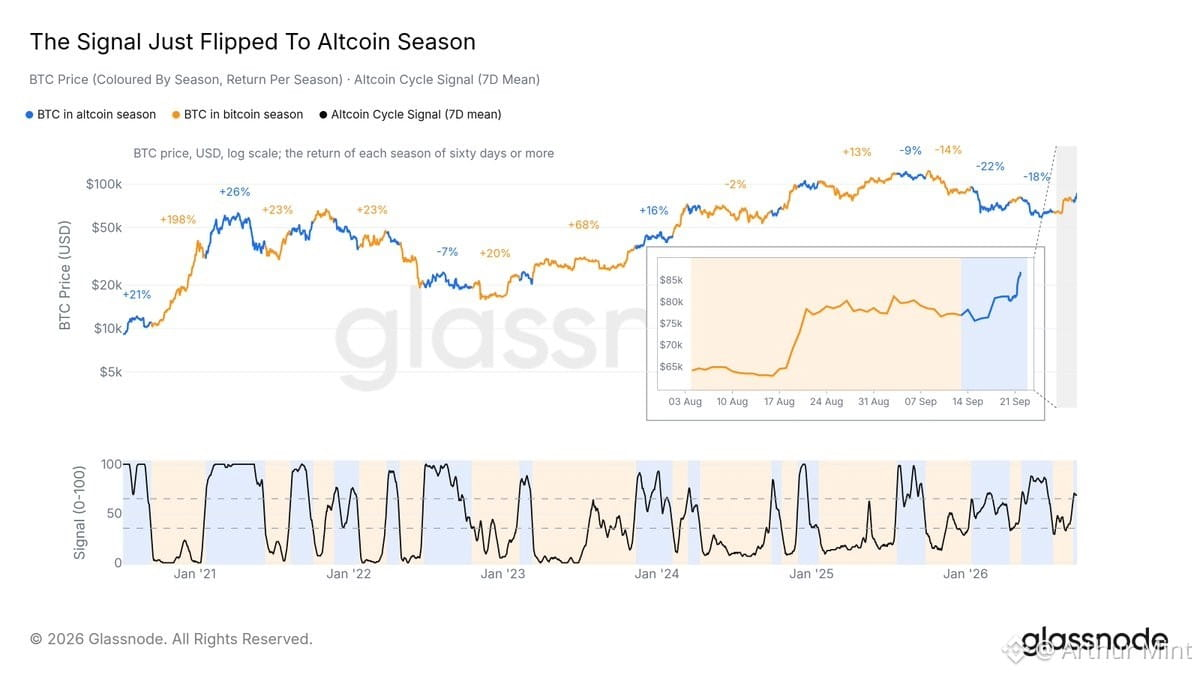
ALTCOIN SEASON SIGNAL FLIPS — MARKET BREADTH IS FINALLY WAKING UP
The latest market-cycle reading shows a clear shift from Bitcoin season toward altcoin season. After spending time favoring BTC, the signal has now moved into the zone associated with broader altcoin strength.
The earlier August rally told a different story. Bitcoin pushed higher while many altcoins remained relatively muted, showing that capital was still concentrated around $BTC rather than spreading across the market.
Today’s move looks broader. The chart indicates renewed strength across the altcoin space, suggesting market participation is expanding beyond Bitcoin and creating a more supportive backdrop for alternative crypto assets.
For Bitcoin, this does not automatically mean weakness. Historically, a widening market can mean BTC has already attracted attention and liquidity is beginning to rotate into higher-beta parts of crypto.
Still, the signal is not a guarantee that every altcoin will outperform. Momentum can reverse quickly, and continued confirmation matters.
The rotation has started — but how far can altcoin strength run?
ALTCOIN SEASON SIGNAL FLIPS — MARKET BREADTH IS FINALLY WAKING UP
The latest market-cycle reading shows a clear shift from Bitcoin season toward altcoin season. After spending time favoring BTC, the signal has now moved into the zone associated with broader altcoin strength.
The earlier August rally told a different story. Bitcoin pushed higher while many altcoins remained relatively muted, showing that capital was still concentrated around $BTC rather than spreading across the market.
Today’s move looks broader. The chart indicates renewed strength across the altcoin space, suggesting market participation is expanding beyond Bitcoin and creating a more supportive backdrop for alternative crypto assets.
For Bitcoin, this does not automatically mean weakness. Historically, a widening market can mean BTC has already attracted attention and liquidity is beginning to rotate into higher-beta parts of crypto.
Still, the signal is not a guarantee that every altcoin will outperform. Momentum can reverse quickly, and continued confirmation matters.
The rotation has started — but how far can altcoin strength run?
The latest market-cycle reading shows a clear shift from Bitcoin season toward altcoin season. After spending time favoring BTC, the signal has now moved into the zone associated with broader altcoin strength.
The earlier August rally told a different story. Bitcoin pushed higher while many altcoins remained relatively muted, showing that capital was still concentrated around $BTC rather than spreading across the market.
Today’s move looks broader. The chart indicates renewed strength across the altcoin space, suggesting market participation is expanding beyond Bitcoin and creating a more supportive backdrop for alternative crypto assets.
For Bitcoin, this does not automatically mean weakness. Historically, a widening market can mean BTC has already attracted attention and liquidity is beginning to rotate into higher-beta parts of crypto.
Still, the signal is not a guarantee that every altcoin will outperform. Momentum can reverse quickly, and continued confirmation matters.
The rotation has started — but how far can altcoin strength run?
396
·
--
Жоғары (өспелі)
BitMine buys $75 million of $ETH as Tom Lee calls for a major Q4 market rally.
Tom Lee’s BitMine has added $75 million worth of Ethereum. Lee says Q4 starts “one of the biggest market rallies of our lifetime.”
The move puts a fresh spotlight on institutional-sized ETH buying as the fourth quarter approaches.
For now, the key development is the scale of BitMine’s purchase and Lee’s bullish Q4 outlook. ETH remains firmly in focus.
BitMine buys $75 million of $ETH as Tom Lee calls for a major Q4 market rally.
Tom Lee’s BitMine has added $75 million worth of Ethereum. Lee says Q4 starts “one of the biggest market rallies of our lifetime.”
The move puts a fresh spotlight on institutional-sized ETH buying as the fourth quarter approaches.
For now, the key development is the scale of BitMine’s purchase and Lee’s bullish Q4 outlook. ETH remains firmly in focus.
Tom Lee’s BitMine has added $75 million worth of Ethereum. Lee says Q4 starts “one of the biggest market rallies of our lifetime.”
The move puts a fresh spotlight on institutional-sized ETH buying as the fourth quarter approaches.
For now, the key development is the scale of BitMine’s purchase and Lee’s bullish Q4 outlook. ETH remains firmly in focus.

1
1
389
·
--
Жоғары (өспелі)
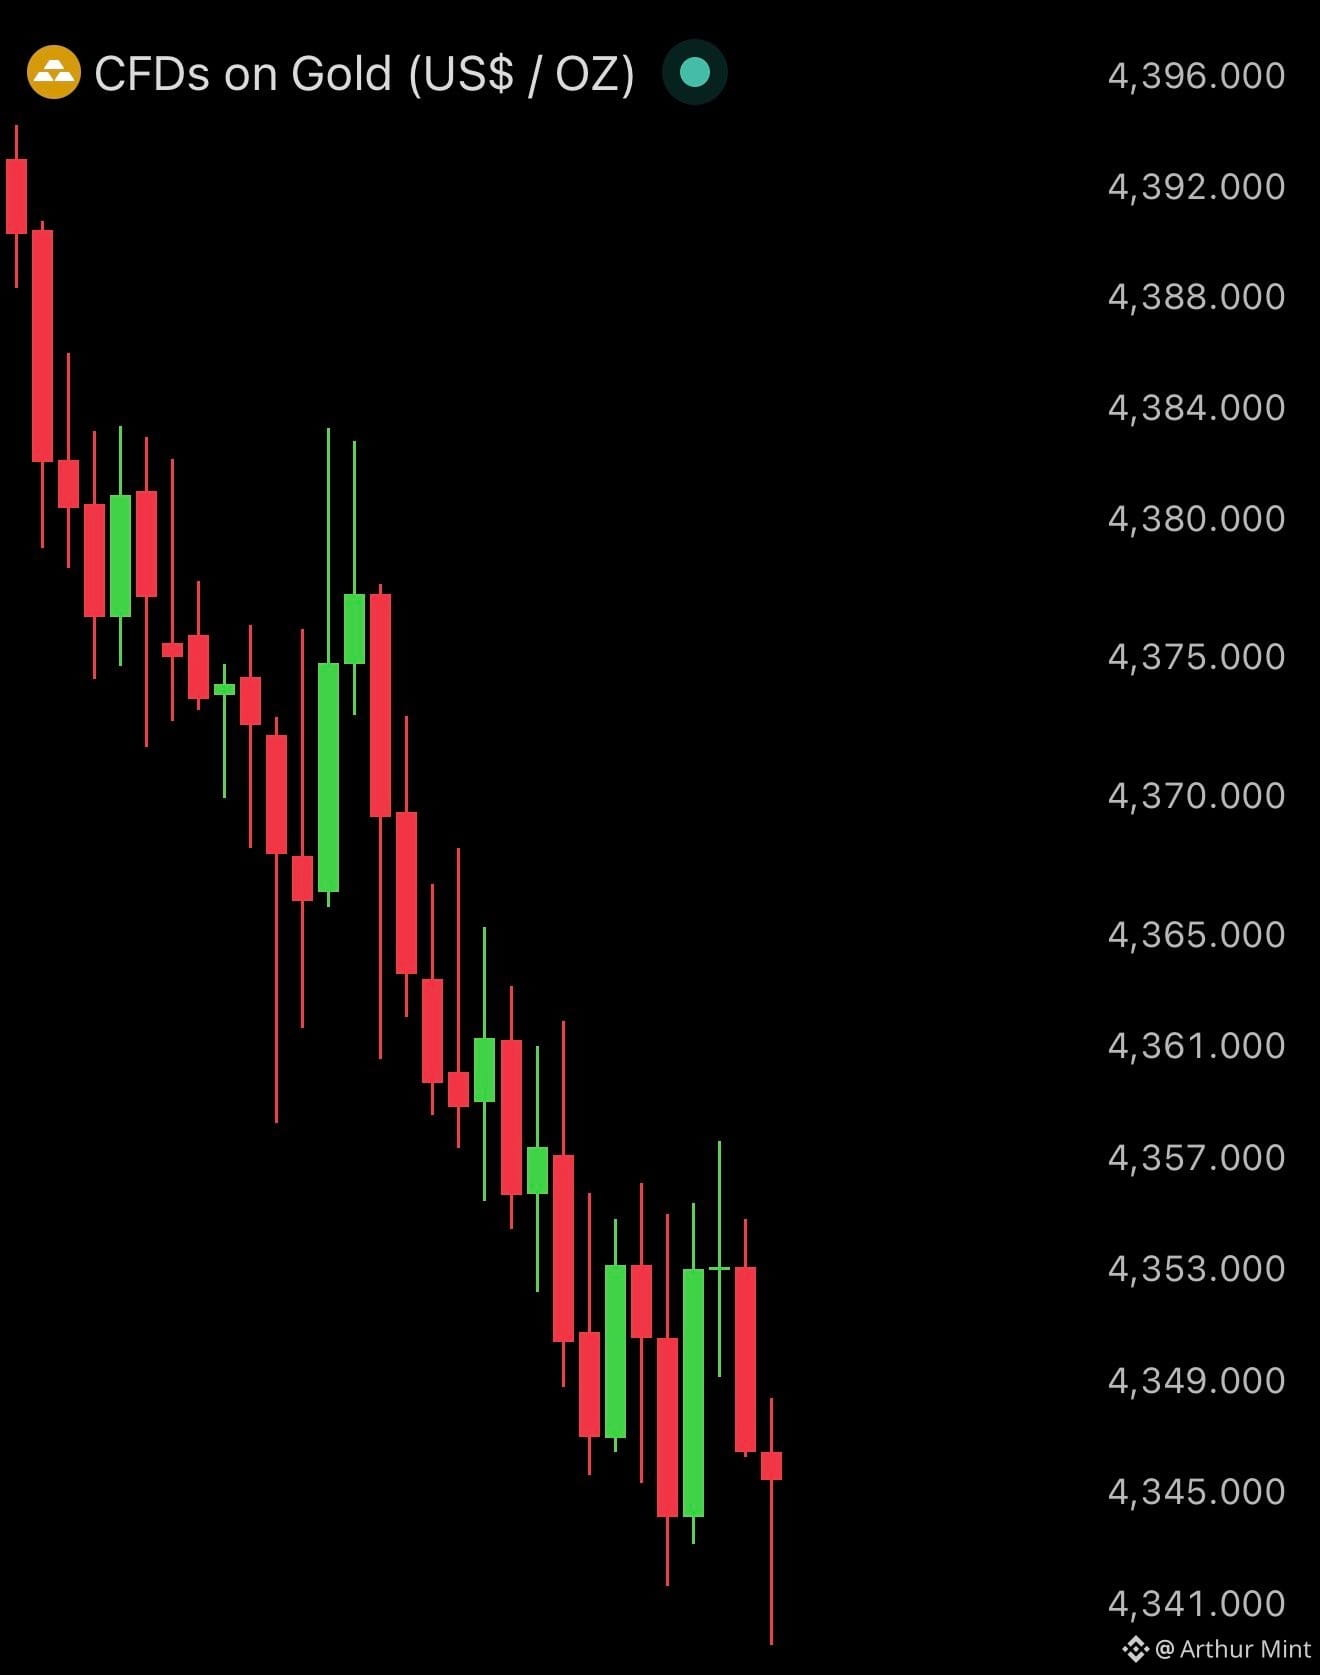
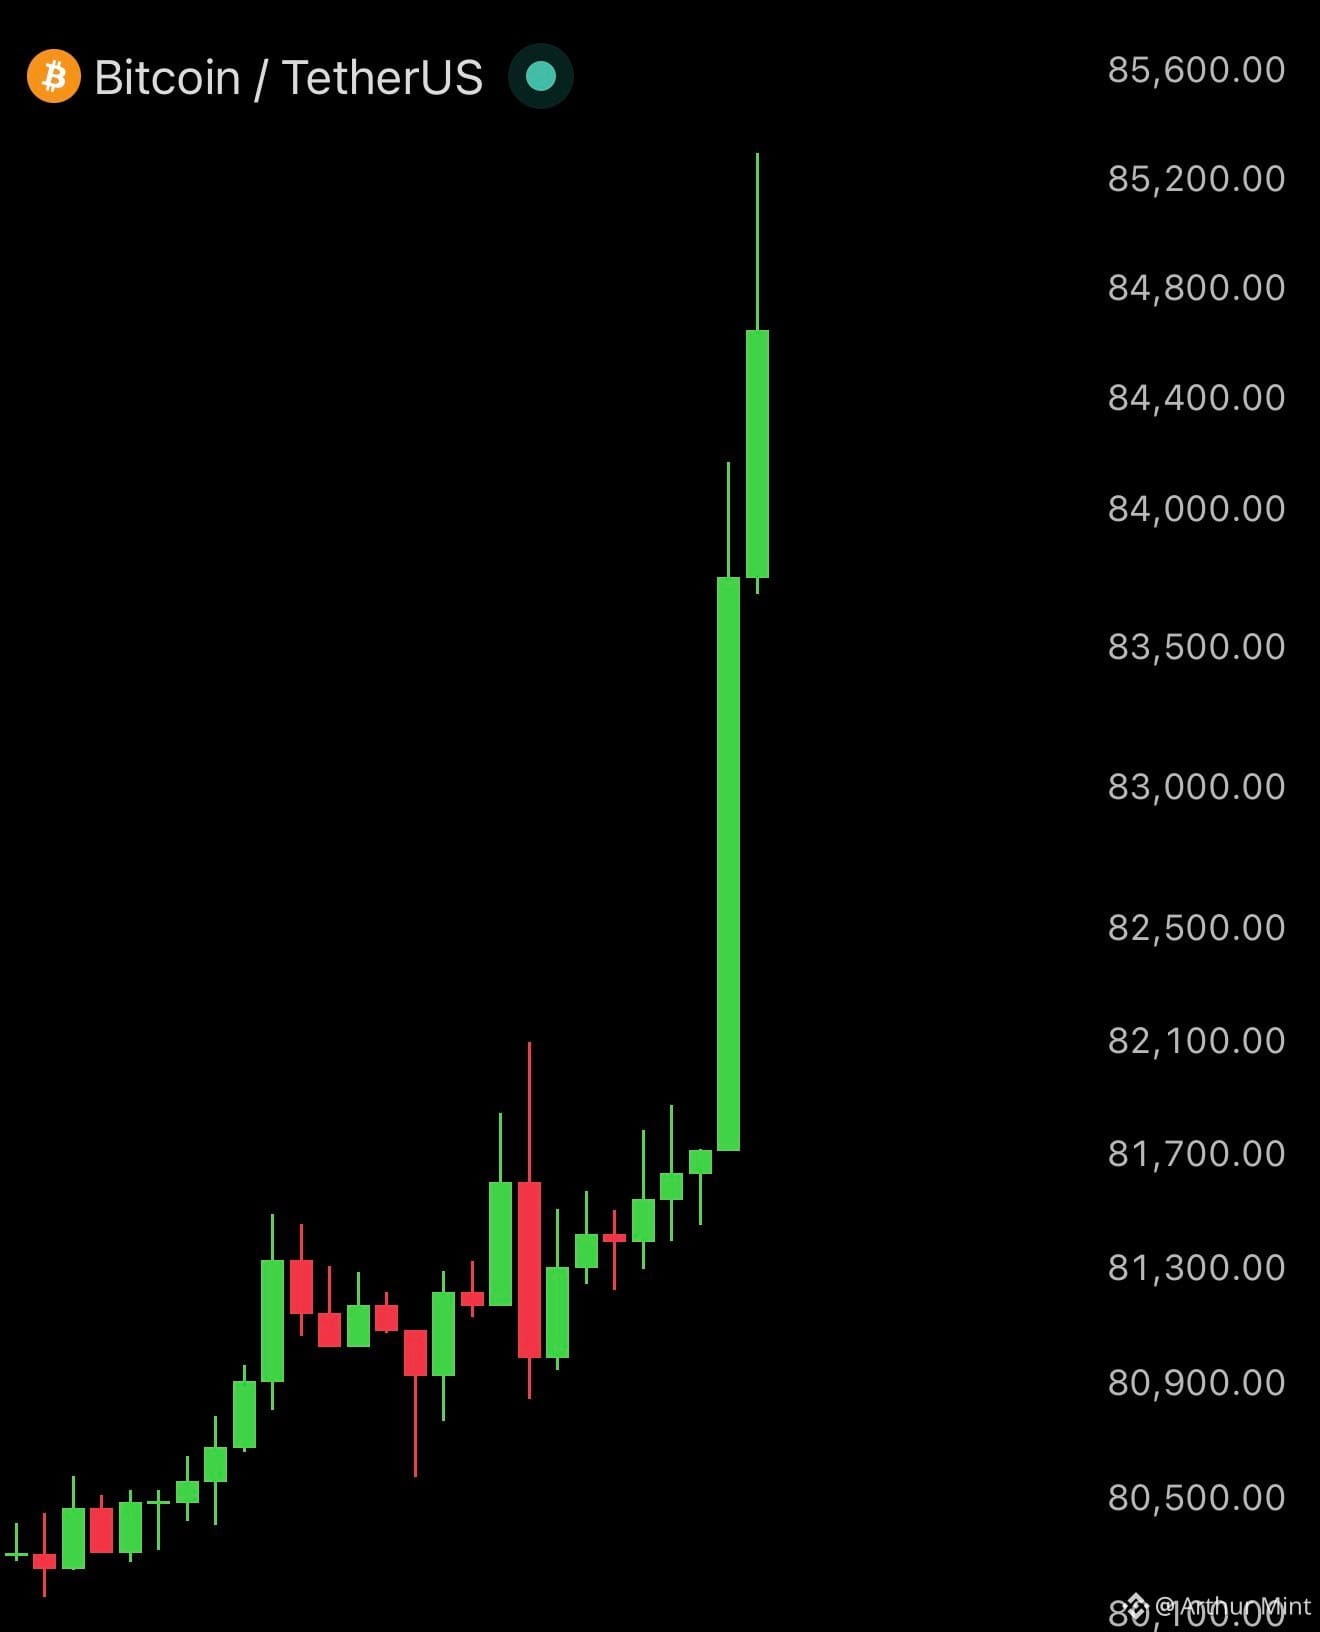
Markets are sending a sharp signal: Gold is sliding while Bitcoin is climbing.
The split is hard to ignore, putting crypto and the traditional safe-haven trade in opposite directions.
Now the big question is whether this divergence lasts.
Markets are sending a sharp signal: Gold is sliding while Bitcoin is climbing.
The split is hard to ignore, putting crypto and the traditional safe-haven trade in opposite directions.
Now the big question is whether this divergence lasts.
The split is hard to ignore, putting crypto and the traditional safe-haven trade in opposite directions.
Now the big question is whether this divergence lasts.
384
·
--
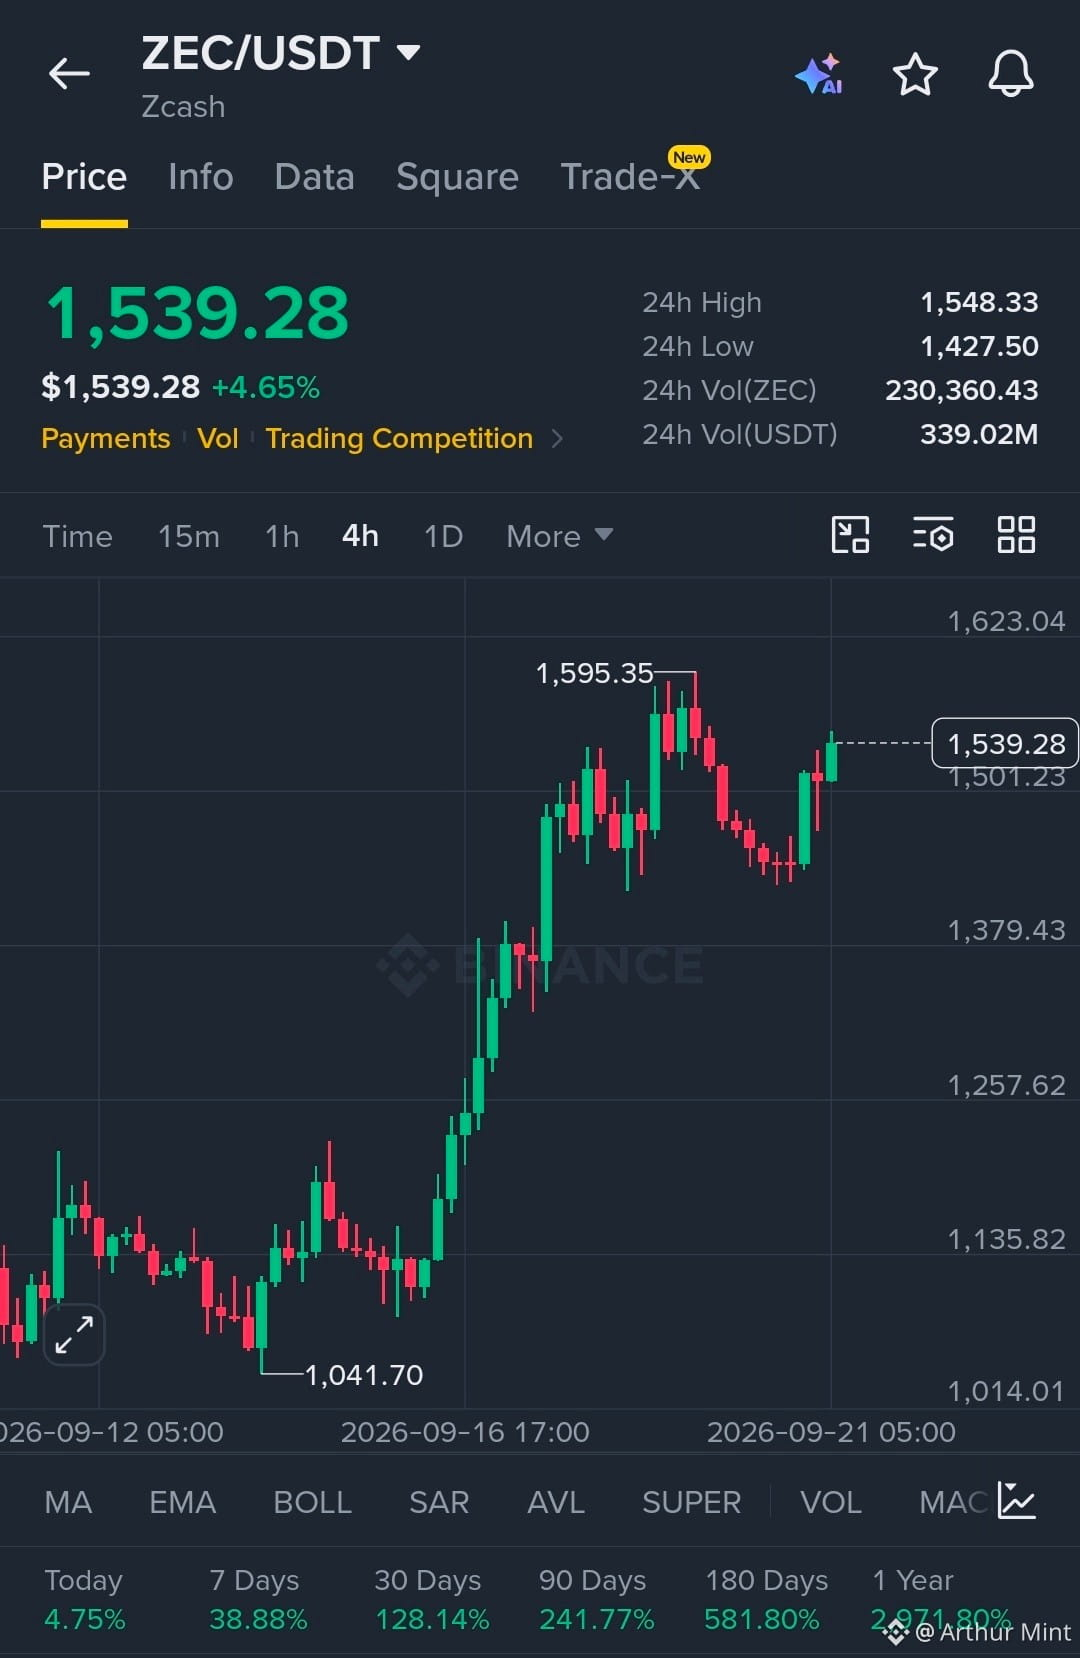
$ZEC is showing strong momentum with buyers firmly in control.
Structure remains bullish with price holding above the breakout zone.
EP
1,510 - 1,540
TP
TP1 1,595
TP2 1,650
TP3 1,720
SL
1,460
Liquidity is building above the 1,595 high, while price continues to hold the 1,501 support area. A clean reaction from this zone keeps the bullish continuation structure intact, with 1,595 as the first liquidity target.
Let’s go $ZEC
$ZEC is showing strong momentum with buyers firmly in control.
Structure remains bullish with price holding above the breakout zone.
EP
1,510 - 1,540
TP
TP1 1,595
TP2 1,650
TP3 1,720
SL
1,460
Liquidity is building above the 1,595 high, while price continues to hold the 1,501 support area. A clean reaction from this zone keeps the bullish continuation structure intact, with 1,595 as the first liquidity target.
Let’s go $ZEC
Structure remains bullish with price holding above the breakout zone.
EP
1,510 - 1,540
TP
TP1 1,595
TP2 1,650
TP3 1,720
SL
1,460
Liquidity is building above the 1,595 high, while price continues to hold the 1,501 support area. A clean reaction from this zone keeps the bullish continuation structure intact, with 1,595 as the first liquidity target.
Let’s go $ZEC
354
·
--
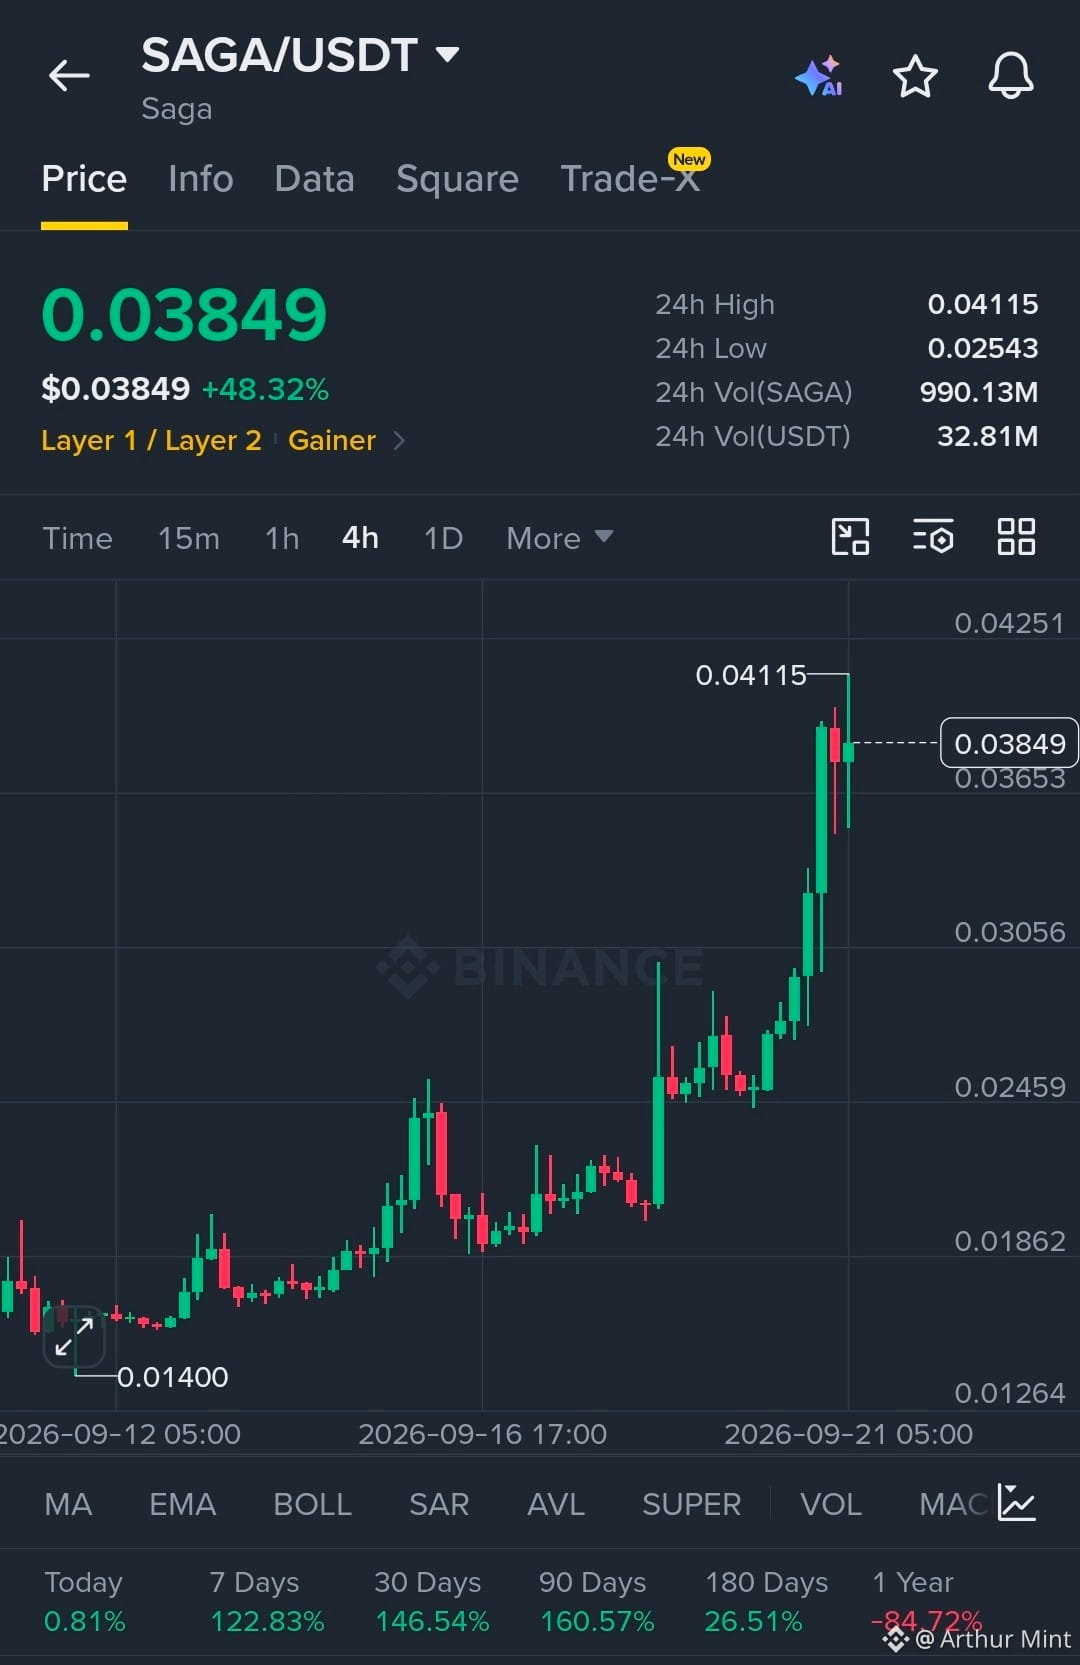
$SAGA is showing strong momentum with buyers firmly in control.
Structure remains bullish with price holding above the breakout zone.
EP
0.0370 - 0.0385
TP
TP1 0.0425
TP2 0.0460
TP3 0.0500
SL
0.0345
Liquidity has been swept above the previous high, while price continues to hold the breakout structure. A clean reaction around the 0.0370 area keeps the bullish continuation setup intact, with 0.0425 as the first liquidity target.
Let’s go $SAGA
$SAGA is showing strong momentum with buyers firmly in control.
Structure remains bullish with price holding above the breakout zone.
EP
0.0370 - 0.0385
TP
TP1 0.0425
TP2 0.0460
TP3 0.0500
SL
0.0345
Liquidity has been swept above the previous high, while price continues to hold the breakout structure. A clean reaction around the 0.0370 area keeps the bullish continuation setup intact, with 0.0425 as the first liquidity target.
Let’s go $SAGA
Structure remains bullish with price holding above the breakout zone.
EP
0.0370 - 0.0385
TP
TP1 0.0425
TP2 0.0460
TP3 0.0500
SL
0.0345
Liquidity has been swept above the previous high, while price continues to hold the breakout structure. A clean reaction around the 0.0370 area keeps the bullish continuation setup intact, with 0.0425 as the first liquidity target.
Let’s go $SAGA
263
·
--
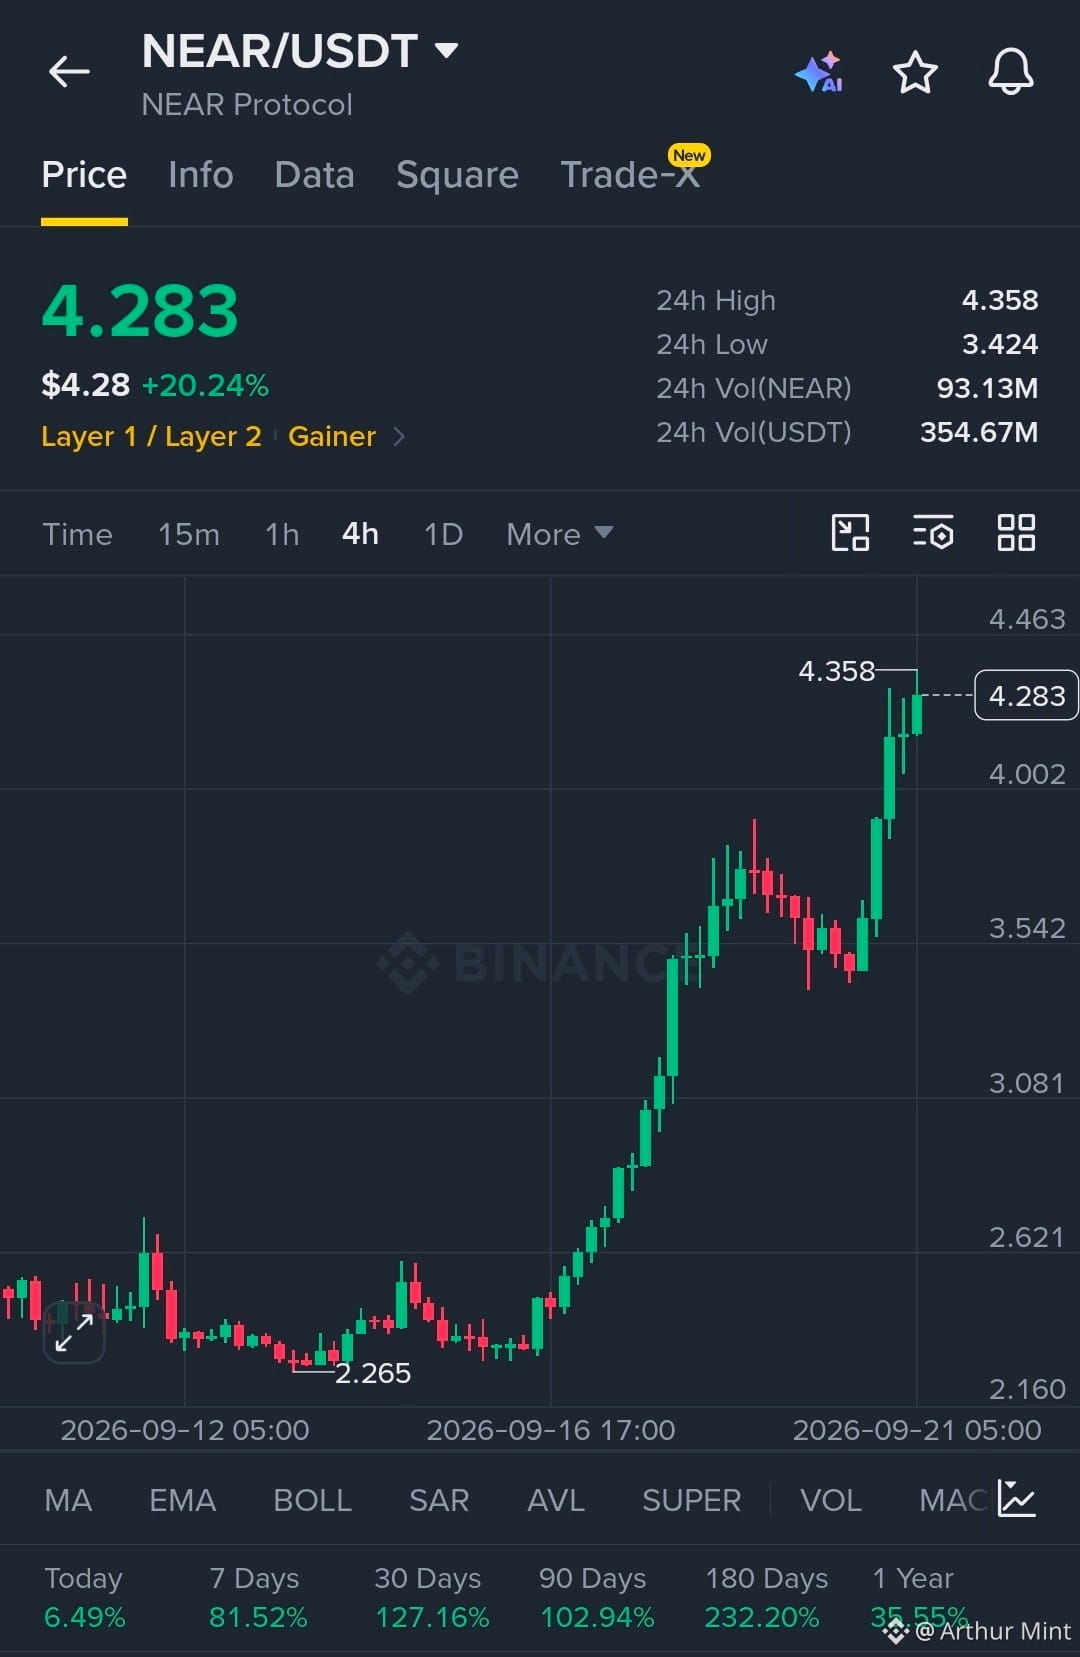
$NEAR is showing strong momentum with buyers firmly in control.
Structure remains bullish with price holding above the breakout zone.
EP
4.20 - 4.28
TP
TP1 4.45
TP2 4.65
TP3 4.90
SL
3.98
Liquidity has been swept above the previous highs, while price continues to hold the breakout structure. A clean reaction around the 4.20 area keeps the bullish continuation setup intact, with 4.45 as the first liquidity target.
Let’s go $NEAR
$NEAR is showing strong momentum with buyers firmly in control.
Structure remains bullish with price holding above the breakout zone.
EP
4.20 - 4.28
TP
TP1 4.45
TP2 4.65
TP3 4.90
SL
3.98
Liquidity has been swept above the previous highs, while price continues to hold the breakout structure. A clean reaction around the 4.20 area keeps the bullish continuation setup intact, with 4.45 as the first liquidity target.
Let’s go $NEAR
Structure remains bullish with price holding above the breakout zone.
EP
4.20 - 4.28
TP
TP1 4.45
TP2 4.65
TP3 4.90
SL
3.98
Liquidity has been swept above the previous highs, while price continues to hold the breakout structure. A clean reaction around the 4.20 area keeps the bullish continuation setup intact, with 4.45 as the first liquidity target.
Let’s go $NEAR
337
·
--
Жоғары (өспелі)
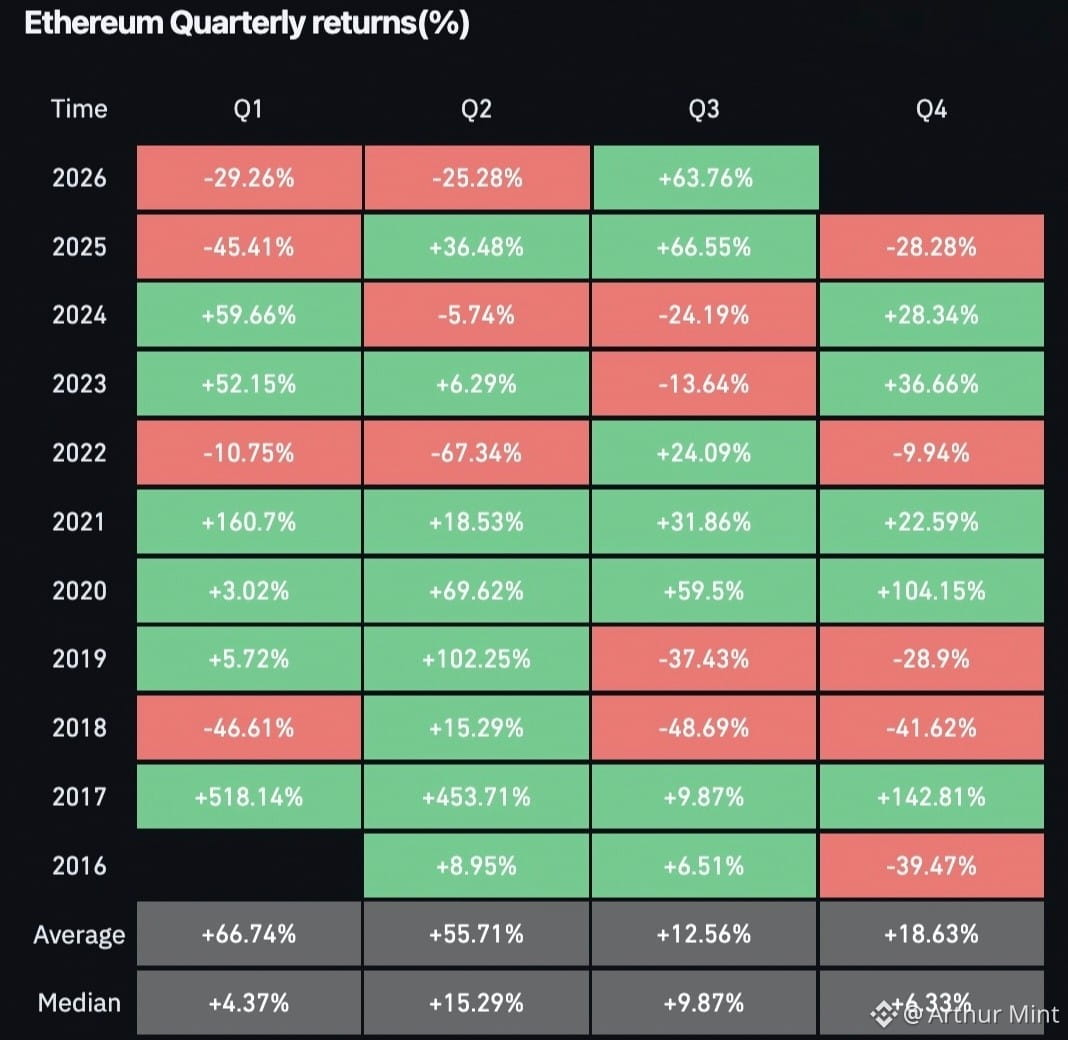
ETH JUST POSTED ITS 2ND-STRONGEST Q3 EVER — AND THE MOMENTUM IS HARD TO IGNORE
Ethereum is currently showing a +63.76% return for Q3 2026, putting this quarter in second place among the Q3 performances shown, just behind Q3 2025 at +66.55%.
That is a significant shift in momentum. After Q1 and Q2 declines of -29.26% and -25.28%, $ETH has delivered a powerful rebound, showing how quickly market sentiment can change within a few months.
For Bitcoin and the wider crypto market, this kind of strength in ETH suggests that upside momentum is still capable of returning aggressively after periods of weakness. It also puts renewed focus on whether that momentum can carry into the next quarter.
But there is one important caution: strong Q3 performance does not guarantee a strong Q4. In 2025, ETH gained 66.55% in Q3, only to fall 28.28% in Q4.
The momentum is impressive — but can Ethereum turn this Q3 strength into another breakout quarter?
ETH JUST POSTED ITS 2ND-STRONGEST Q3 EVER — AND THE MOMENTUM IS HARD TO IGNORE
Ethereum is currently showing a +63.76% return for Q3 2026, putting this quarter in second place among the Q3 performances shown, just behind Q3 2025 at +66.55%.
That is a significant shift in momentum. After Q1 and Q2 declines of -29.26% and -25.28%, $ETH has delivered a powerful rebound, showing how quickly market sentiment can change within a few months.
For Bitcoin and the wider crypto market, this kind of strength in ETH suggests that upside momentum is still capable of returning aggressively after periods of weakness. It also puts renewed focus on whether that momentum can carry into the next quarter.
But there is one important caution: strong Q3 performance does not guarantee a strong Q4. In 2025, ETH gained 66.55% in Q3, only to fall 28.28% in Q4.
The momentum is impressive — but can Ethereum turn this Q3 strength into another breakout quarter?
Ethereum is currently showing a +63.76% return for Q3 2026, putting this quarter in second place among the Q3 performances shown, just behind Q3 2025 at +66.55%.
That is a significant shift in momentum. After Q1 and Q2 declines of -29.26% and -25.28%, $ETH has delivered a powerful rebound, showing how quickly market sentiment can change within a few months.
For Bitcoin and the wider crypto market, this kind of strength in ETH suggests that upside momentum is still capable of returning aggressively after periods of weakness. It also puts renewed focus on whether that momentum can carry into the next quarter.
But there is one important caution: strong Q3 performance does not guarantee a strong Q4. In 2025, ETH gained 66.55% in Q3, only to fall 28.28% in Q4.
The momentum is impressive — but can Ethereum turn this Q3 strength into another breakout quarter?
1
357
·
--
Жоғары (өспелі)
BITCOIN’S ACCUMULATION SIGNAL REMAINS STRONG
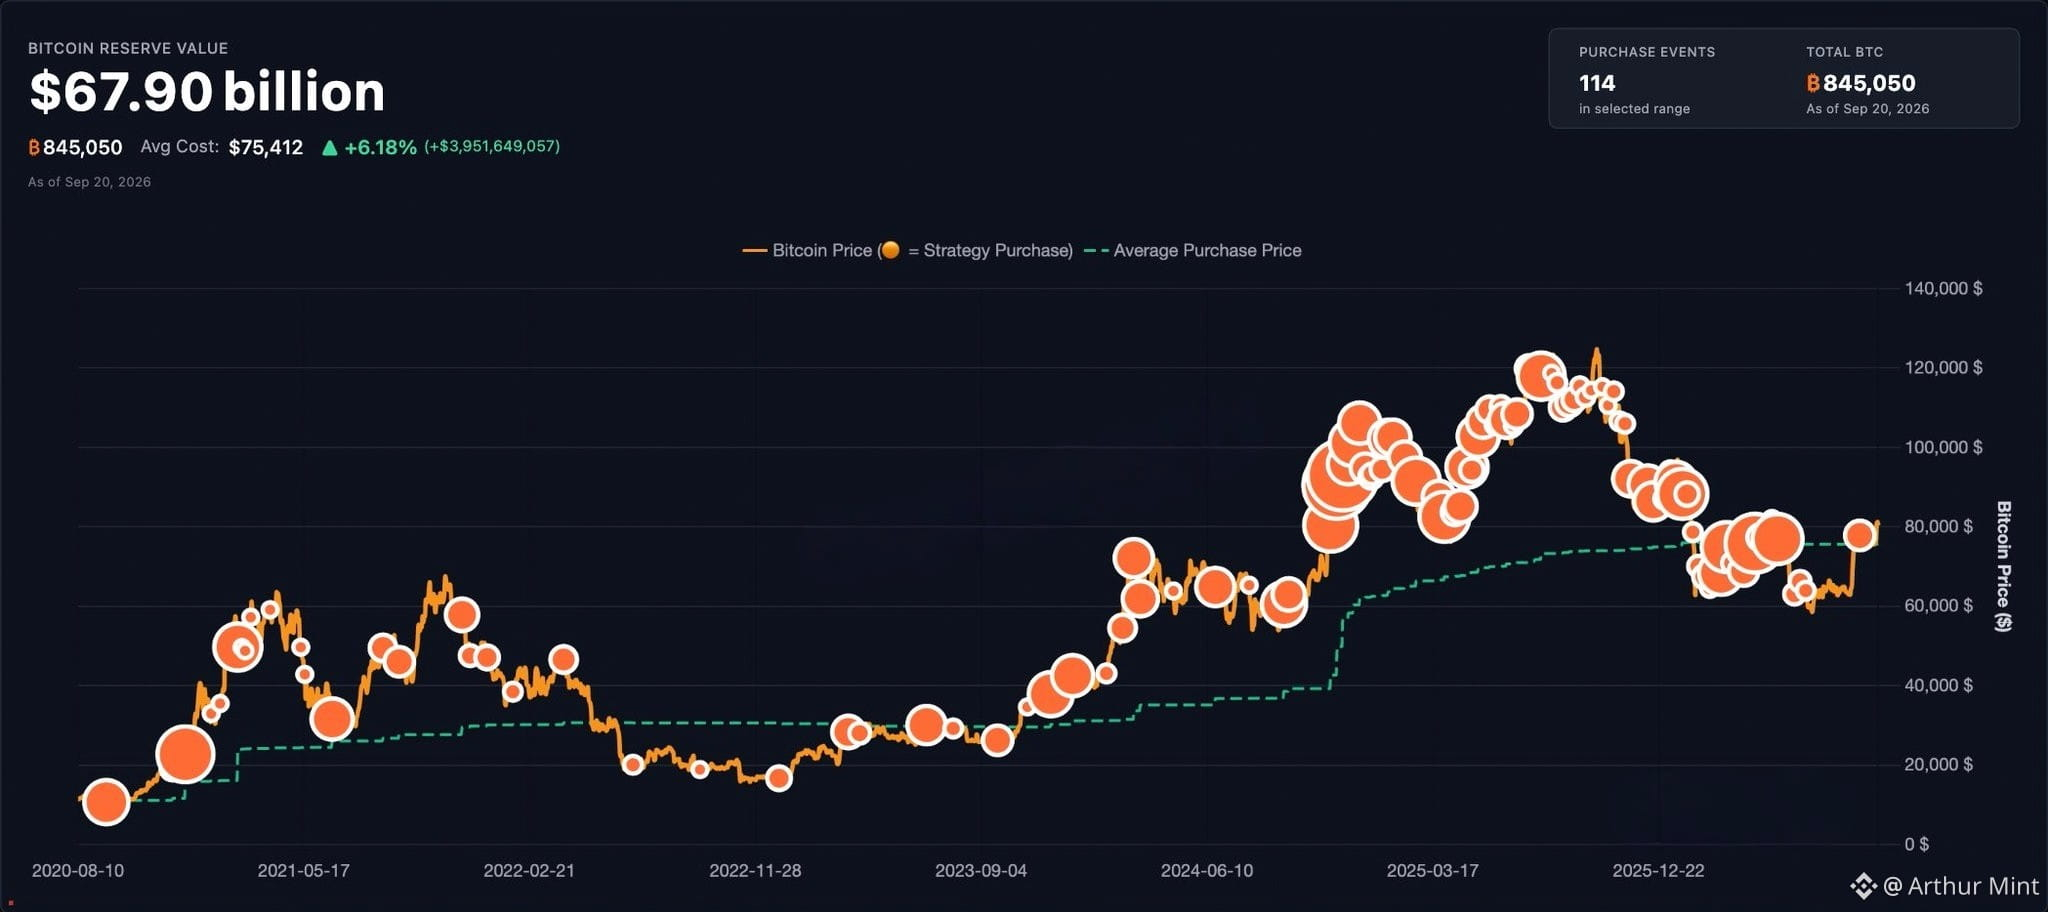
Bitcoin’s reserve value stands at $67.90B, with 845,050 BTC across 114 purchases.
The $75,412 average cost and +6.18% gain highlight sustained accumulation, while recent price movement keeps momentum alive—though volatility could still trigger sharp pullbacks. Bulls watching?
BITCOIN’S ACCUMULATION SIGNAL REMAINS STRONG
Bitcoin’s reserve value stands at $67.90B, with 845,050 BTC across 114 purchases.
The $75,412 average cost and +6.18% gain highlight sustained accumulation, while recent price movement keeps momentum alive—though volatility could still trigger sharp pullbacks. Bulls watching?
Bitcoin’s reserve value stands at $67.90B, with 845,050 BTC across 114 purchases.
The $75,412 average cost and +6.18% gain highlight sustained accumulation, while recent price movement keeps momentum alive—though volatility could still trigger sharp pullbacks. Bulls watching?
1
146
·
--
Жоғары (өспелі)
Bitcoin at $150,000. Ethereum at $10,000.
The major crypto price targets are being projected for the 2027–2029 period, putting the next few years firmly in focus for traders and investors.
Why it matters: these targets point to expectations of significant upside for both of the market’s biggest assets.
Market takeaway: 2027–2029 could become a defining window for Bitcoin and Ethereum price expectations.
Bitcoin at $150,000. Ethereum at $10,000.
The major crypto price targets are being projected for the 2027–2029 period, putting the next few years firmly in focus for traders and investors.
Why it matters: these targets point to expectations of significant upside for both of the market’s biggest assets.
Market takeaway: 2027–2029 could become a defining window for Bitcoin and Ethereum price expectations.
The major crypto price targets are being projected for the 2027–2029 period, putting the next few years firmly in focus for traders and investors.
Why it matters: these targets point to expectations of significant upside for both of the market’s biggest assets.
Market takeaway: 2027–2029 could become a defining window for Bitcoin and Ethereum price expectations.
1
565
·
--
Жоғары (өспелі)
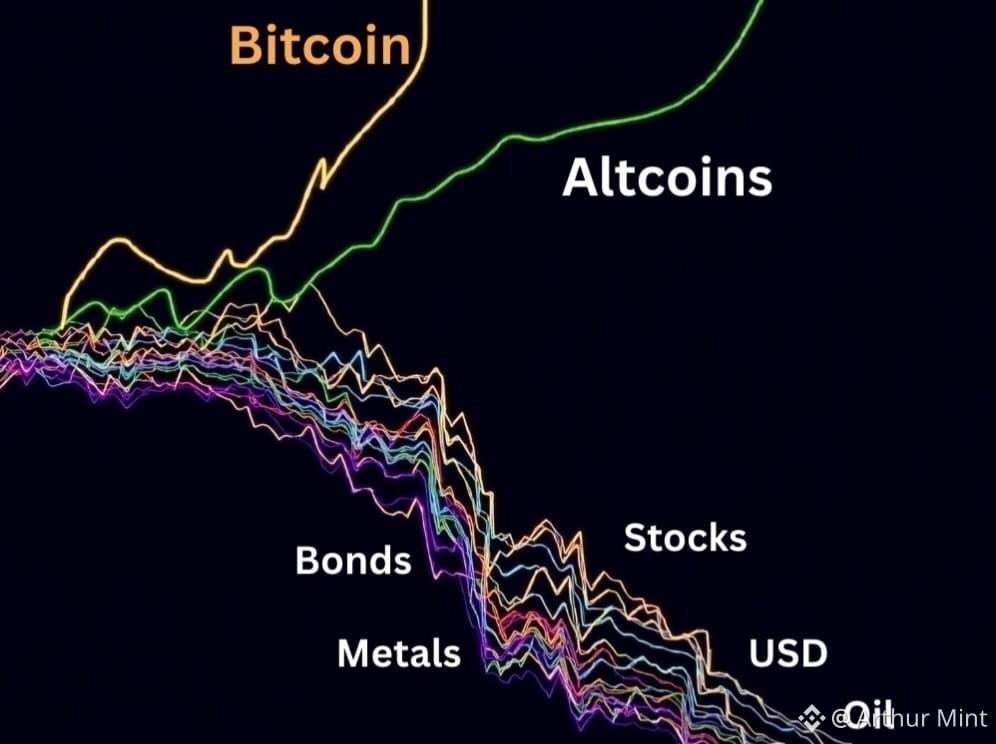
CAPITAL ROTATION COULD BE POINTING TOWARD CRYPTO
The chart highlights a striking rotation: Bitcoin rises sharply while stocks, bonds, metals, USD and oil trend lower.
Altcoins also begin strengthening, suggesting crypto is attracting capital as traditional assets weaken.
For Bitcoin, that matters because sustained relative strength can reinforce broader crypto momentum and potentially support another leg higher across the market.
Still, rotations can reverse quickly, so momentum alone is no guarantee.
Could this be the rotation crypto has been waiting for?
CAPITAL ROTATION COULD BE POINTING TOWARD CRYPTO
The chart highlights a striking rotation: Bitcoin rises sharply while stocks, bonds, metals, USD and oil trend lower.
Altcoins also begin strengthening, suggesting crypto is attracting capital as traditional assets weaken.
For Bitcoin, that matters because sustained relative strength can reinforce broader crypto momentum and potentially support another leg higher across the market.
Still, rotations can reverse quickly, so momentum alone is no guarantee.
Could this be the rotation crypto has been waiting for?
The chart highlights a striking rotation: Bitcoin rises sharply while stocks, bonds, metals, USD and oil trend lower.
Altcoins also begin strengthening, suggesting crypto is attracting capital as traditional assets weaken.
For Bitcoin, that matters because sustained relative strength can reinforce broader crypto momentum and potentially support another leg higher across the market.
Still, rotations can reverse quickly, so momentum alone is no guarantee.
Could this be the rotation crypto has been waiting for?
2
253
·
--
Жоғары (өспелі)
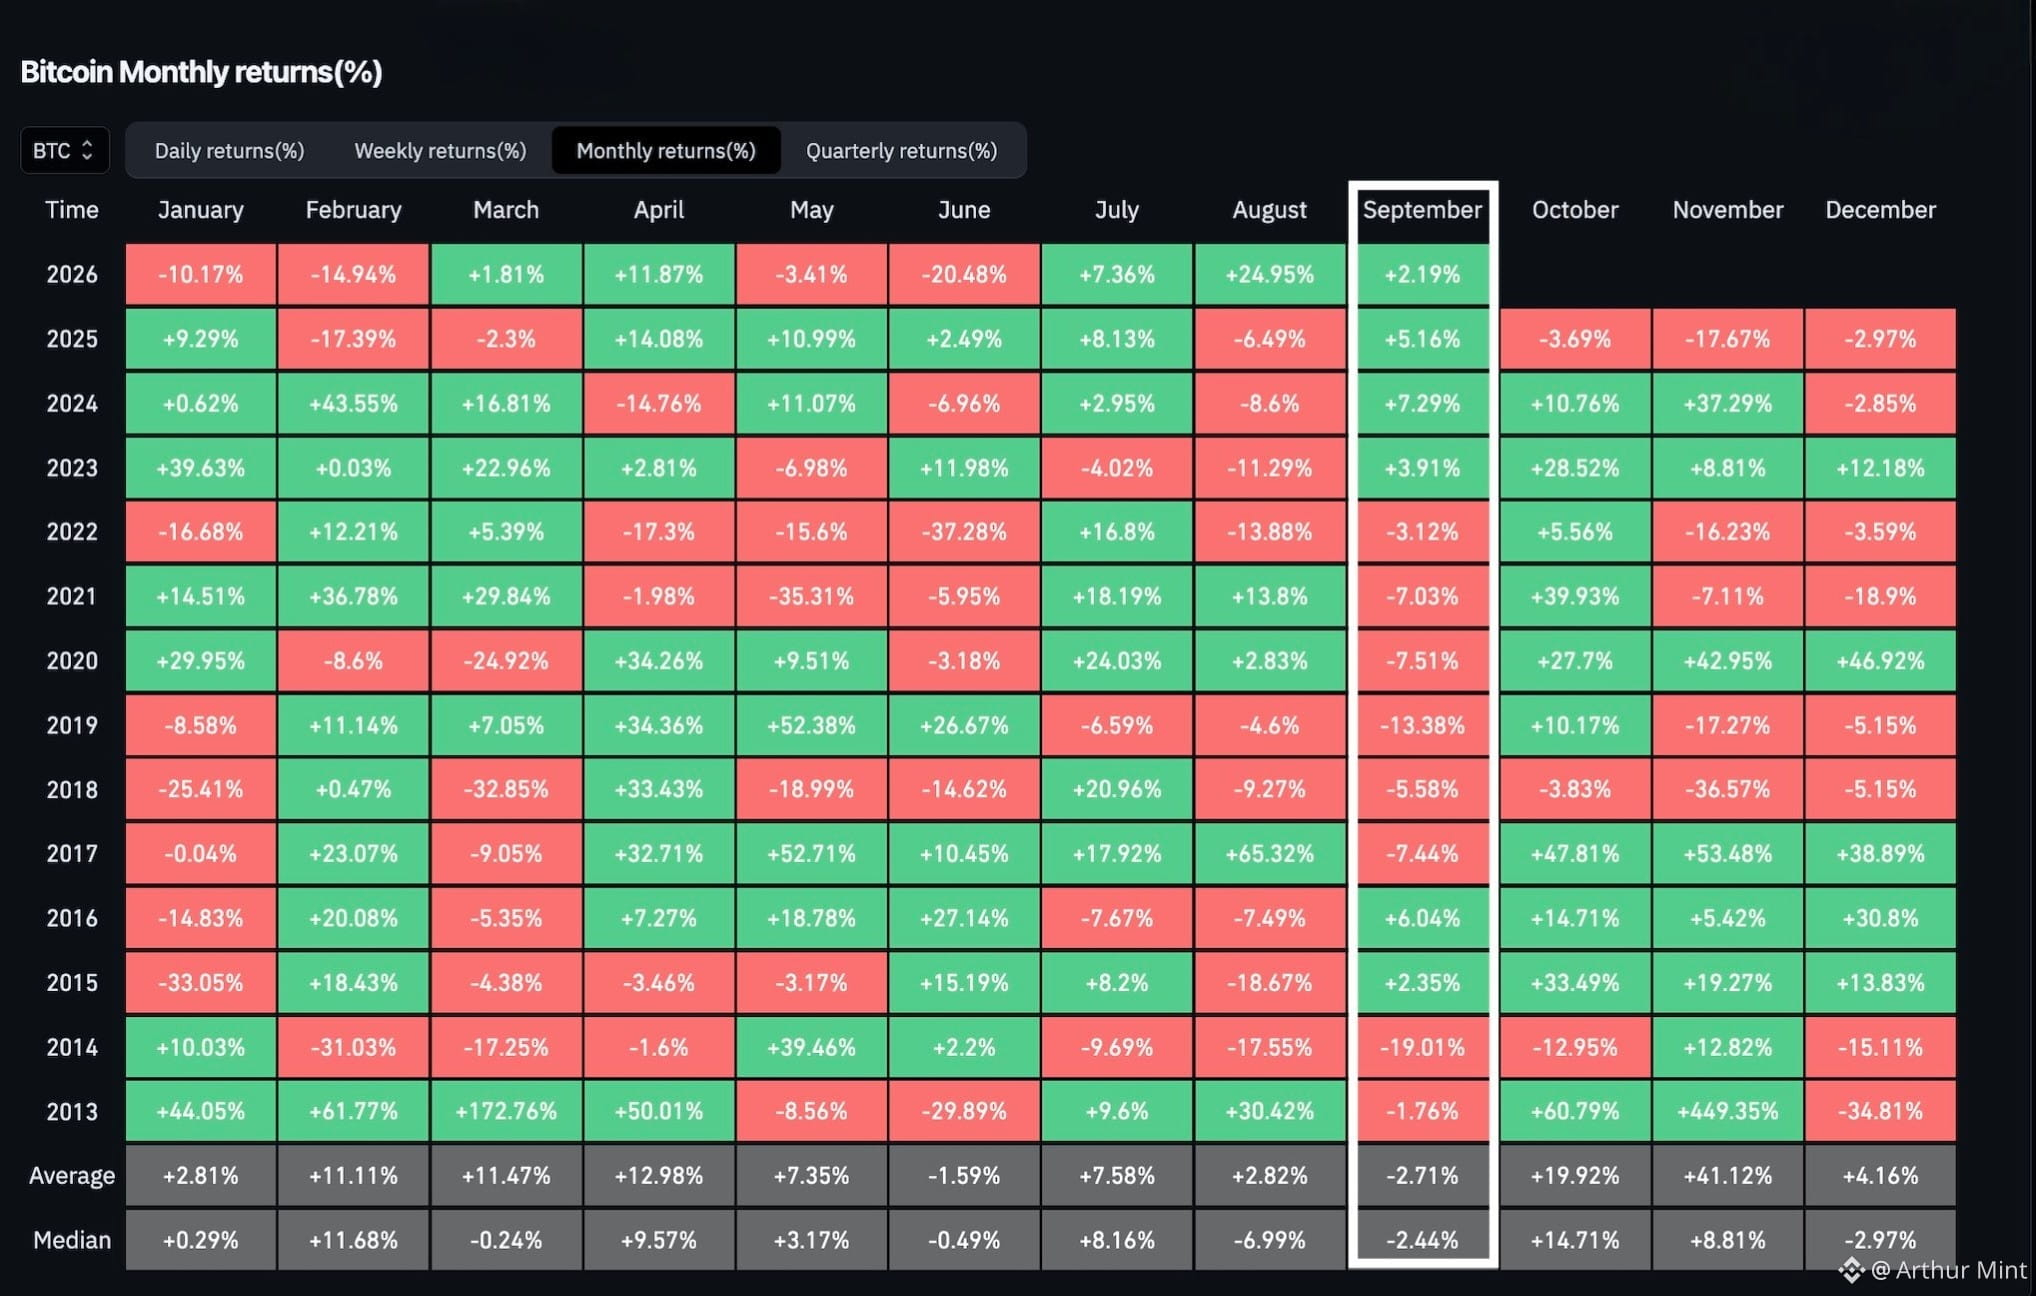
BITCOIN IS CHALLENGING ITS MOST NOTORIOUS MONTHLY PATTERN
September has historically been one of Bitcoin’s weakest months, with the chart showing a negative average and median performance for the month. Yet this September is currently in positive territory, breaking from the usual seasonal pressure.
More importantly, $BTC has a chance to record three consecutive green monthly performances during a bear market — something that has never happened before, according to the historical pattern highlighted here.
July and August were already positive, while September remains green as the month approaches its close. That puts Bitcoin just days away from a potentially notable historical milestone.
For the broader crypto market, such a move could signal that Bitcoin’s recent strength is pushing beyond the weakness normally associated with this period and challenging expectations around bearish market behavior.
Still, September has not officially closed yet, and historical patterns do not guarantee what comes next.
Will Bitcoin finally rewrite the bear-market playbook?
BITCOIN IS CHALLENGING ITS MOST NOTORIOUS MONTHLY PATTERN
September has historically been one of Bitcoin’s weakest months, with the chart showing a negative average and median performance for the month. Yet this September is currently in positive territory, breaking from the usual seasonal pressure.
More importantly, $BTC has a chance to record three consecutive green monthly performances during a bear market — something that has never happened before, according to the historical pattern highlighted here.
July and August were already positive, while September remains green as the month approaches its close. That puts Bitcoin just days away from a potentially notable historical milestone.
For the broader crypto market, such a move could signal that Bitcoin’s recent strength is pushing beyond the weakness normally associated with this period and challenging expectations around bearish market behavior.
Still, September has not officially closed yet, and historical patterns do not guarantee what comes next.
Will Bitcoin finally rewrite the bear-market playbook?
September has historically been one of Bitcoin’s weakest months, with the chart showing a negative average and median performance for the month. Yet this September is currently in positive territory, breaking from the usual seasonal pressure.
More importantly, $BTC has a chance to record three consecutive green monthly performances during a bear market — something that has never happened before, according to the historical pattern highlighted here.
July and August were already positive, while September remains green as the month approaches its close. That puts Bitcoin just days away from a potentially notable historical milestone.
For the broader crypto market, such a move could signal that Bitcoin’s recent strength is pushing beyond the weakness normally associated with this period and challenging expectations around bearish market behavior.
Still, September has not officially closed yet, and historical patterns do not guarantee what comes next.
Will Bitcoin finally rewrite the bear-market playbook?
1
187
·
--
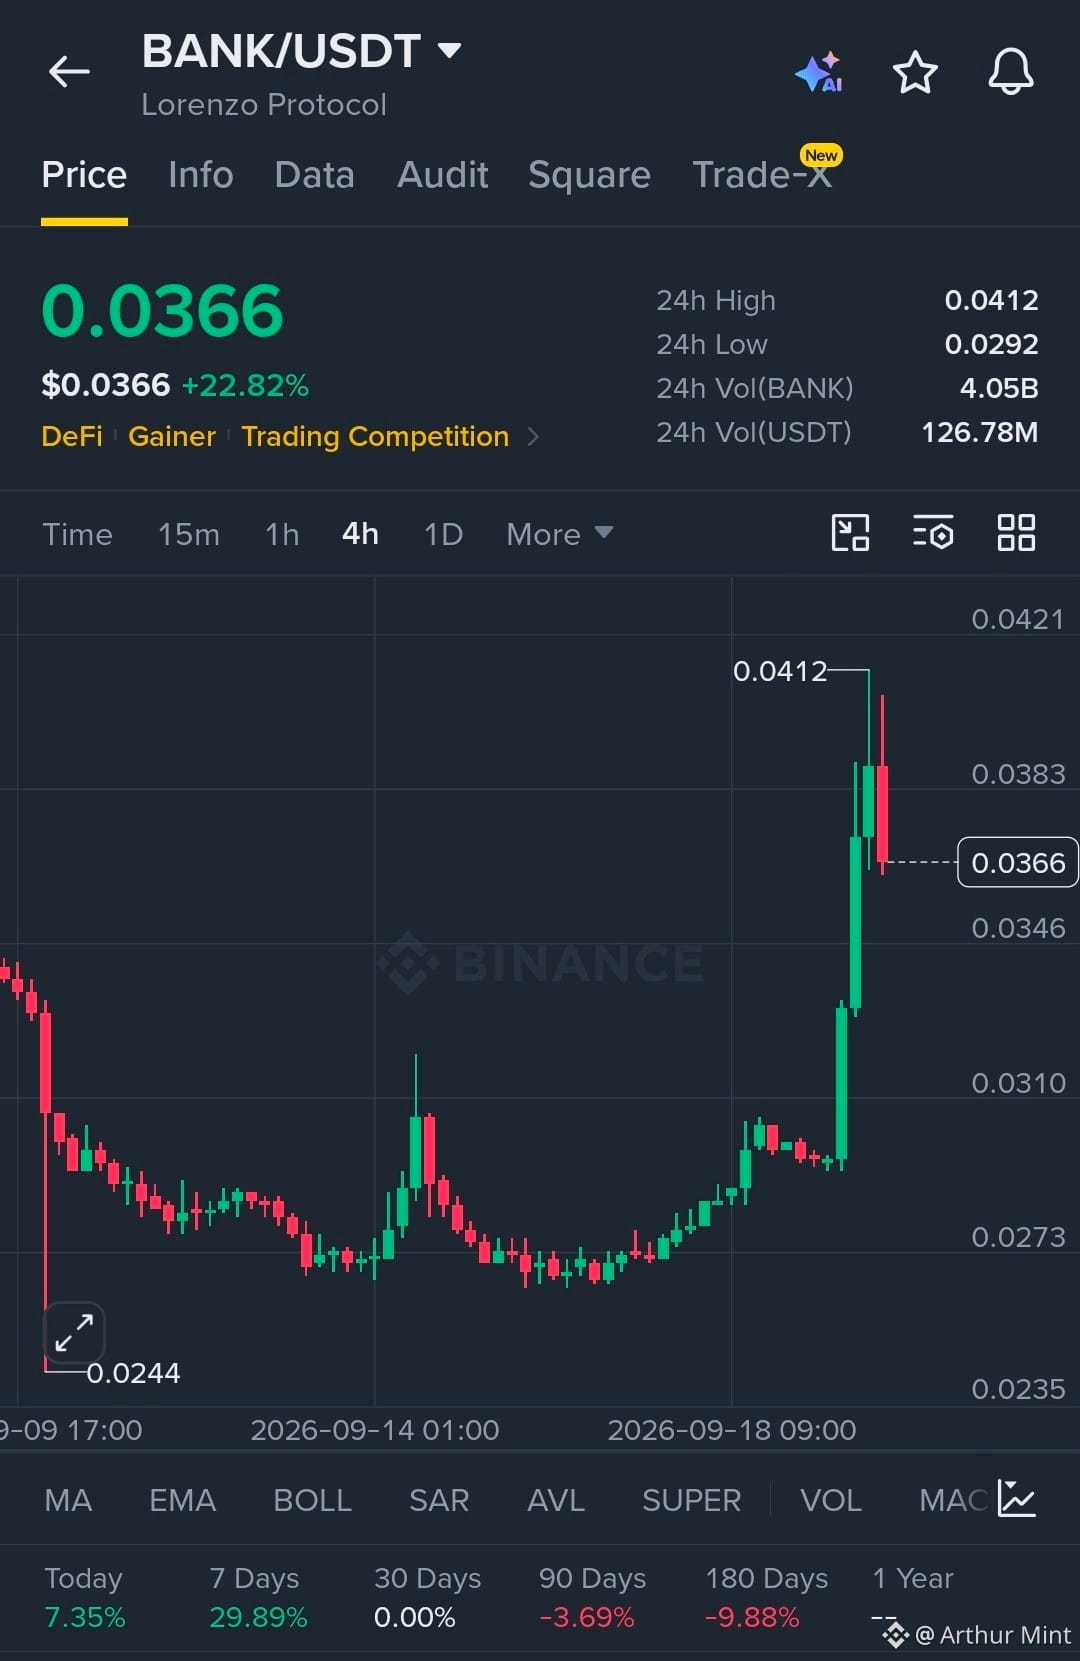
$BANK is showing strong momentum with aggressive upside expansion.
Buyers are in control as structure continues to print higher highs and higher lows.
EP
0.0355–0.0368
TP
TP1 0.0383
TP2 0.0412
TP3 0.0421
SL
0.0340
Liquidity above 0.0383 remains the key reaction zone, while holding 0.0340 keeps the bullish structure intact. A clean break above 0.0412 could open the next liquidity pocket toward 0.0421.
Let’s go $BANK
$BANK is showing strong momentum with aggressive upside expansion.
Buyers are in control as structure continues to print higher highs and higher lows.
EP
0.0355–0.0368
TP
TP1 0.0383
TP2 0.0412
TP3 0.0421
SL
0.0340
Liquidity above 0.0383 remains the key reaction zone, while holding 0.0340 keeps the bullish structure intact. A clean break above 0.0412 could open the next liquidity pocket toward 0.0421.
Let’s go $BANK
Buyers are in control as structure continues to print higher highs and higher lows.
EP
0.0355–0.0368
TP
TP1 0.0383
TP2 0.0412
TP3 0.0421
SL
0.0340
Liquidity above 0.0383 remains the key reaction zone, while holding 0.0340 keeps the bullish structure intact. A clean break above 0.0412 could open the next liquidity pocket toward 0.0421.
Let’s go $BANK
2
428
·
--
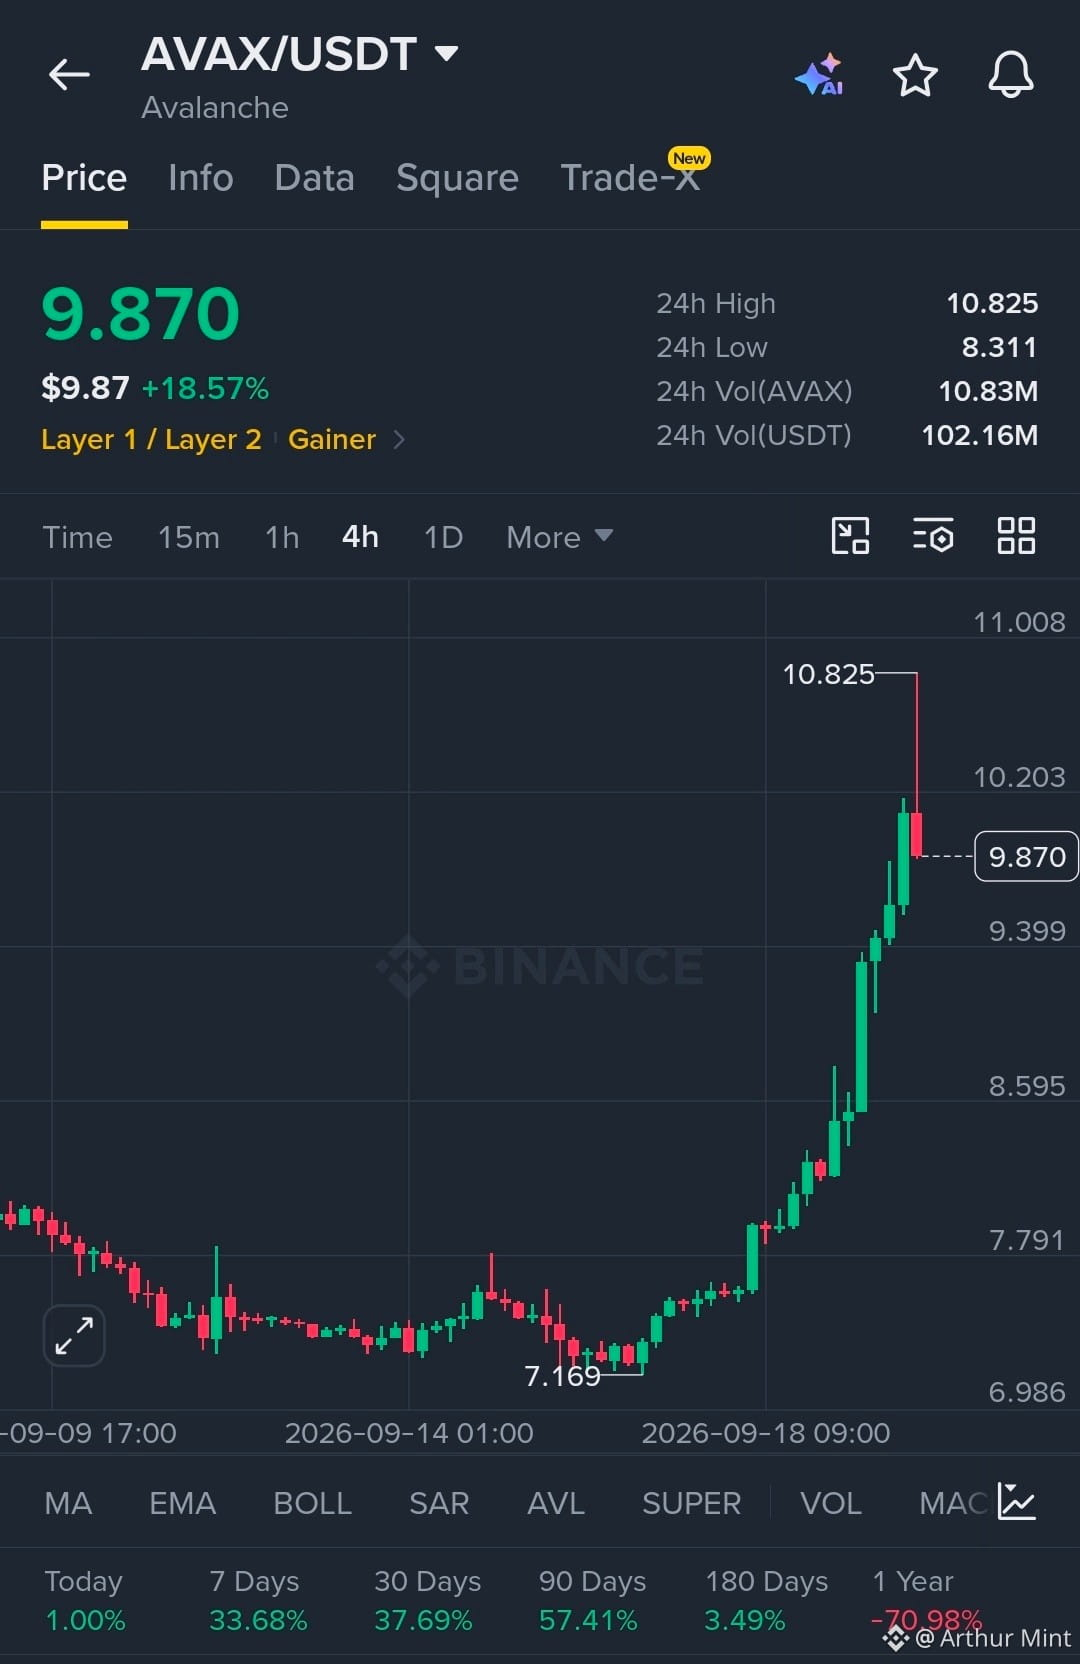
$AVAX is showing strong momentum with aggressive upside expansion.
Buyers are in control as structure continues to print higher highs and higher lows.
EP
9.70–9.90
TP
TP1 10.20
TP2 10.80
TP3 11.00
SL
9.35
Liquidity above 10.20 remains the key reaction zone, while holding 9.35 keeps the bullish structure intact. A clean break above 10.80 could open the next liquidity pocket toward 11.00.
Let’s go $AVAX
$AVAX is showing strong momentum with aggressive upside expansion.
Buyers are in control as structure continues to print higher highs and higher lows.
EP
9.70–9.90
TP
TP1 10.20
TP2 10.80
TP3 11.00
SL
9.35
Liquidity above 10.20 remains the key reaction zone, while holding 9.35 keeps the bullish structure intact. A clean break above 10.80 could open the next liquidity pocket toward 11.00.
Let’s go $AVAX
Buyers are in control as structure continues to print higher highs and higher lows.
EP
9.70–9.90
TP
TP1 10.20
TP2 10.80
TP3 11.00
SL
9.35
Liquidity above 10.20 remains the key reaction zone, while holding 9.35 keeps the bullish structure intact. A clean break above 10.80 could open the next liquidity pocket toward 11.00.
Let’s go $AVAX
1
469
·
--
Жоғары (өспелі)
Bitcoin jumped $18,000 in just one week — from $63,000 to $81,000.
That move came right in the middle of a bear market, showing how sharply Bitcoin can accelerate even when broader conditions remain weak.
Why it matters: A single week erased a massive price gap, highlighting the scale of Bitcoin’s upside moves.
Market takeaway: Bear markets can still produce explosive rallies — and bull markets could amplify that volatility.
Bitcoin jumped $18,000 in just one week — from $63,000 to $81,000.
That move came right in the middle of a bear market, showing how sharply Bitcoin can accelerate even when broader conditions remain weak.
Why it matters: A single week erased a massive price gap, highlighting the scale of Bitcoin’s upside moves.
Market takeaway: Bear markets can still produce explosive rallies — and bull markets could amplify that volatility.
That move came right in the middle of a bear market, showing how sharply Bitcoin can accelerate even when broader conditions remain weak.
Why it matters: A single week erased a massive price gap, highlighting the scale of Bitcoin’s upside moves.
Market takeaway: Bear markets can still produce explosive rallies — and bull markets could amplify that volatility.
2
230
·
--
Жоғары (өспелі)
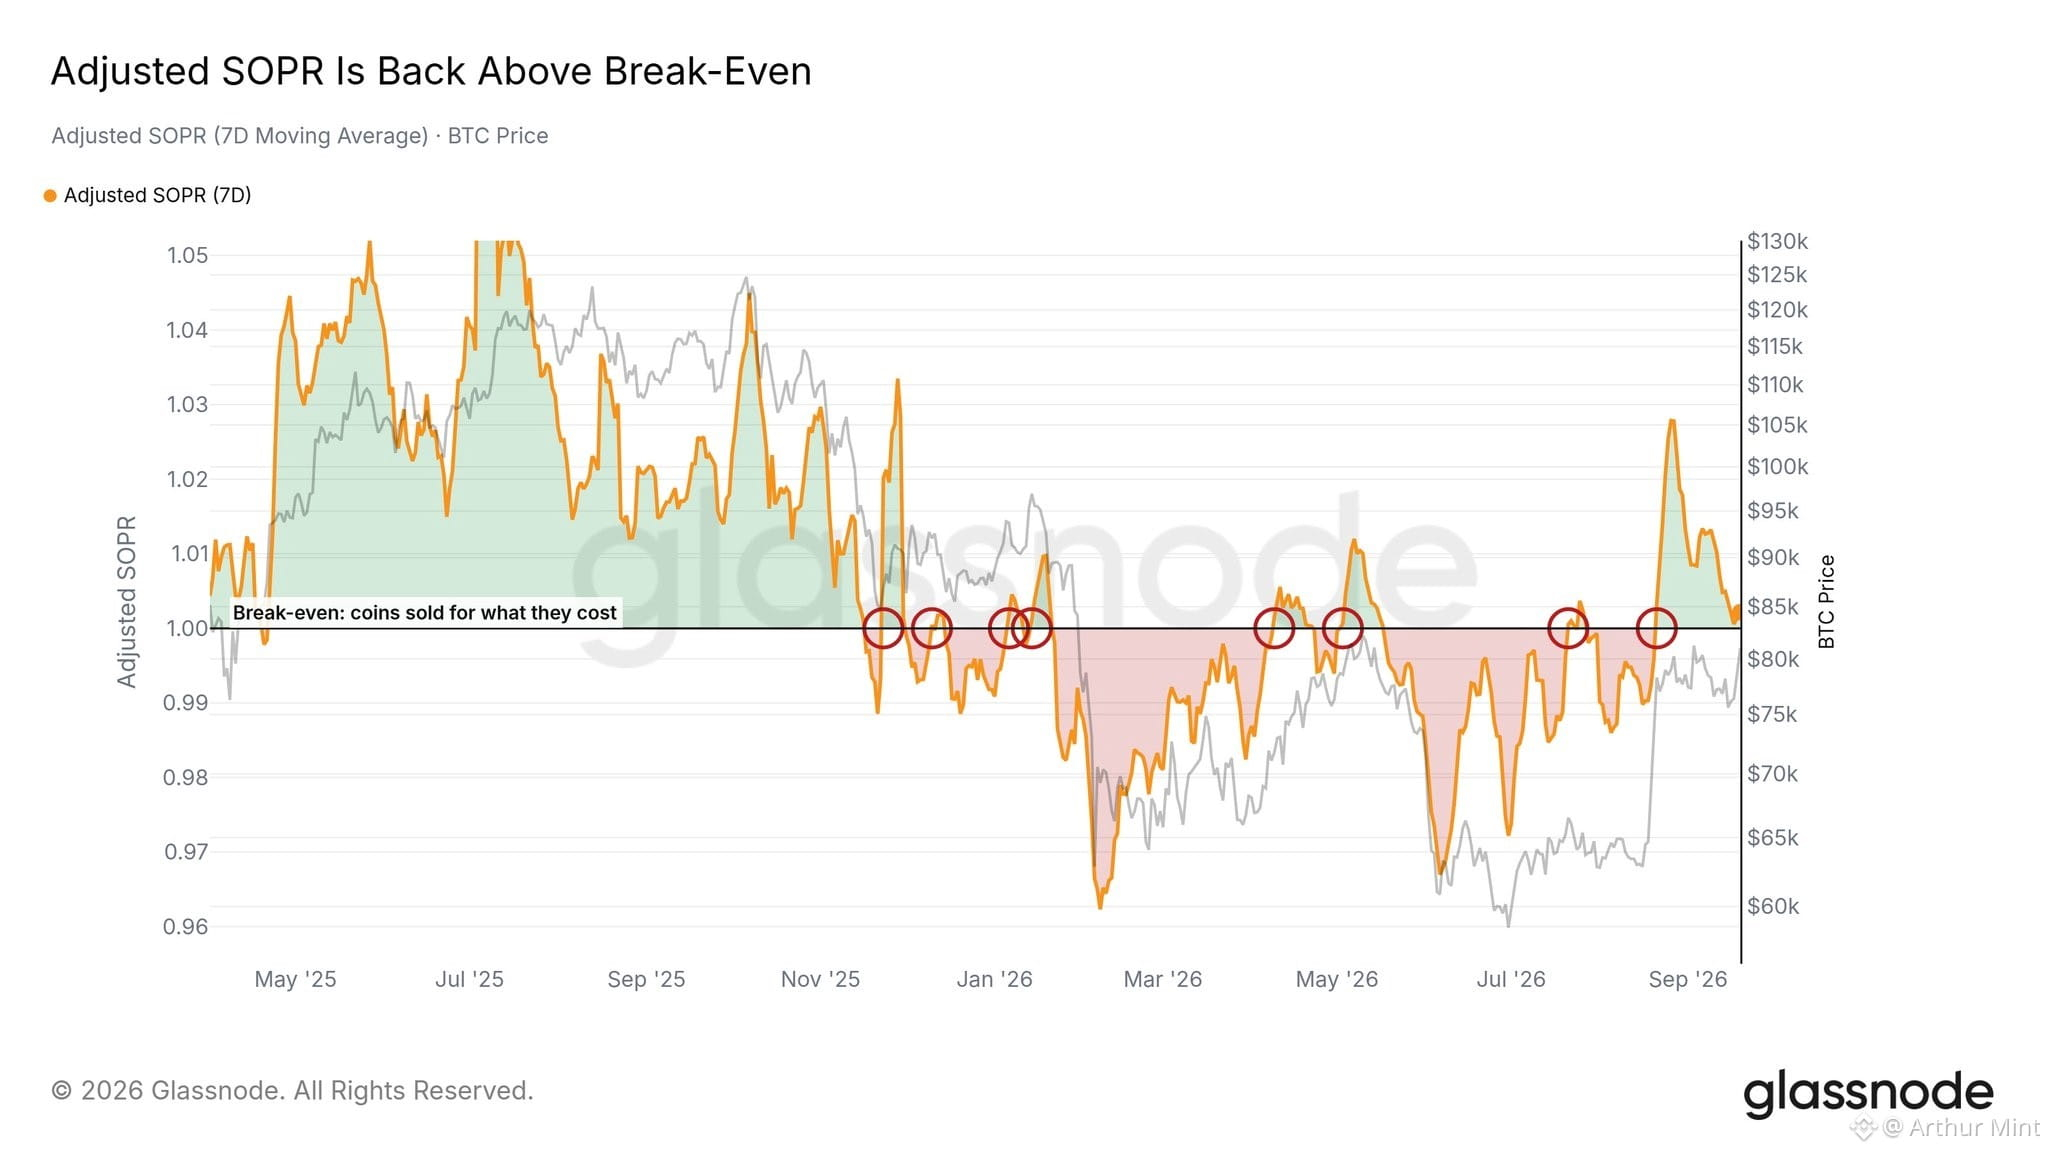
BITCOIN’S PROFITABILITY SIGNAL IS BACK ABOVE BREAK-EVEN
Bitcoin’s latest on-chain setup is showing renewed strength. The chart indicates that entity-adjusted SOPR has moved back above 1, suggesting coins are being spent at a profit rather than immediately triggering broad selling pressure.
This level matters because sustained SOPR above 1 has historically been associated with a bull-market environment. The current move therefore points to demand holding up well enough for profitable spending without an immediate rollover.
The chart also highlights several previous moves around the break-even line, showing how important the 1.0 level has become. Staying above it would keep the constructive signal intact and support the broader bullish narrative.
The next key test is simple: can SOPR remain above 1? A continued hold could reinforce confidence in current demand, while a drop back below 1 would suggest that this strength is starting to fade.
Still, SOPR is not a guarantee of future price action. Market conditions can change quickly, so the signal should be monitored alongside the broader trend.
$BTC is back on the profit side of the line — can the bulls keep it there?
BITCOIN’S PROFITABILITY SIGNAL IS BACK ABOVE BREAK-EVEN
Bitcoin’s latest on-chain setup is showing renewed strength. The chart indicates that entity-adjusted SOPR has moved back above 1, suggesting coins are being spent at a profit rather than immediately triggering broad selling pressure.
This level matters because sustained SOPR above 1 has historically been associated with a bull-market environment. The current move therefore points to demand holding up well enough for profitable spending without an immediate rollover.
The chart also highlights several previous moves around the break-even line, showing how important the 1.0 level has become. Staying above it would keep the constructive signal intact and support the broader bullish narrative.
The next key test is simple: can SOPR remain above 1? A continued hold could reinforce confidence in current demand, while a drop back below 1 would suggest that this strength is starting to fade.
Still, SOPR is not a guarantee of future price action. Market conditions can change quickly, so the signal should be monitored alongside the broader trend.
$BTC is back on the profit side of the line — can the bulls keep it there?
Bitcoin’s latest on-chain setup is showing renewed strength. The chart indicates that entity-adjusted SOPR has moved back above 1, suggesting coins are being spent at a profit rather than immediately triggering broad selling pressure.
This level matters because sustained SOPR above 1 has historically been associated with a bull-market environment. The current move therefore points to demand holding up well enough for profitable spending without an immediate rollover.
The chart also highlights several previous moves around the break-even line, showing how important the 1.0 level has become. Staying above it would keep the constructive signal intact and support the broader bullish narrative.
The next key test is simple: can SOPR remain above 1? A continued hold could reinforce confidence in current demand, while a drop back below 1 would suggest that this strength is starting to fade.
Still, SOPR is not a guarantee of future price action. Market conditions can change quickly, so the signal should be monitored alongside the broader trend.
$BTC is back on the profit side of the line — can the bulls keep it there?
3
199
Көбірек контент көру үшін кіріңіз
Binance Square платформасында әлемдік криптоқоғамдастыққа қосылыңыз
⚡️ Криптовалюта туралы ең соңғы және пайдалы ақпаратты алыңыз.
💬 Әлемдегі ең ірі криптобиржаның сеніміне ие.
👍 Расталған авторлардың нақты пікірлерін табыңыз.
Электрондық пошта/телефон нөмірі
Трендтегі тақырыптар
AIStocksWhatNext
628,702 рет көрілді
4,708 адам талқылап жатыр
Share & Win Traffic Reward in our Trending Hashtag Campaign
✨Topic: What Other Investment Opportunities Remain as AI Stocks Keep Rising?
👉How to Join:
Publish a short post or article with hashtag #AIStocksWhatNext
Share whether you’re bullish or bearish, and post your AI stock holdings or trade — using the trade widget may improve your eligibility.
You can also strengthen your post by sharing data or charts, and avoiding AI-generated images.
✍️Create content based on the below angles:
- Nvidia says chip sales will double next year, and top AI companies keep hitting record revenue, the compute spend behind it is just as staggering. Is AI demand really taking off? And how long can it last? AI stocks are up across the board. Is this a real breakout, or just a short-term bounce?
- Industry leaders are calling to slow down AI development, while Trump plans to build an “AI Force”, claiming AI could account for 25% of U.S. GDP in the future. Whose side are you on? Will state-level backing be a long-term win for AI stocks?
- Are you buying AI stocks? Share your AI-related trade/holdings with our trade sharing widget.
⏰Campaign Period:
- 2026-09-22 7:00 - 2026-09-24 4:00 UTC
🎁Reward:
- Qualified posts that comply with the above guidelines and contain more than 100 words will be reviewed and may receive a random traffic boost of 500 to 3,000 views. You will receive a notification from your feed secretary if your post is selected.
- Get a chance to have your article featured on Binance Square Official
Need ideas for your post? Visit the topic page #AIStocksWhatNext or the Square Guide on How to Post for Better Reach.
Binance Square Official
·472 лайк
·1.3M рет көрілді
21SharesLaunchesEuropesFirstZcashETP
8,341 рет көрілді
343 адам талқылап жатыр
CardanoJoinsX402PaymentStandard
5,757 рет көрілді
264 адам талқылап жатыр