🚨 HISTORIC SIGNAL | #BTC Reclaims the 50-Week Moving Average! 🚀📈
For the first time in 45 weeks, #bitcoin (BTC) has officially secured a weekly close above its critical 50-week Moving Average (50W MA). This is a massive technical milestone that historically signals the ultimate end of the bear market and the start of a macro bull cycle! 📉➡️🐂
📊 Chart Breakdown (Data by Galaxy Research):
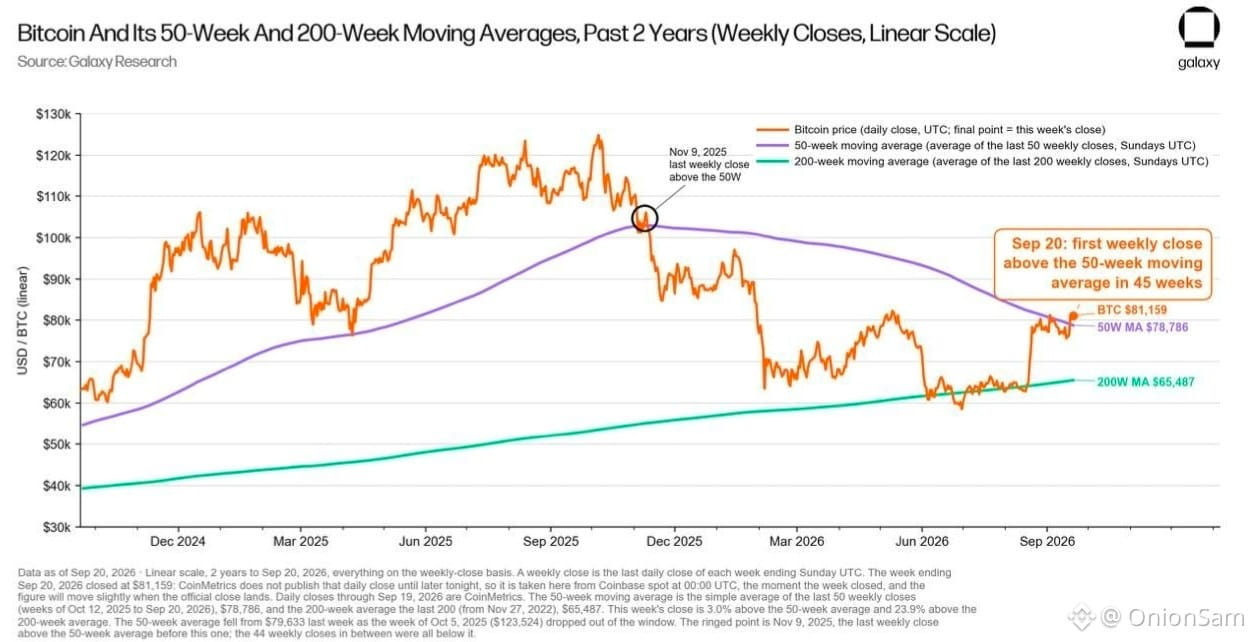
🟠 The Price Breakthrough: As shown in the chart on September 20, 2026, Bitcoin’s price (the orange line) successfully closed the week at $81,159!
🟣 Breaking the Resistance: This crucial close pushed BTC right above the 50-week Moving Average (the purple line), which is currently sitting at $78,786.
🎯 Ending the 45-Week Streak: The black circle on the chart marks November 9, 2025—the very last time BTC was trading above this line. After 44 consecutive weeks below it, the 45th week finally broke the spell!
🟢 The Ultimate Baseline: Meanwhile, the 200-week Moving Average (the green line) acts as a rock-solid floor at $65,487, confirming that the long-term trend remains heavily bullish.
💡 Alex Thorn (Head of Research at Galaxy) emphasizes that this exact technical setup has historically marked the absolute macro bottom for Bitcoin.
The game has officially changed. Position accordingly! 🪙✨
#Market_Update
#LINK
#zec
$BTC
$LINK
$ZEC
For the first time in 45 weeks, #bitcoin (BTC) has officially secured a weekly close above its critical 50-week Moving Average (50W MA). This is a massive technical milestone that historically signals the ultimate end of the bear market and the start of a macro bull cycle! 📉➡️🐂
📊 Chart Breakdown (Data by Galaxy Research):
🟠 The Price Breakthrough: As shown in the chart on September 20, 2026, Bitcoin’s price (the orange line) successfully closed the week at $81,159!
🟣 Breaking the Resistance: This crucial close pushed BTC right above the 50-week Moving Average (the purple line), which is currently sitting at $78,786.
🎯 Ending the 45-Week Streak: The black circle on the chart marks November 9, 2025—the very last time BTC was trading above this line. After 44 consecutive weeks below it, the 45th week finally broke the spell!
🟢 The Ultimate Baseline: Meanwhile, the 200-week Moving Average (the green line) acts as a rock-solid floor at $65,487, confirming that the long-term trend remains heavily bullish.
💡 Alex Thorn (Head of Research at Galaxy) emphasizes that this exact technical setup has historically marked the absolute macro bottom for Bitcoin.
The game has officially changed. Position accordingly! 🪙✨
#Market_Update
#LINK
#zec
$BTC
$LINK
$ZEC