
CHIP/USDT Perpetual · 15-Minute Chart with RSI · Structure & Range Analysis
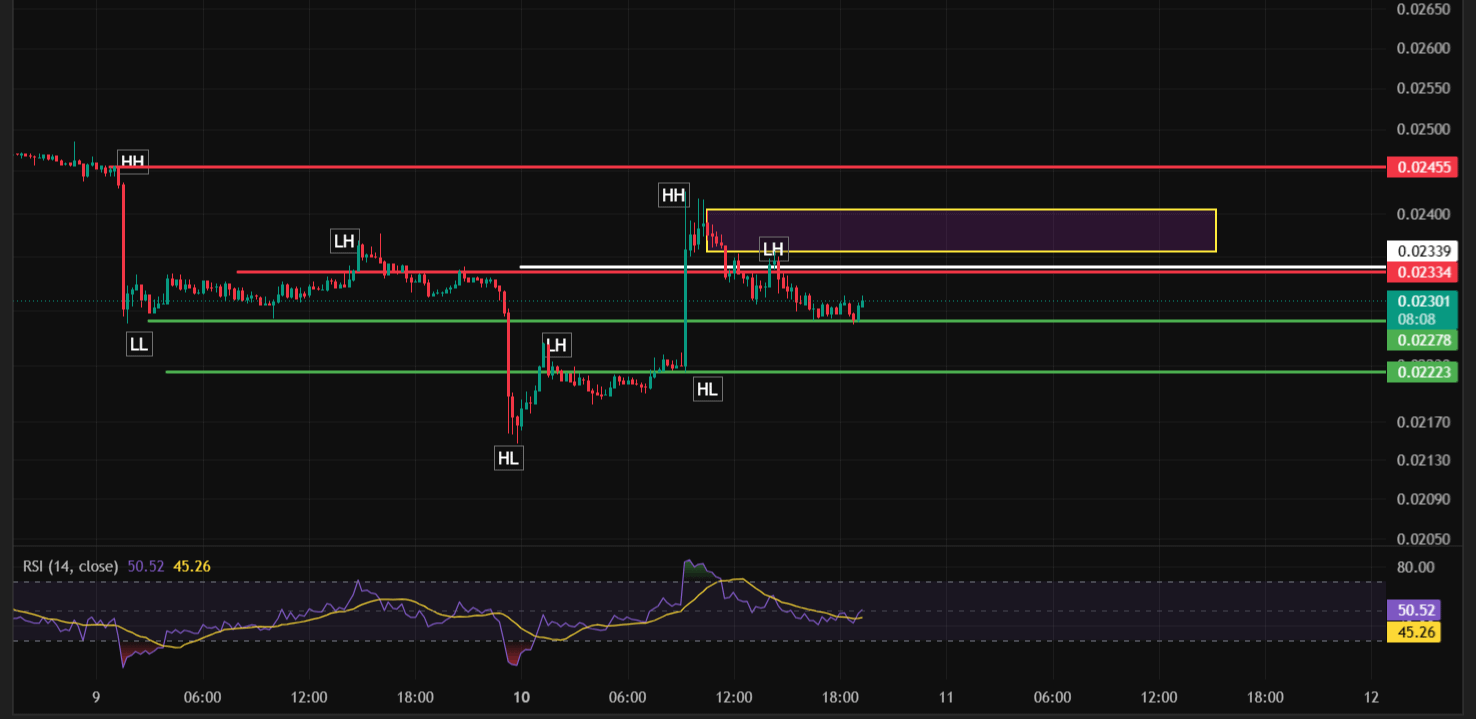
CHIP topped out near $0.02455 on August 9 and has spent the time since failing to get back there — each rally attempt has come in lower than the one before it. After a sharp initial crash into a Lower Low near $0.0217, the coin has bounced repeatedly, but every bounce has stalled earlier: first at $0.0238, then again around $0.0234–0.024, and most recently at $0.02339, before settling into the current consolidation around $0.02304.
Reading the Structure
The chart opened with a sharp decline off the HH at $0.02455, crashing into a Lower Low near $0.0217. Since then, the pattern has been a series of bounces that consistently fall short of reclaiming the prior high:
A rally into a Lower High near $0.0238 (Aug 9) failed to challenge $0.02455.
A decline into a Higher Low near $0.0212 was followed by another bounce, this one stalling at a Lower High near $0.0225 (Aug 10 morning).
A sharp, fast rally pushed into a fresh local high around $0.0234–0.024 (Aug 10 midday) — the most aggressive bounce yet — but it too was rejected, forming another Lower High at $0.02339 before declining to the current price.
This is worth being direct about: a pattern of consistently Lower Highs, even alongside some Higher Lows, is not a clearly bullish setup. It suggests sellers are still active on every rally, and the market hasn't yet demonstrated it can clear a prior high — which is the more meaningful signal in a structure like this.
The RSI adds some nuance: it spiked toward roughly 75–80 during the sharp midday rally, then cooled back to a near-neutral 45.34–51.62. In an uptrend, that kind of reset is often healthy. Here, given the broader pattern of failed highs, it's more accurately read as momentum fading back to neutral after a failed breakout attempt — a more cautious signal than the same RSI pattern would represent in a genuine uptrend.
Key Levels to Watch
Resistance:
$0.02334–0.02339 — the most recent Lower High and immediate resistance; this is the level that needs to break for the pattern of declining highs to finally end.
$0.02455 — the major resistance and the origin high of the entire move; reclaiming this would be the real signal of a structural reversal.
Support:
$0.02278 — first support, just under current price.
$0.02223 — a deeper support shelf; a break below this would put the recent Higher Lows in question.
$0.0212–0.0217 — the deeper lows of the move; a break below this zone would suggest the broader downtrend is resuming in earnest.
Trade Scenarios
Scenario A — Range trade (respecting the current pattern):
Entry: Near support in the $0.02223–0.02278 zone
Stop-loss: Below $0.02223
Target: $0.02334–0.02339, treating it as range resistance rather than assuming a break
Scenario B — Breakout entry (only on confirmation):
Entry: On a confirmed close above $0.02339, ideally with RSI reclaiming 55+
Stop-loss: Below $0.02278
Target 1: $0.02455
Target 2: New highs beyond $0.02455, contingent on genuine follow-through
Scenario C — Downside continuation (respecting the lower-high pattern):
Entry: On rejection from the $0.02334–0.02339 zone
Stop-loss: Above $0.02339
Target 1: $0.02223
Target 2: $0.0212–0.0217
What Would Actually Change This Outlook
The pattern of Lower Highs is the dominant signal on this chart right now. It takes a genuine, confirmed break above $0.02339 — and ideally $0.02455 — with RSI support, to actually change that read. Until then, the more statistically likely path is continued range-bound or downward pressure, and rallies within the range should be treated as exactly that rather than assumed breakouts.
Bottom Line
CHIP has been unable to reclaim its recent highs on multiple attempts, and that pattern of Lower Highs is the most important thing on this chart. A hold above $0.02223–0.02278 keeps the range intact, but the more meaningful signal — a genuine trend change — only comes with a confirmed break above $0.02339 and eventually $0.02455.
This article is for informational and educational purposes only and does not constitute financial advice. Cryptocurrency trading, and perpetual futures contracts in particular, involve substantial risk of loss. Always do your own research and manage risk according to your own financial situation before making any trading decisions.
@Binance Square Official #GoldChallenges$4380 #RobinhoodToOfferCryptoTradingInUK #TSMCJulyRevenueJumps45% #Binance #ChartSniper