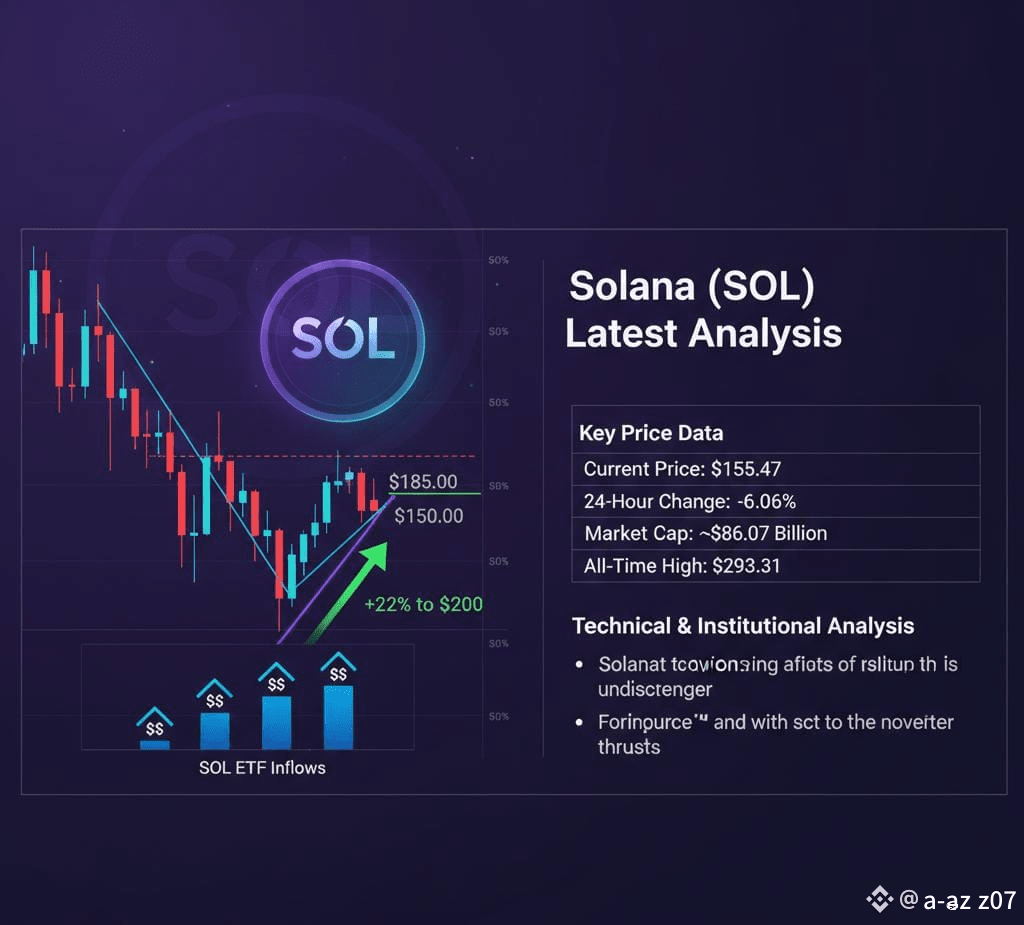
🌟 $SOL Solana (SOL) Latest Price Analysis
As of early-mid November 2025, Solana (SOL) is showing a mixed but closely watched technical structure, having recently undergone a correction but finding potential demand zones.
Key Price Data
| Metric | Value (Approx.) | Trend |
|---|---|---|
| Current Price | \text{\$155.47} | Short-Term Down |
| 24-Hour Change | -6.06\% | Downward |
| 7-Day Change | \sim -5.6\% | Downward |
| Market Cap | \sim \text{\$86.07 Billion} | - |
| All-Time High | \text{\$293.31} (Jan 2025) | -47% from ATH |
(Note: Prices are approximate and based on early November 2025 data.)
Technical & Institutional Analysis
1. Price Action and Key Levels
* Current Range: SOL has been in a corrective phase since its recent highs and is currently attempting to find a footing in the $150 - $160 range.
* Crucial Support: The $150 level is a critical psychological and technical support zone. Holding this level is key to avoiding further downside toward the $120 mark.
* Key Resistance: Immediate resistance levels are seen near $170 and then at $185 - $200. A decisive move above the $185 area would signal a potential return to a strong bullish trend.
* Pattern: Some analysts are observing a potential "local bottom" formation in the $150-$160 zone, with a possible falling wedge pattern that could project a \sim 22\% breakout toward $200 if confirmed.
2. Institutional Interest (ETFs)
* Positive Inflows: Despite a broader market decline and outflows from Bitcoin and Ethereum ETFs, Solana-linked ETFs (like Bitwise's BSOL) have continued to see positive net inflows. This suggests sustained institutional interest and conviction in SOL's long-term growth and adoption.
* Market Rotation: The consistent inflows, alongside a recent rise in the Altcoin Season Index, indicate that institutional capital may be rotating into high-beta altcoins like Solana.
#USGovShutdownEnd? #BinanceHODLerALLO #solana #BTC
As of early-mid November 2025, Solana (SOL) is showing a mixed but closely watched technical structure, having recently undergone a correction but finding potential demand zones.
Key Price Data
| Metric | Value (Approx.) | Trend |
|---|---|---|
| Current Price | \text{\$155.47} | Short-Term Down |
| 24-Hour Change | -6.06\% | Downward |
| 7-Day Change | \sim -5.6\% | Downward |
| Market Cap | \sim \text{\$86.07 Billion} | - |
| All-Time High | \text{\$293.31} (Jan 2025) | -47% from ATH |
(Note: Prices are approximate and based on early November 2025 data.)
Technical & Institutional Analysis
1. Price Action and Key Levels
* Current Range: SOL has been in a corrective phase since its recent highs and is currently attempting to find a footing in the $150 - $160 range.
* Crucial Support: The $150 level is a critical psychological and technical support zone. Holding this level is key to avoiding further downside toward the $120 mark.
* Key Resistance: Immediate resistance levels are seen near $170 and then at $185 - $200. A decisive move above the $185 area would signal a potential return to a strong bullish trend.
* Pattern: Some analysts are observing a potential "local bottom" formation in the $150-$160 zone, with a possible falling wedge pattern that could project a \sim 22\% breakout toward $200 if confirmed.
2. Institutional Interest (ETFs)
* Positive Inflows: Despite a broader market decline and outflows from Bitcoin and Ethereum ETFs, Solana-linked ETFs (like Bitwise's BSOL) have continued to see positive net inflows. This suggests sustained institutional interest and conviction in SOL's long-term growth and adoption.
* Market Rotation: The consistent inflows, alongside a recent rise in the Altcoin Season Index, indicate that institutional capital may be rotating into high-beta altcoins like Solana.
#USGovShutdownEnd? #BinanceHODLerALLO #solana #BTC