
#mstrb
mstrb
27,415 рет көрілді
824 адам талқылап жатыр
Қызу саудада
Ең соңғы

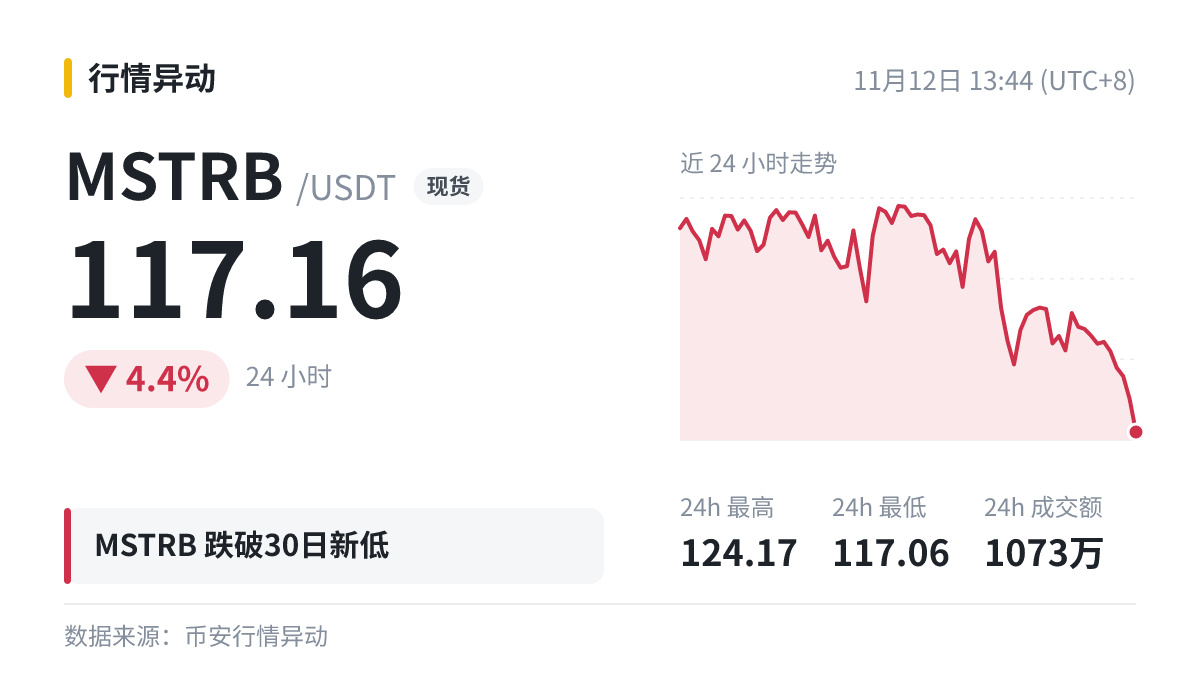

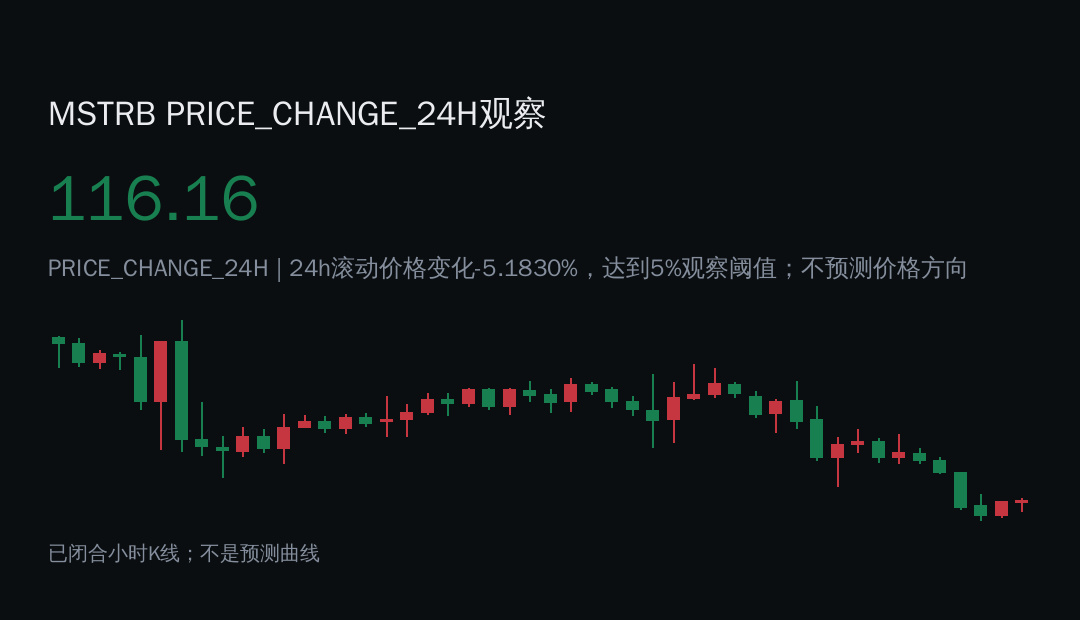


$MSTRB: Why Explicit Uncertainty Logging Improves Trade Decisions
$MSTRB sits below its local support with an hourly down direction and volume above baseline. Does the lack of a documented uncertainty log make it harder to judge whether a pull‑back is a genuine entry or a chase?\n\nA common assumption is that a trader can infer entry quality from raw price and volume alone. The counterexample to consider is a thought experiment where two analysts watch the same candle. Analyst A notes the down move and writes down the uncertainty: "Price may be testing a false breakout; volume is high but could be short‑covering. If the next candle closes above 116.55, the signal gains credibility; if not, the trade may be invalid." Analyst B makes no note and simply enters on the next dip. The trade‑off emerges: documenting uncertainty adds a step that can prevent chasing, but it also delays entry, potentially missing a small move.\n\nWhat could change the reading? A future closed‑candle that shows 6.73x baseline volume paired with 33.7 indicating oversold conditions would weaken the initial assumption of a pure bearish bias and prompt a reassessment of the trade plan. The self‑check highlights that explicit logging turns vague intuition into a testable hypothesis, allowing the trader to invalidate the idea without increasing stop distance unnecessarily.
Probabilistic market research, not a recommendation or guaranteed return.
For a wider view: $ETH has hourly direction down and volume above its baseline; $ERA has hourly direction up and volume above its baseline. This alone does not establish correlation.
#MSTRB #ETH
$MSTRB : Why Explicit Uncertainty Logging Improves Trade Decisions
$MSTRB sits below its local support with an hourly down direction and volume above baseline. Does the lack of a documented uncertainty log make it harder to judge whether a pull‑back is a genuine entry or a chase?\n\nA common assumption is that a trader can infer entry quality from raw price and volume alone. The counterexample to consider is a thought experiment where two analysts watch the same candle. Analyst A notes the down move and writes down the uncertainty: "Price may be testing a false breakout; volume is high but could be short‑covering. If the next candle closes above 116.55, the signal gains credibility; if not, the trade may be invalid." Analyst B makes no note and simply enters on the next dip. The trade‑off emerges: documenting uncertainty adds a step that can prevent chasing, but it also delays entry, potentially missing a small move.\n\nWhat could change the reading? A future closed‑candle that shows 6.73x baseline volume paired with 33.7 indicating oversold conditions would weaken the initial assumption of a pure bearish bias and prompt a reassessment of the trade plan. The self‑check highlights that explicit logging turns vague intuition into a testable hypothesis, allowing the trader to invalidate the idea without increasing stop distance unnecessarily.
Probabilistic market research, not a recommendation or guaranteed return.
For a wider view: $ETH has hourly direction down and volume above its baseline; $ERA has hourly direction up and volume above its baseline. This alone does not establish correlation.
#MSTRB #ETH
$MSTRB sits below its local support with an hourly down direction and volume above baseline. Does the lack of a documented uncertainty log make it harder to judge whether a pull‑back is a genuine entry or a chase?\n\nA common assumption is that a trader can infer entry quality from raw price and volume alone. The counterexample to consider is a thought experiment where two analysts watch the same candle. Analyst A notes the down move and writes down the uncertainty: "Price may be testing a false breakout; volume is high but could be short‑covering. If the next candle closes above 116.55, the signal gains credibility; if not, the trade may be invalid." Analyst B makes no note and simply enters on the next dip. The trade‑off emerges: documenting uncertainty adds a step that can prevent chasing, but it also delays entry, potentially missing a small move.\n\nWhat could change the reading? A future closed‑candle that shows 6.73x baseline volume paired with 33.7 indicating oversold conditions would weaken the initial assumption of a pure bearish bias and prompt a reassessment of the trade plan. The self‑check highlights that explicit logging turns vague intuition into a testable hypothesis, allowing the trader to invalidate the idea without increasing stop distance unnecessarily.
Probabilistic market research, not a recommendation or guaranteed return.
For a wider view: $ETH has hourly direction down and volume above its baseline; $ERA has hourly direction up and volume above its baseline. This alone does not establish correlation.
#MSTRB #ETH
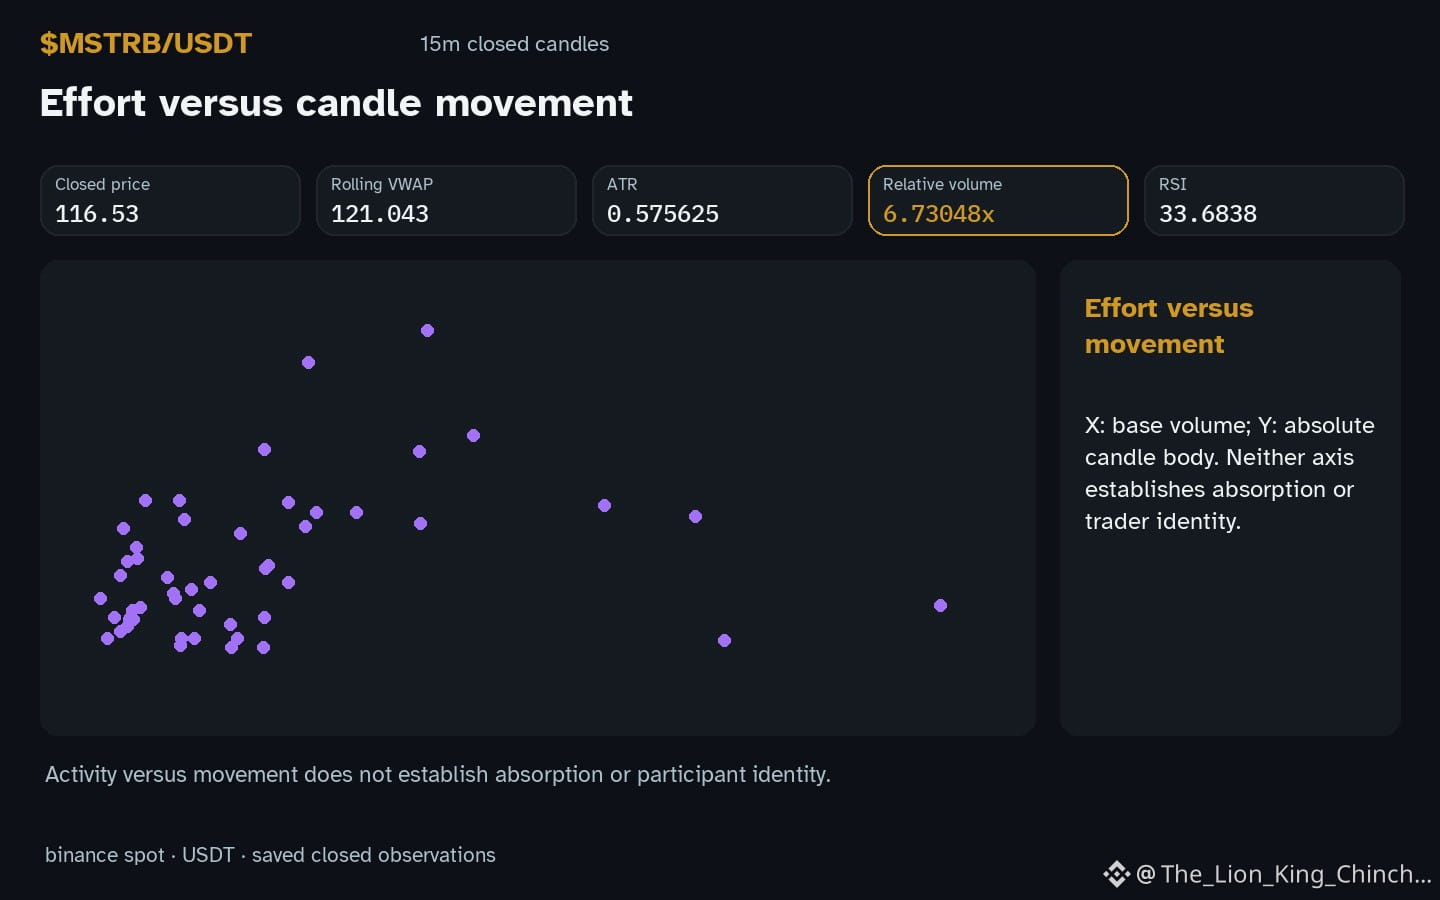
29

·
--
Tech Titan Tumble: $MSTRB Tests Support on Binance Spot 📉
Price action – $MSTRB is trading at $118.99 on Binance Spot (MSTRB/USDT), down 2.88 % over the past 24 hours. Volume remains modest, suggesting the move is price‑driven rather than liquidity‑fueled.
Why it matters – Strategy Inc’s AI‑driven data platform remains a bellwether for the enterprise‑software sector, and any breach of support could signal broader risk‑off pressure on tech equities.
Key levels – Immediate support sits at $115.00, a historic floor that held during the Q1 pullback. Resistance lies at $123.50, the prior swing high, with a mid‑range pivot around $119.75 offering a potential bounce point.
Short outlook – From a support‑defense perspective, buyers need to defend the $115 level; failure would open the path to $110 and deeper downside. Holding the floor could stabilize the token and set the stage for a test of $123.50.
#MSTRB #Stocks #BinanceSquare
Tech Titan Tumble: $MSTRB Tests Support on Binance Spot 📉
Price action – $MSTRB is trading at $118.99 on Binance Spot (MSTRB/USDT), down 2.88 % over the past 24 hours. Volume remains modest, suggesting the move is price‑driven rather than liquidity‑fueled.
Why it matters – Strategy Inc’s AI‑driven data platform remains a bellwether for the enterprise‑software sector, and any breach of support could signal broader risk‑off pressure on tech equities.
Key levels – Immediate support sits at $115.00, a historic floor that held during the Q1 pullback. Resistance lies at $123.50, the prior swing high, with a mid‑range pivot around $119.75 offering a potential bounce point.
Short outlook – From a support‑defense perspective, buyers need to defend the $115 level; failure would open the path to $110 and deeper downside. Holding the floor could stabilize the token and set the stage for a test of $123.50.
#MSTRB #Stocks #BinanceSquare
Price action – $MSTRB is trading at $118.99 on Binance Spot (MSTRB/USDT), down 2.88 % over the past 24 hours. Volume remains modest, suggesting the move is price‑driven rather than liquidity‑fueled.
Why it matters – Strategy Inc’s AI‑driven data platform remains a bellwether for the enterprise‑software sector, and any breach of support could signal broader risk‑off pressure on tech equities.
Key levels – Immediate support sits at $115.00, a historic floor that held during the Q1 pullback. Resistance lies at $123.50, the prior swing high, with a mid‑range pivot around $119.75 offering a potential bounce point.
Short outlook – From a support‑defense perspective, buyers need to defend the $115 level; failure would open the path to $110 and deeper downside. Holding the floor could stabilize the token and set the stage for a test of $123.50.
#MSTRB #Stocks #BinanceSquare
26


·
--
🔍 $MSTRB 跌幅拆解
5分钟:-0.10%
1h:-0.04%
4h:-0.04%
24h:-3.62%
现价 121.53,24h 成交额 $960万
单日重挫 -3.62%,下杀没有集中在某个短周期,更像全天缓慢走弱。
你觉得这是情绪出逃还是趋势走坏? 👇
(数据拆解,非投资建议,DYOR)
#MSTRB
🔍 $MSTRB 跌幅拆解
5分钟:-0.10%
1h:-0.04%
4h:-0.04%
24h:-3.62%
现价 121.53,24h 成交额 $960万
单日重挫 -3.62%,下杀没有集中在某个短周期,更像全天缓慢走弱。
你觉得这是情绪出逃还是趋势走坏? 👇
(数据拆解,非投资建议,DYOR)
#MSTRB
5分钟:-0.10%
1h:-0.04%
4h:-0.04%
24h:-3.62%
现价 121.53,24h 成交额 $960万
单日重挫 -3.62%,下杀没有集中在某个短周期,更像全天缓慢走弱。
你觉得这是情绪出逃还是趋势走坏? 👇
(数据拆解,非投资建议,DYOR)
#MSTRB
11


·
--
$MSTRB 失守 30日低点:现价 121.12,前低 122。
破位之后看两件事:
· 前低 122 会不会从支撑转为压力(反抽站不回)
· 跌破时是否量能放大,缩量跌破可能只是诱空
评论区写下你的判断,回头对答案。
#MSTRB
$MSTRB 失守 30日低点:现价 121.12,前低 122。
破位之后看两件事:
· 前低 122 会不会从支撑转为压力(反抽站不回)
· 跌破时是否量能放大,缩量跌破可能只是诱空
评论区写下你的判断,回头对答案。
#MSTRB
破位之后看两件事:
· 前低 122 会不会从支撑转为压力(反抽站不回)
· 跌破时是否量能放大,缩量跌破可能只是诱空
评论区写下你的判断,回头对答案。
#MSTRB
11
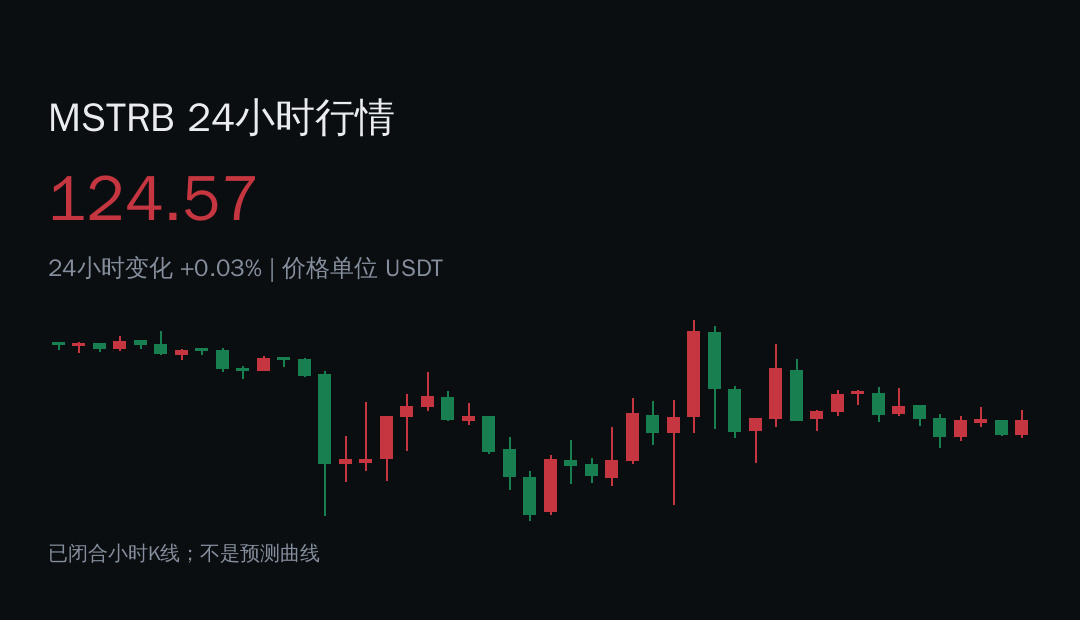
$MSTRB: Standardized Observation Baselines: A Risk‑Focused Thought Experiment
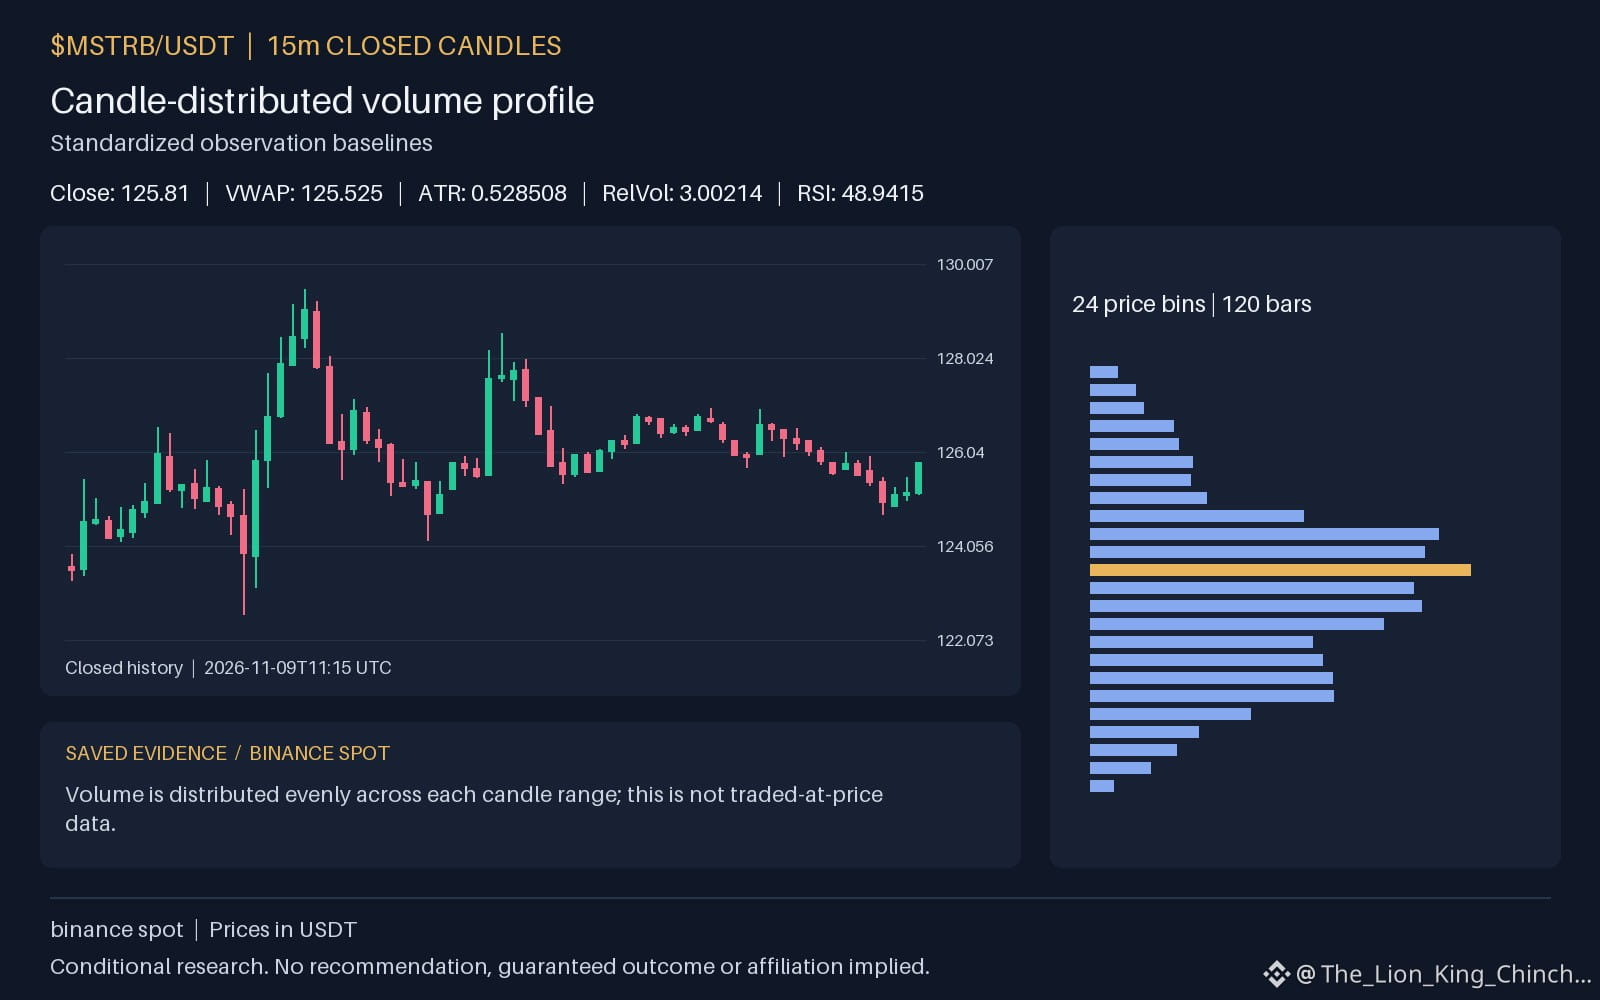
Imagine a researcher who decides whether to enter a trade based on a single hourly signal that shows the price 125.81 moving up while volume sits above its baseline. The researcher faces a practical trade‑off: should they act immediately to capture the early move, or wait for a second confirmation that the price stays above the moving average 125.808 for a full hour?
In the first scenario, entry quality may suffer because the signal could be a transient spike; the risk is that a stop placed at a distance of one atr 0.528508 might be hit quickly. In the second scenario, waiting improves entry quality but also reduces the potential reward if the momentum fades.
A counterexample shows that even when the relative volume 3.00214 is high, the price may revert to the support 124.72 level within the next four hours, invalidating the trade despite strong initial volume.
Self‑check: if the hypothesis that "baseline consistency improves signal reliability" is false, the researcher would observe frequent false breakouts and would need to adjust the baseline period rather than chase each spike. This illustrates how standardized observation baselines can highlight the balance between chasing and waiting, without asserting any specific outcome for $MSTRB.
Probabilistic market research, not a recommendation or guaranteed return.
The comparison to keep in mind: $ETH has hourly direction up and volume above its baseline; $INIT has hourly direction up and volume above its baseline. This alone does not establish correlation.
Do you keep your core indicator periods fixed for months so your eye calibrates to them, or do you tweak settings frequently?
#MSTRB #ETH #INIT #RiskManagement #CryptoLearning
Binance spot proof for $MSTRB: closed price 125.81 USDT.
Source: binance. Closed candle: 2026-11-10T04:30:00+00:00.
$MSTRB : Standardized Observation Baselines: A Risk‑Focused Thought Experiment
Imagine a researcher who decides whether to enter a trade based on a single hourly signal that shows the price 125.81 moving up while volume sits above its baseline. The researcher faces a practical trade‑off: should they act immediately to capture the early move, or wait for a second confirmation that the price stays above the moving average 125.808 for a full hour?
In the first scenario, entry quality may suffer because the signal could be a transient spike; the risk is that a stop placed at a distance of one atr 0.528508 might be hit quickly. In the second scenario, waiting improves entry quality but also reduces the potential reward if the momentum fades.
A counterexample shows that even when the relative volume 3.00214 is high, the price may revert to the support 124.72 level within the next four hours, invalidating the trade despite strong initial volume.
Self‑check: if the hypothesis that "baseline consistency improves signal reliability" is false, the researcher would observe frequent false breakouts and would need to adjust the baseline period rather than chase each spike. This illustrates how standardized observation baselines can highlight the balance between chasing and waiting, without asserting any specific outcome for $MSTRB .
Probabilistic market research, not a recommendation or guaranteed return.
The comparison to keep in mind: $ETH has hourly direction up and volume above its baseline; $INIT has hourly direction up and volume above its baseline. This alone does not establish correlation.
Do you keep your core indicator periods fixed for months so your eye calibrates to them, or do you tweak settings frequently?
#MSTRB #ETH #INIT #RiskManagement #CryptoLearning
Binance spot proof for $MSTRB : closed price 125.81 USDT.
Source: binance. Closed candle: 2026-11-10T04:30:00+00:00.
Imagine a researcher who decides whether to enter a trade based on a single hourly signal that shows the price 125.81 moving up while volume sits above its baseline. The researcher faces a practical trade‑off: should they act immediately to capture the early move, or wait for a second confirmation that the price stays above the moving average 125.808 for a full hour?
In the first scenario, entry quality may suffer because the signal could be a transient spike; the risk is that a stop placed at a distance of one atr 0.528508 might be hit quickly. In the second scenario, waiting improves entry quality but also reduces the potential reward if the momentum fades.
A counterexample shows that even when the relative volume 3.00214 is high, the price may revert to the support 124.72 level within the next four hours, invalidating the trade despite strong initial volume.
Self‑check: if the hypothesis that "baseline consistency improves signal reliability" is false, the researcher would observe frequent false breakouts and would need to adjust the baseline period rather than chase each spike. This illustrates how standardized observation baselines can highlight the balance between chasing and waiting, without asserting any specific outcome for $MSTRB .
Probabilistic market research, not a recommendation or guaranteed return.
The comparison to keep in mind: $ETH has hourly direction up and volume above its baseline; $INIT has hourly direction up and volume above its baseline. This alone does not establish correlation.
Do you keep your core indicator periods fixed for months so your eye calibrates to them, or do you tweak settings frequently?
#MSTRB #ETH #INIT #RiskManagement #CryptoLearning
Binance spot proof for $MSTRB : closed price 125.81 USDT.
Source: binance. Closed candle: 2026-11-10T04:30:00+00:00.
35


·
--
Volume surged 2.24x above average as $MSTRB pulled back 3.75% to $123.58.
The recent hourly drop reflects heavy supply pressure near the upper 129.03 range boundary.
If buying pressure returns and reclaims 122.27 on rising volume, a retest of higher levels becomes possible.
Conversely, a sustained move below the 122.23 range low invalidates the near-term recovery scenario.
Will you wait for a confirmed reclaim of 122.27 or watch for a breakdown below 122.23?
Tap $MSTRB for the live chart. #MSTRB #BinanceSquare
Volume surged 2.24x above average as $MSTRB pulled back 3.75% to $123.58.
The recent hourly drop reflects heavy supply pressure near the upper 129.03 range boundary.
If buying pressure returns and reclaims 122.27 on rising volume, a retest of higher levels becomes possible.
Conversely, a sustained move below the 122.23 range low invalidates the near-term recovery scenario.
Will you wait for a confirmed reclaim of 122.27 or watch for a breakdown below 122.23?
Tap $MSTRB for the live chart. #MSTRB #BinanceSquare
The recent hourly drop reflects heavy supply pressure near the upper 129.03 range boundary.
If buying pressure returns and reclaims 122.27 on rising volume, a retest of higher levels becomes possible.
Conversely, a sustained move below the 122.23 range low invalidates the near-term recovery scenario.
Will you wait for a confirmed reclaim of 122.27 or watch for a breakdown below 122.23?
Tap $MSTRB for the live chart. #MSTRB #BinanceSquare
2

·
--
📊 Market Analysis – November 7, 2026
🔥 $MSTRB : MSTRB is trading near $128.99. Buyers need to reclaim $132.13 to strengthen bullish momentum, while $125.80 remains key support.
💎 $ADA : Cardano is trading around $0.1849. A breakout above $0.1889 could trigger a recovery, while $0.1814 is an important support zone.
🚀 $AVAX : Avalanche is trading near $8.33. Bulls need to break $8.52 for stronger upside momentum, while $8.21 remains key support.
Market Outlook: All three assets need stronger buying pressure. Watch resistance breakouts, trading volume, and support levels before entering positions.
#MSTRB #ADA #AVAX #CryptoAnalysis #Trading #MarketUpdate
{spot}(MSTRBUSDT)
{future}(ADAUSDT)
{future}(AVAXUSDT)
📊 Market Analysis – November 7, 2026
🔥 $MSTRB : MSTRB is trading near $128.99. Buyers need to reclaim $132.13 to strengthen bullish momentum, while $125.80 remains key support.
💎 $ADA : Cardano is trading around $0.1849. A breakout above $0.1889 could trigger a recovery, while $0.1814 is an important support zone.
🚀 $AVAX : Avalanche is trading near $8.33. Bulls need to break $8.52 for stronger upside momentum, while $8.21 remains key support.
Market Outlook: All three assets need stronger buying pressure. Watch resistance breakouts, trading volume, and support levels before entering positions.
#MSTRB #ADA #AVAX #CryptoAnalysis #Trading #MarketUpdate
🔥 $MSTRB : MSTRB is trading near $128.99. Buyers need to reclaim $132.13 to strengthen bullish momentum, while $125.80 remains key support.
💎 $ADA : Cardano is trading around $0.1849. A breakout above $0.1889 could trigger a recovery, while $0.1814 is an important support zone.
🚀 $AVAX : Avalanche is trading near $8.33. Bulls need to break $8.52 for stronger upside momentum, while $8.21 remains key support.
Market Outlook: All three assets need stronger buying pressure. Watch resistance breakouts, trading volume, and support levels before entering positions.
#MSTRB #ADA #AVAX #CryptoAnalysis #Trading #MarketUpdate

15

$MSTRB is testing major support zone right now ⚠️
Intense selling pressure noticed, but order book depth shows strong buyer defense near the lows ($25.2M volume).
Key levels on my radar:
• Live Price: $130.33 (-8.35%)
• Rebound Target: $142.32
• Breakdown Level: $124.14
Always wait for 15m candle confirmation before entering. Do not chase green candles blindly.
Are you adding here or waiting for a dip? Let me know below 👇
#MSTRB #BinanceSquare #Crypto
$MSTRB is testing major support zone right now ⚠️
Intense selling pressure noticed, but order book depth shows strong buyer defense near the lows ($25.2M volume).
Key levels on my radar:
• Live Price: $130.33 (-8.35%)
• Rebound Target: $142.32
• Breakdown Level: $124.14
Always wait for 15m candle confirmation before entering. Do not chase green candles blindly.
Are you adding here or waiting for a dip? Let me know below 👇
#MSTRB #BinanceSquare #Crypto
Intense selling pressure noticed, but order book depth shows strong buyer defense near the lows ($25.2M volume).
Key levels on my radar:
• Live Price: $130.33 (-8.35%)
• Rebound Target: $142.32
• Breakdown Level: $124.14
Always wait for 15m candle confirmation before entering. Do not chase green candles blindly.
Are you adding here or waiting for a dip? Let me know below 👇
#MSTRB #BinanceSquare #Crypto
8

·
--
说实话这个位置我不太敢乱动。$MSTRB 一天跌了 8.43%,报 131.08,24 小时成交额 25.0 百万美元,卖盘是实打实的。
方向是观察做空:参考区间 131.08–133.83,失效位在 133.83 上方,目标位 124.14,风险等级高,盈亏比约 2.5。反弹摸到 133.83 附近还站不稳,空头大概率继续接力;站回 133.83,我这判断就作废。
我的倾向是等反弹到区间上沿再观察,地板上追空最难受;但要是它直接跌破 124.14,我就得改口,空头动能比我想的还强。
做空做到这个位置,你们觉得是顺势,还是已经在追尾了?
仅供参考,非投资建议,注意仓位管理。
#MSTRB #交易机会
说实话这个位置我不太敢乱动。$MSTRB 一天跌了 8.43%,报 131.08,24 小时成交额 25.0 百万美元,卖盘是实打实的。
方向是观察做空:参考区间 131.08–133.83,失效位在 133.83 上方,目标位 124.14,风险等级高,盈亏比约 2.5。反弹摸到 133.83 附近还站不稳,空头大概率继续接力;站回 133.83,我这判断就作废。
我的倾向是等反弹到区间上沿再观察,地板上追空最难受;但要是它直接跌破 124.14,我就得改口,空头动能比我想的还强。
做空做到这个位置,你们觉得是顺势,还是已经在追尾了?
仅供参考,非投资建议,注意仓位管理。
#MSTRB #交易机会
方向是观察做空:参考区间 131.08–133.83,失效位在 133.83 上方,目标位 124.14,风险等级高,盈亏比约 2.5。反弹摸到 133.83 附近还站不稳,空头大概率继续接力;站回 133.83,我这判断就作废。
我的倾向是等反弹到区间上沿再观察,地板上追空最难受;但要是它直接跌破 124.14,我就得改口,空头动能比我想的还强。
做空做到这个位置,你们觉得是顺势,还是已经在追尾了?
仅供参考,非投资建议,注意仓位管理。
#MSTRB #交易机会
15

·
--
先给结论:MSTRB 这一段是放量下杀,反弹还没确认,别急着抄。
盘面数据:现价 129.13,24 小时-9.56%,成交额 0.22 亿 USDT,日内高 144.6、低 124.14,振幅 16.5%。
现价在区间中下部(24%),重心在下移,多头接得比较勉强。
价格跌破 7 日均线(133.7),位于 25 日均线(139.7548)下方,短期结构已经转弱。
位置上看,距 30 日高点 159.14 回撤 18.9%,30 日低点在 124.14,7 日累计 -2.4%。
明显放量,说明这一段是有真金白银在换手。
关键位很清楚:上方 144.6 是日内高点形成的压力,下方 124.14 是短期防守位;破掉后者,下方空间才会真正打开。
接下来盯两件事:4 小时级别有没有出现缩量止跌的形态;能否站回 7 日均线,是判断这波调整结束的第一个信号。
这波你抓到哪一段,又错过了哪一段?
(以上为盘面复盘记录,不构成任何投资建议,合约有风险)
#MSTRB #技术分析 #K线复盘
先给结论:MSTRB 这一段是放量下杀,反弹还没确认,别急着抄。
盘面数据:现价 129.13,24 小时-9.56%,成交额 0.22 亿 USDT,日内高 144.6、低 124.14,振幅 16.5%。
现价在区间中下部(24%),重心在下移,多头接得比较勉强。
价格跌破 7 日均线(133.7),位于 25 日均线(139.7548)下方,短期结构已经转弱。
位置上看,距 30 日高点 159.14 回撤 18.9%,30 日低点在 124.14,7 日累计 -2.4%。
明显放量,说明这一段是有真金白银在换手。
关键位很清楚:上方 144.6 是日内高点形成的压力,下方 124.14 是短期防守位;破掉后者,下方空间才会真正打开。
接下来盯两件事:4 小时级别有没有出现缩量止跌的形态;能否站回 7 日均线,是判断这波调整结束的第一个信号。
这波你抓到哪一段,又错过了哪一段?
(以上为盘面复盘记录,不构成任何投资建议,合约有风险)
#MSTRB #技术分析 #K线复盘
盘面数据:现价 129.13,24 小时-9.56%,成交额 0.22 亿 USDT,日内高 144.6、低 124.14,振幅 16.5%。
现价在区间中下部(24%),重心在下移,多头接得比较勉强。
价格跌破 7 日均线(133.7),位于 25 日均线(139.7548)下方,短期结构已经转弱。
位置上看,距 30 日高点 159.14 回撤 18.9%,30 日低点在 124.14,7 日累计 -2.4%。
明显放量,说明这一段是有真金白银在换手。
关键位很清楚:上方 144.6 是日内高点形成的压力,下方 124.14 是短期防守位;破掉后者,下方空间才会真正打开。
接下来盯两件事:4 小时级别有没有出现缩量止跌的形态;能否站回 7 日均线,是判断这波调整结束的第一个信号。
这波你抓到哪一段,又错过了哪一段?
(以上为盘面复盘记录,不构成任何投资建议,合约有风险)
#MSTRB #技术分析 #K线复盘
279
·
--
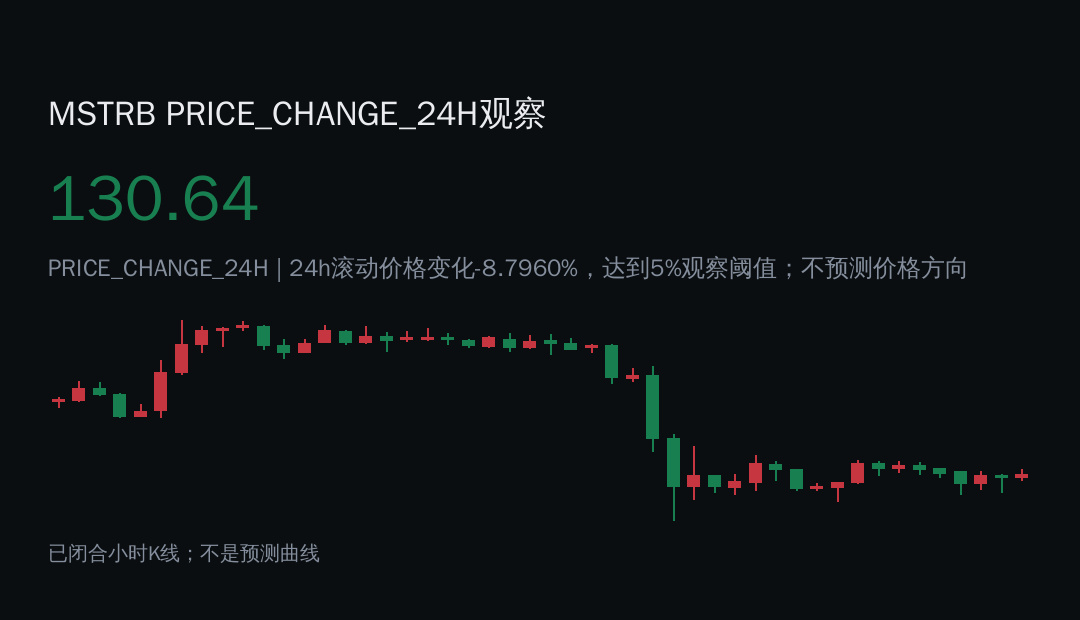
A 10.71% daily drop to $129.59 tests buyer resolve.
Volume sits at $20.05M with the latest hourly change showing a modest 0.29% uptick as price stabilizes near the lower boundary of its recent $124.14 to $145.22 range.
If buyers defend the lower boundary and volume expands above recent averages, a push back toward the middle of the range becomes plausible. Conversely, a drop below the $124.14 low invalidates this stabilization attempt.
Will you wait for a confirmed reclaim of the range midpoint before acting, or does breaking the $124.14 low signal deeper downside risk for $MSTRB?
Tap $MSTRB for the live chart. #MSTRB #BinanceSquare
A 10.71% daily drop to $129.59 tests buyer resolve.
Volume sits at $20.05M with the latest hourly change showing a modest 0.29% uptick as price stabilizes near the lower boundary of its recent $124.14 to $145.22 range.
If buyers defend the lower boundary and volume expands above recent averages, a push back toward the middle of the range becomes plausible. Conversely, a drop below the $124.14 low invalidates this stabilization attempt.
Will you wait for a confirmed reclaim of the range midpoint before acting, or does breaking the $124.14 low signal deeper downside risk for $MSTRB ?
Tap $MSTRB for the live chart. #MSTRB #BinanceSquare
Volume sits at $20.05M with the latest hourly change showing a modest 0.29% uptick as price stabilizes near the lower boundary of its recent $124.14 to $145.22 range.
If buyers defend the lower boundary and volume expands above recent averages, a push back toward the middle of the range becomes plausible. Conversely, a drop below the $124.14 low invalidates this stabilization attempt.
Will you wait for a confirmed reclaim of the range midpoint before acting, or does breaking the $124.14 low signal deeper downside risk for $MSTRB ?
Tap $MSTRB for the live chart. #MSTRB #BinanceSquare
2
·
--
$MSTRB dropped 9.96% to $129.04 on $18.34M daily volume. 📊
The recent hourly close at $130.32 shows minor stabilization after testing the lower boundary of its 24-hour range near 124.14.
If buyers defend the recent session low and reclaim the $145.54 upper range boundary, upside momentum could resume. However, failing to hold the 124.14 level invalidates the bounce scenario and signals further downside risk.
Will you wait for a confirmed reclaim of the upper boundary, or does losing the range low signal a deeper correction?
Tap $MSTRB for the live chart. #MSTRB #BinanceSquare
$MSTRB dropped 9.96% to $129.04 on $18.34M daily volume. 📊
The recent hourly close at $130.32 shows minor stabilization after testing the lower boundary of its 24-hour range near 124.14.
If buyers defend the recent session low and reclaim the $145.54 upper range boundary, upside momentum could resume. However, failing to hold the 124.14 level invalidates the bounce scenario and signals further downside risk.
Will you wait for a confirmed reclaim of the upper boundary, or does losing the range low signal a deeper correction?
Tap $MSTRB for the live chart. #MSTRB #BinanceSquare
The recent hourly close at $130.32 shows minor stabilization after testing the lower boundary of its 24-hour range near 124.14.
If buyers defend the recent session low and reclaim the $145.54 upper range boundary, upside momentum could resume. However, failing to hold the 124.14 level invalidates the bounce scenario and signals further downside risk.
Will you wait for a confirmed reclaim of the upper boundary, or does losing the range low signal a deeper correction?
Tap $MSTRB for the live chart. #MSTRB #BinanceSquare
1
Көбірек контент көру үшін кіріңіз
Binance Square платформасында әлемдік криптоқоғамдастыққа қосылыңыз
⚡️ Криптовалюта туралы ең соңғы және пайдалы ақпаратты алыңыз.
💬 Әлемдегі ең ірі криптобиржаның сеніміне ие.
👍 Расталған авторлардың нақты пікірлерін табыңыз.
Электрондық пошта/телефон нөмірі
Трендтегі тақырыптар
1
#HuangExitNvidiaStrategyInFocus
53,976 рет көрілді
754 адам талқылап жатыр
2
#AnthropicRejectsIPODelayValuationinQuestion
639,607 рет көрілді
5,050 адам талқылап жатыр
3
#BitMineReports$6.3BNetLossForFiscal2026
6,462 рет көрілді
94 адам талқылап жатыр
4
#ChipStocksExtendLossesAfterNvidiaCEOChange
19,685 рет көрілді
336 адам талқылап жатыр
5
#ThailandProposes$148KDailyStablecoinDepositWithdrawalCaps
1,714 рет көрілді
30 адам талқылап жатыр
6
#CoreWeaveJumps10%On168%RevenueGrowth
158,668 рет көрілді
1,570 адам талқылап жатыр
7
#ZcashFallsBelow$1000ForFirstTimeSinceSeptember
77,254 рет көрілді
256 адам талқылап жатыр
8
#MSCIRemovalMayCurbStrategy’sBitcoinBuying
40,686 рет көрілді
528 адам талқылап жатыр
9
#TradFiForBeginners
517,778 рет көрілді
3,618 адам талқылап жатыр
10
#USJoblessClaimsRise
19.1M рет көрілді
7,736 адам талқылап жатыр