
#ftxrefunds
ftxrefunds
5.7M рет көрілді
8,370 адам талқылап жатыр
Қызу саудада
Ең соңғы

·
--
Жоғары (өспелі)
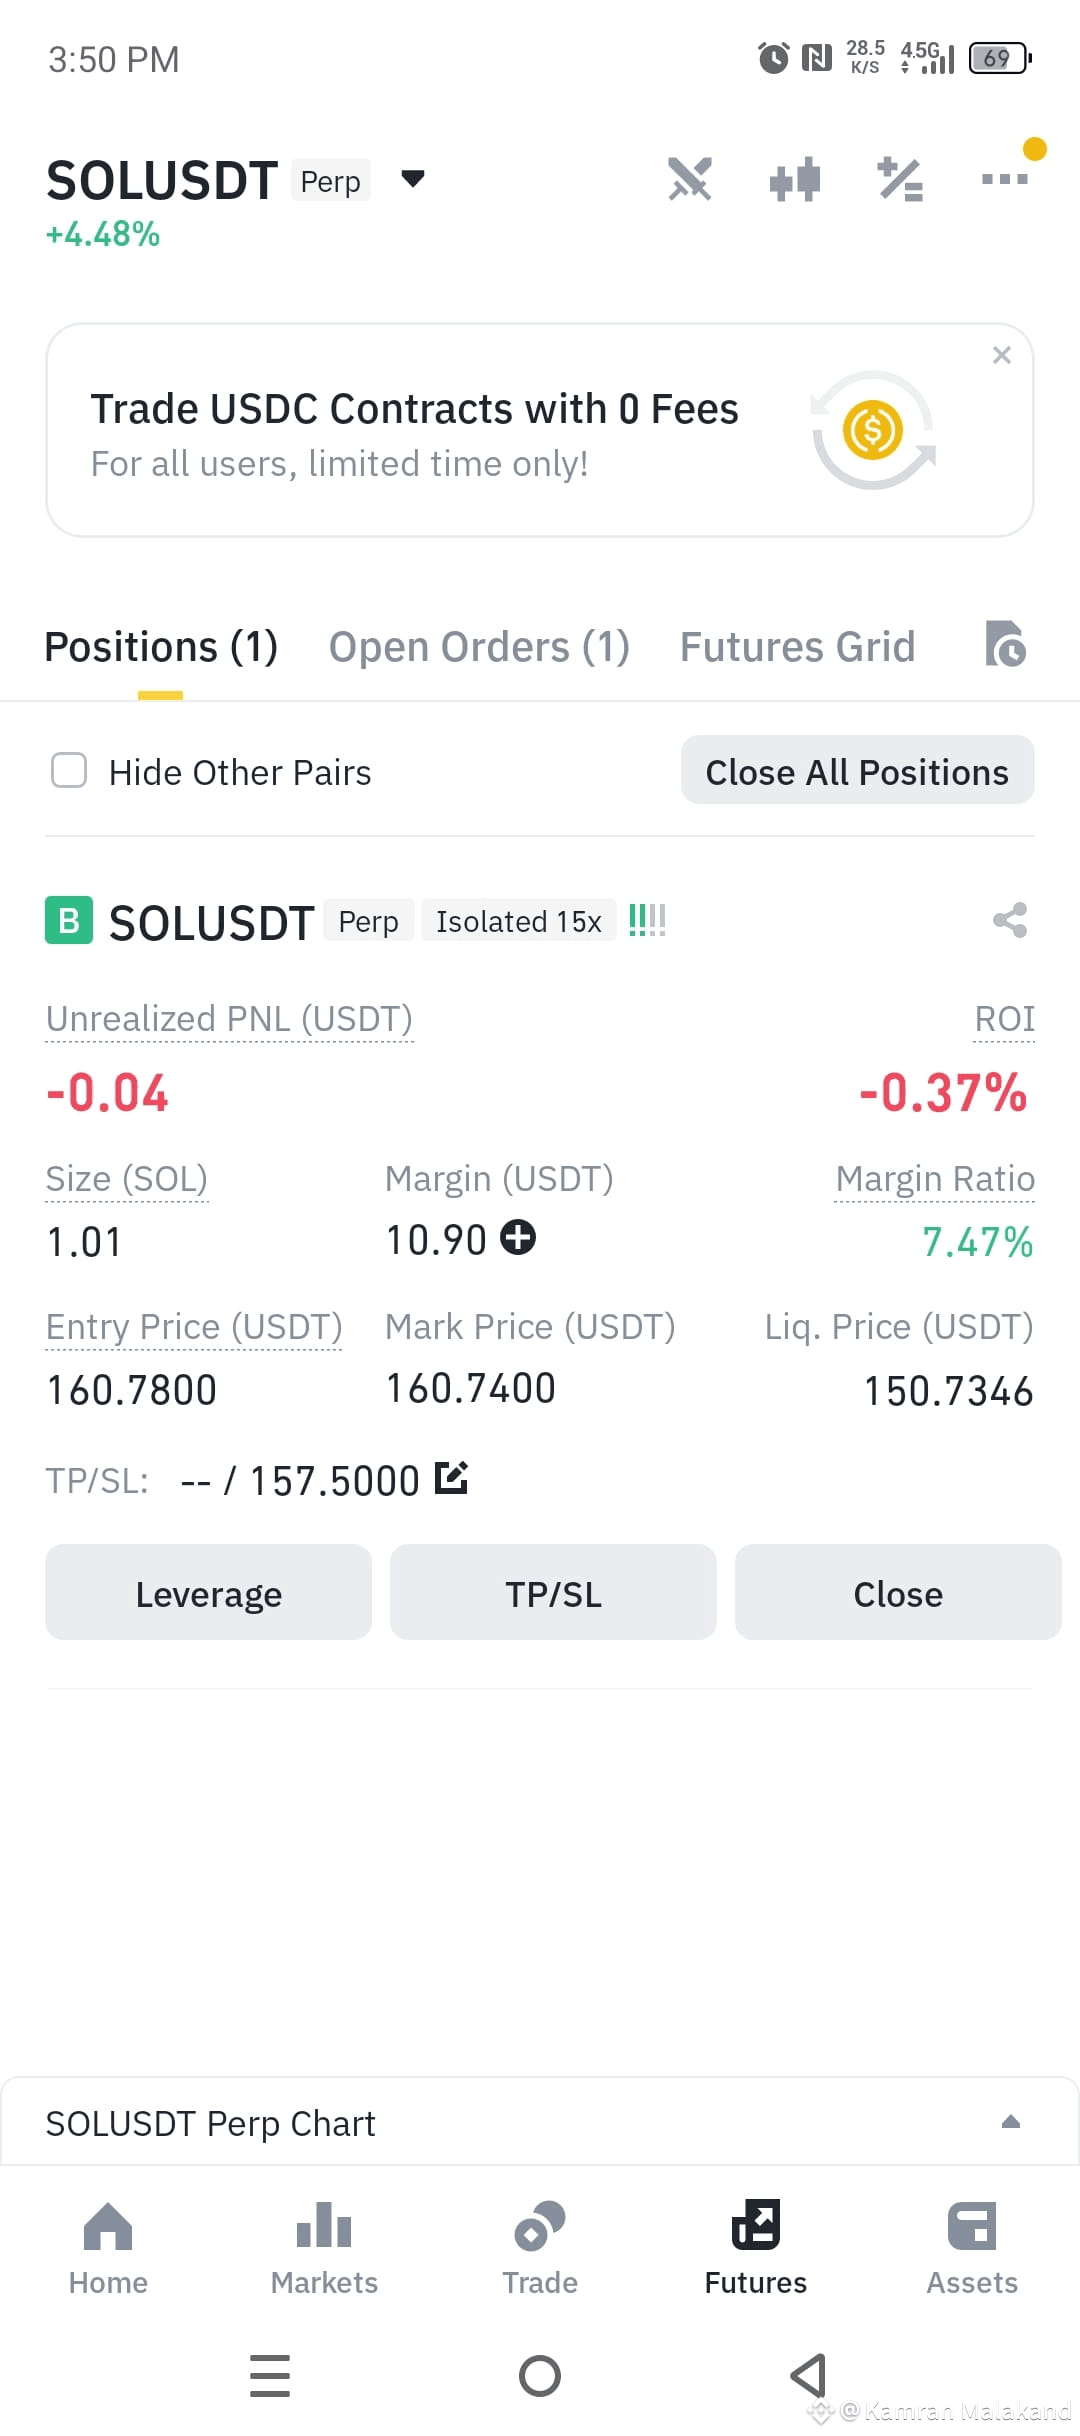
"Solana is up, in the middle, or down? Please comment."#MyCOSTrade #FTXRefunds #TrumpMediaBitcoinTreasury #SaylorBTCPurchase #MarketPullback $SOL
"Solana is up, in the middle, or down? Please comment."#MyCOSTrade #FTXRefunds #TrumpMediaBitcoinTreasury #SaylorBTCPurchase #MarketPullback $SOL
91

·
--
$ETH
{spot}(ETHUSDT)
+4
📊 Trading Signal
Signal: Bullish
Entry Zone: $2,520–$2,536
Take Profit Targets:
TP1: $2,600
TP2: $2,800
Stop Loss: $2,450
#FTXRefunds
$ETH
+4
📊 Trading Signal
Signal: Bullish
Entry Zone: $2,520–$2,536
Take Profit Targets:
TP1: $2,600
TP2: $2,800
Stop Loss: $2,450
#FTXRefunds
+4
📊 Trading Signal
Signal: Bullish
Entry Zone: $2,520–$2,536
Take Profit Targets:
TP1: $2,600
TP2: $2,800
Stop Loss: $2,450
#FTXRefunds
1
1
619


·
--
Жоғары (өспелі)
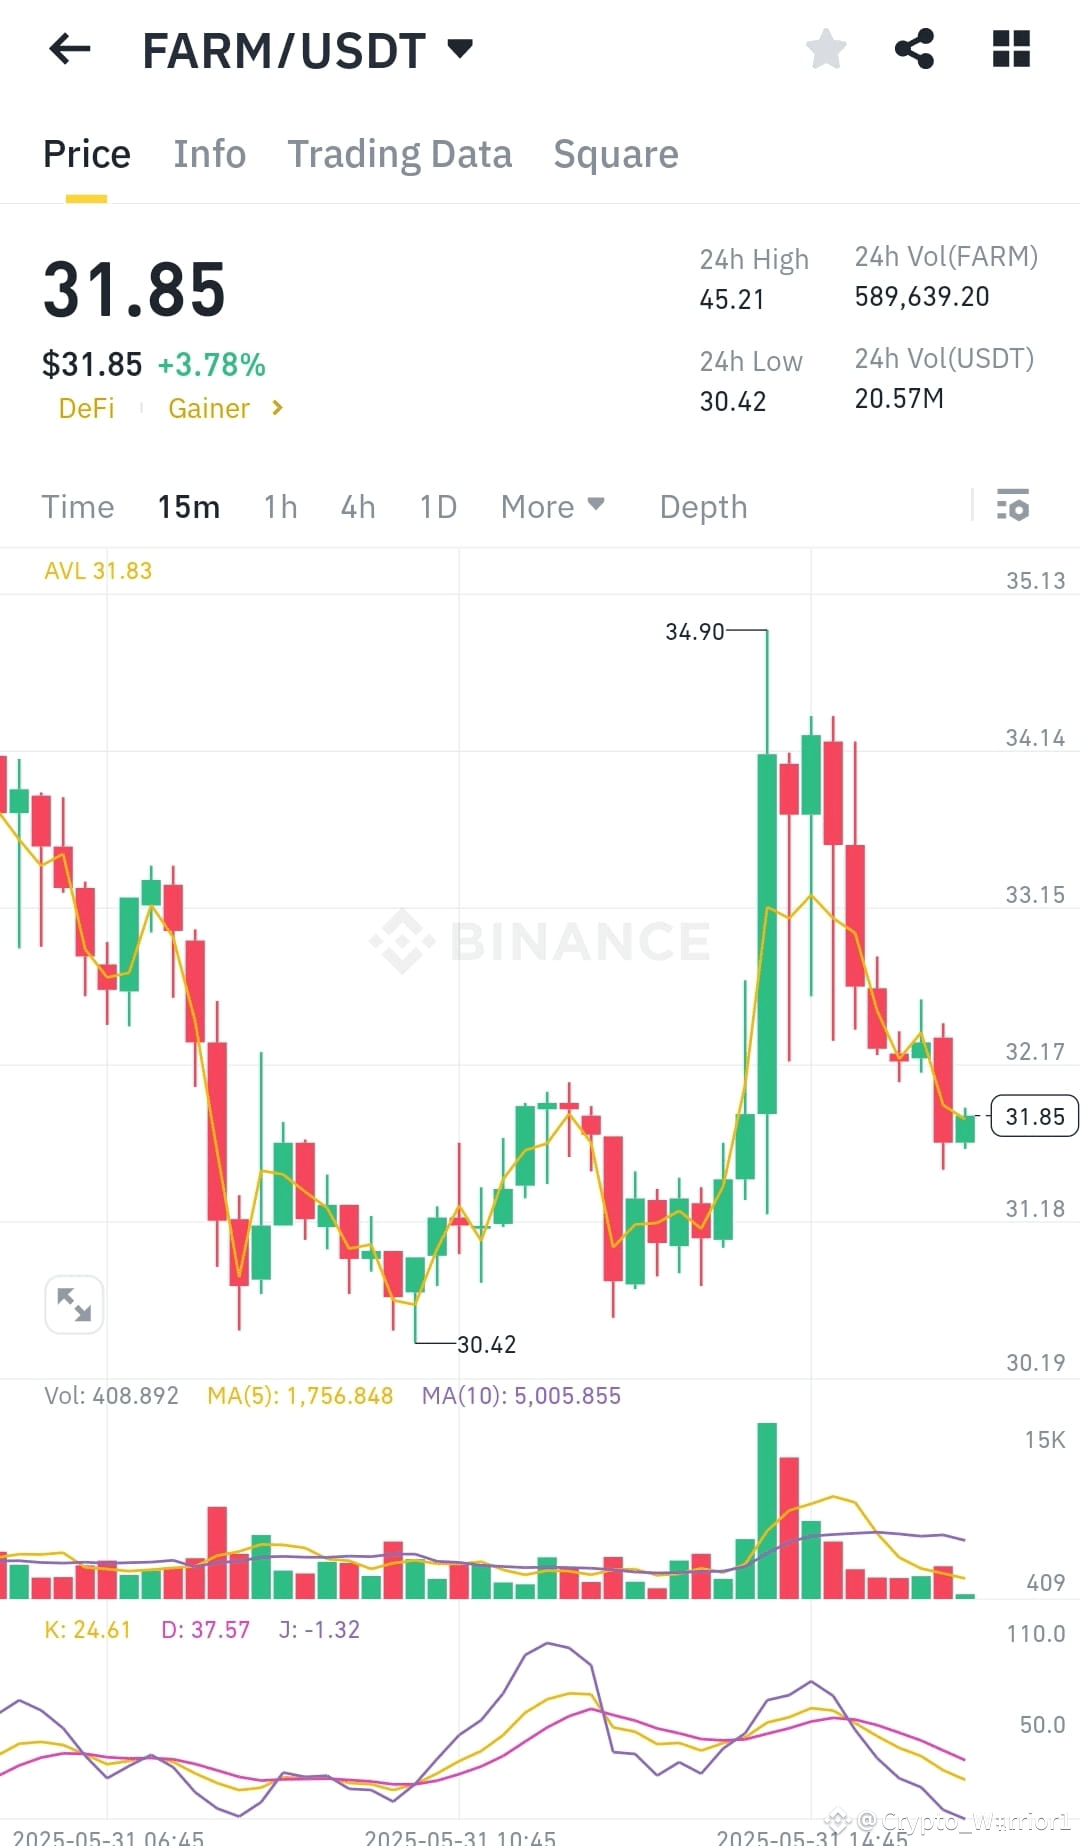
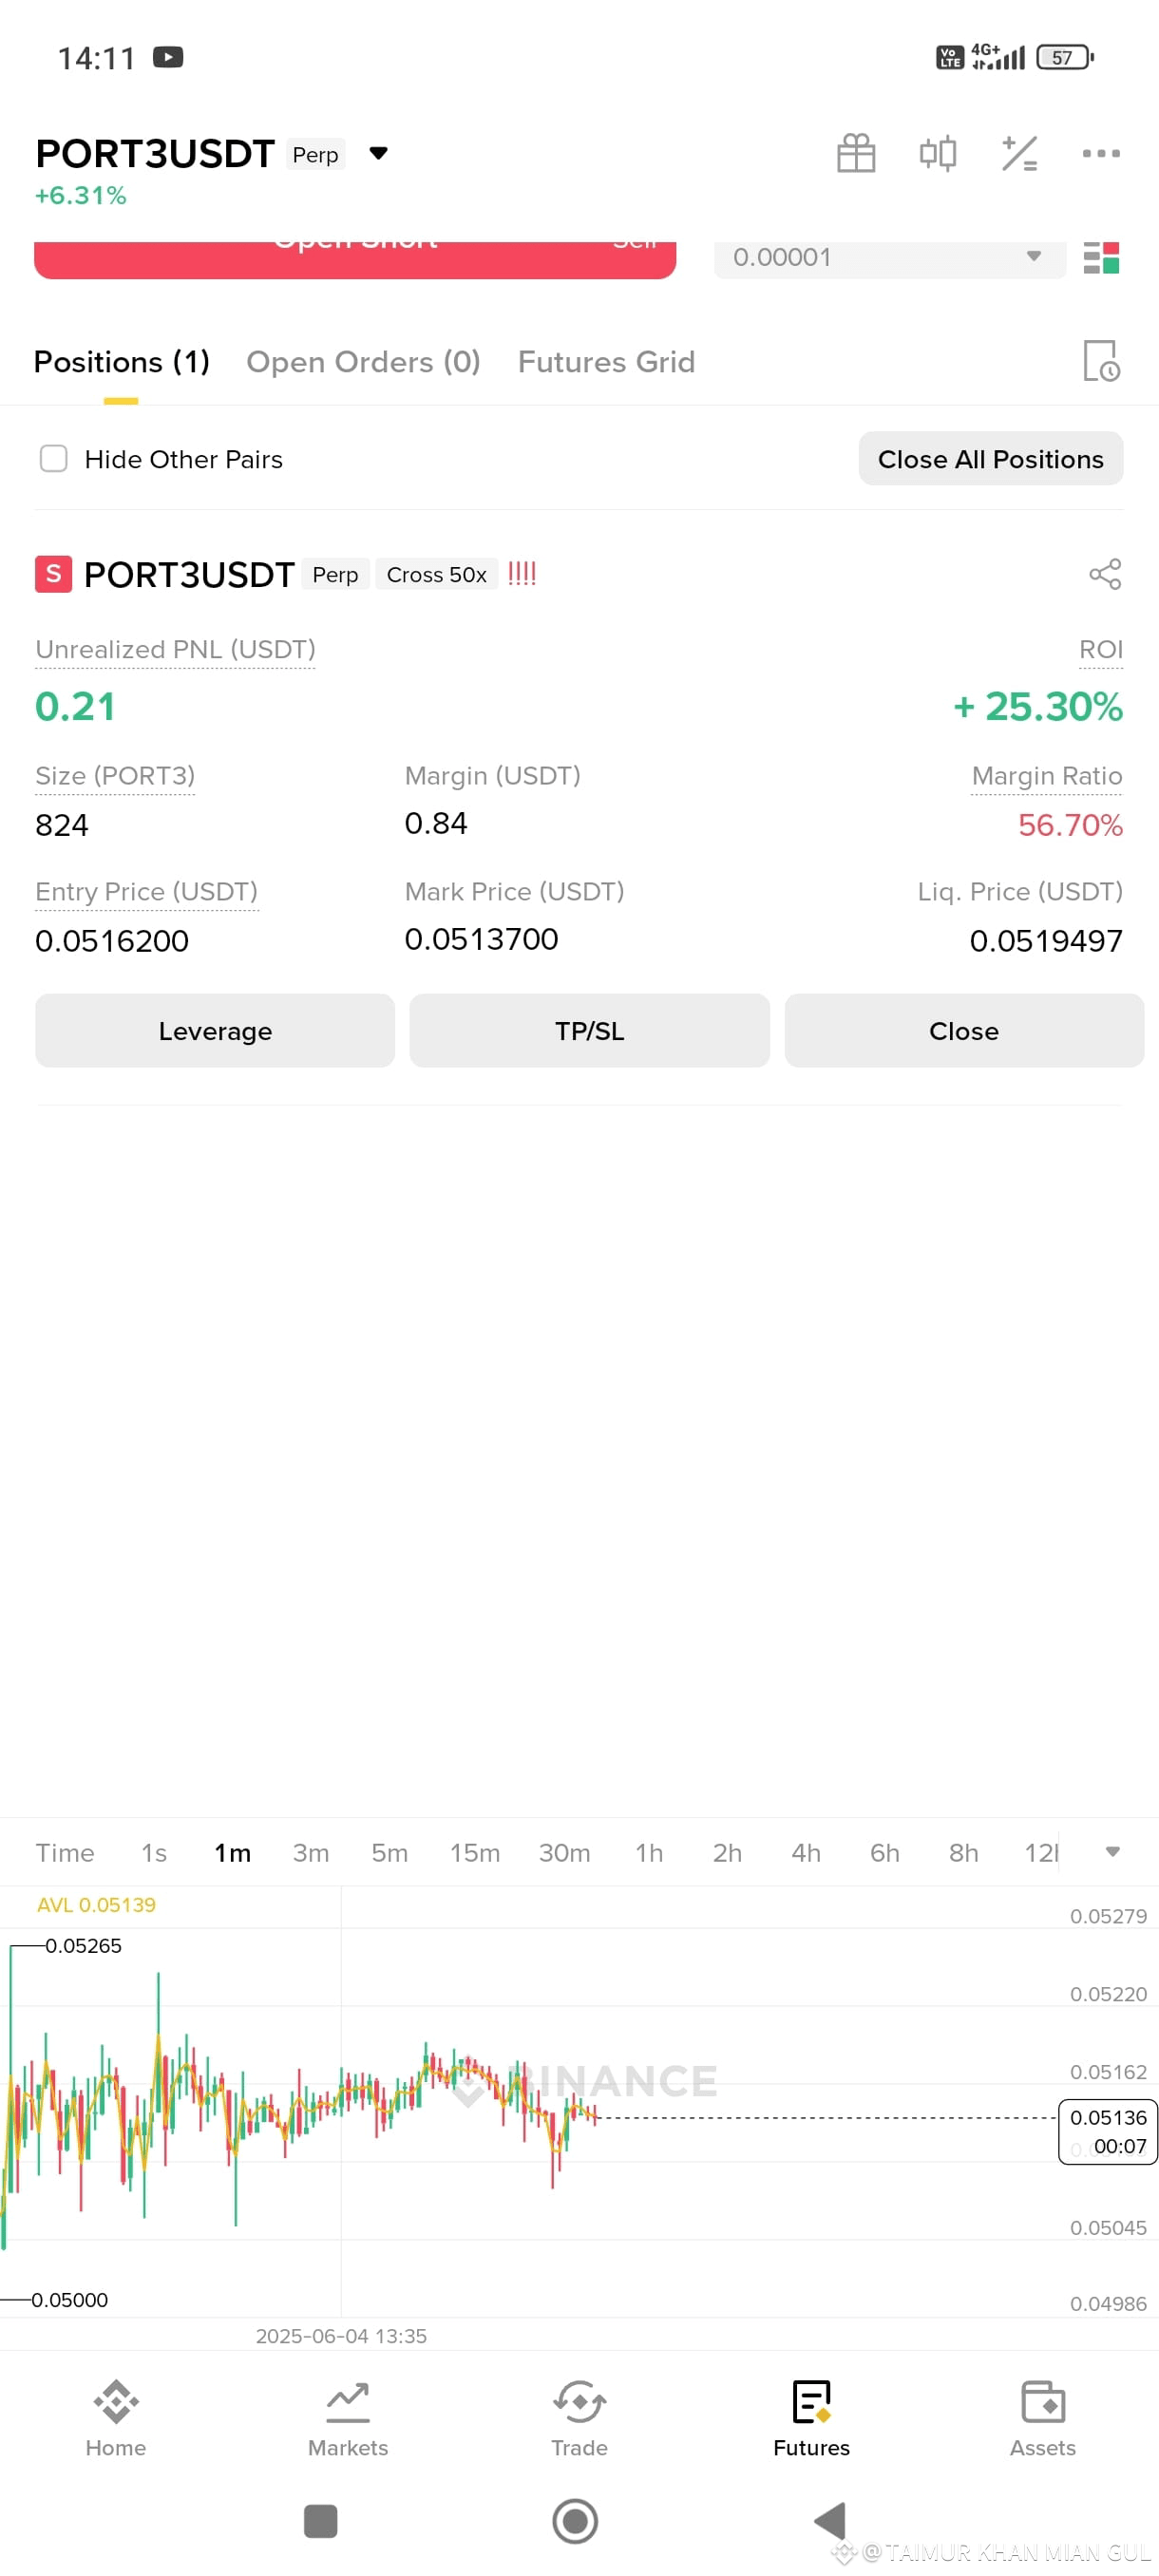
I’m eyeing a $FARM short. That pump to $34.80 got slapped down fast.
Price is fading, lower highs on the 15m, looks weak.
My Setup:
Short: $32.00 – $33.20
SL: $34.50
TP1: $31.00
TP2: $29.80
TP3: $28.40
If it bounces to $32.50 and stalls, I’m in. Momentum’s shifting.
{spot}(FARMUSDT)
#CEXvsDEX101 #TradingTypes101 #FTXRefunds #TrumpMediaBitcoinTreasury #ElonMuskDOGEDeparture
I’m eyeing a $FARM short. That pump to $34.80 got slapped down fast.
Price is fading, lower highs on the 15m, looks weak.
My Setup:
Short: $32.00 – $33.20
SL: $34.50
TP1: $31.00
TP2: $29.80
TP3: $28.40
If it bounces to $32.50 and stalls, I’m in. Momentum’s shifting.
#CEXvsDEX101 #TradingTypes101 #FTXRefunds #TrumpMediaBitcoinTreasury #ElonMuskDOGEDeparture
Price is fading, lower highs on the 15m, looks weak.
My Setup:
Short: $32.00 – $33.20
SL: $34.50
TP1: $31.00
TP2: $29.80
TP3: $28.40
If it bounces to $32.50 and stalls, I’m in. Momentum’s shifting.
#CEXvsDEX101 #TradingTypes101 #FTXRefunds #TrumpMediaBitcoinTreasury #ElonMuskDOGEDeparture
2.2k
1.1k
185
2.2k


·
--
Жоғары (өспелі)
#MyCOSTrade #DEXE/USDT #MarketRebound #EDGENLiveOnAlpha #FTXRefunds $DEXE
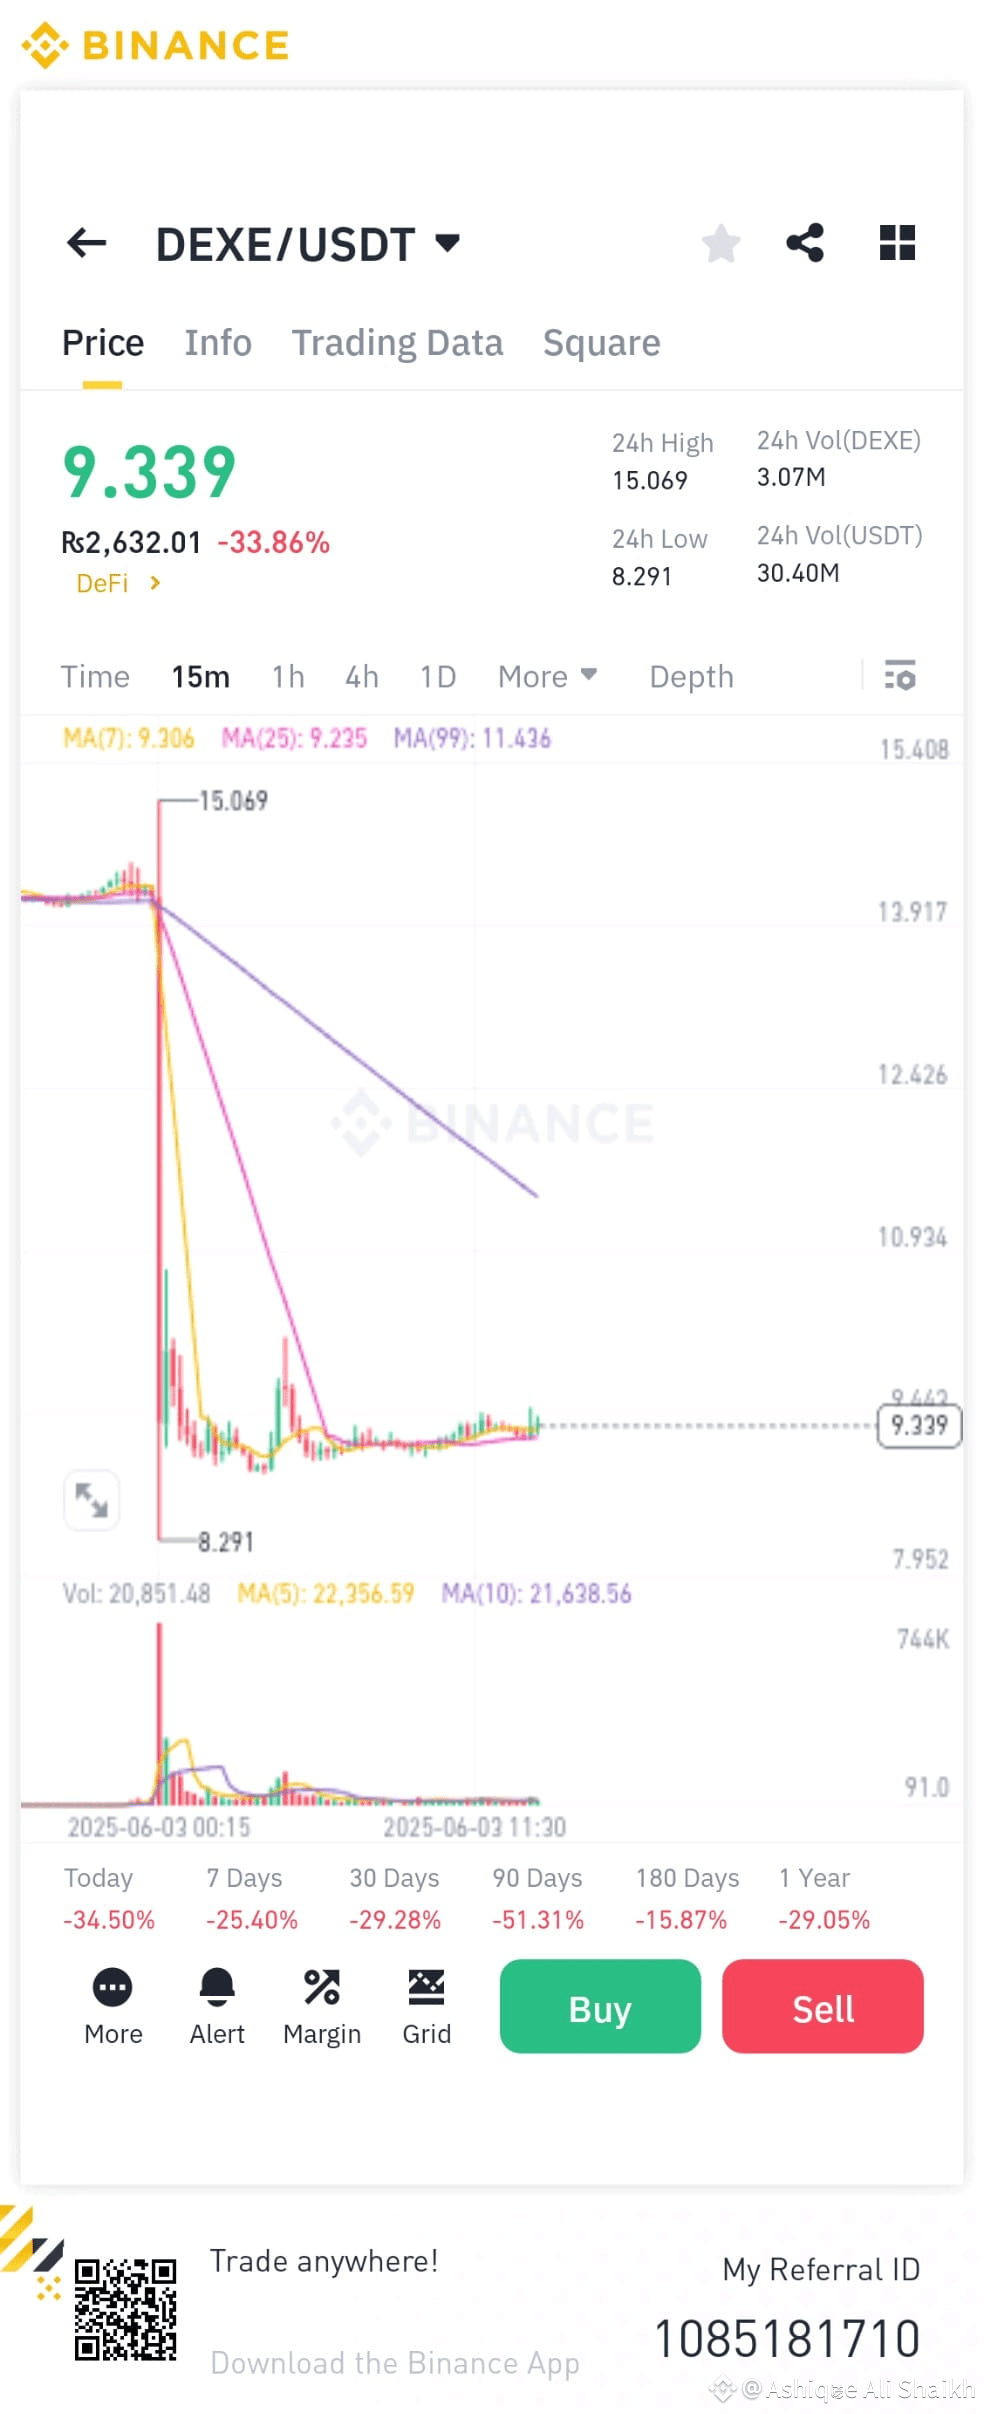
full mood on he
round about +14 average
#MyCOSTrade #DEXE/USDT #MarketRebound #EDGENLiveOnAlpha #FTXRefunds $DEXE
full mood on he
round about +14 average
full mood on he
round about +14 average
2
1
7.3k

·
--
Жоғары (өспелі)
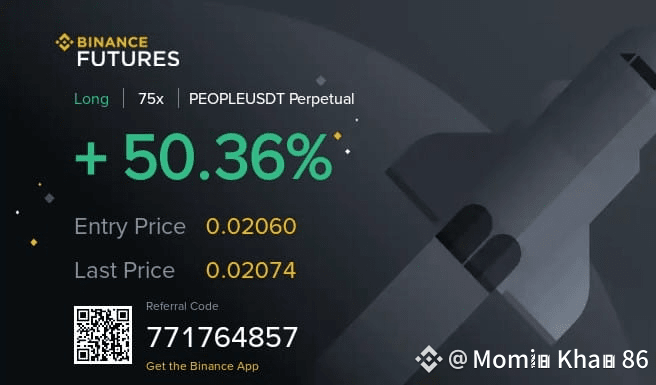
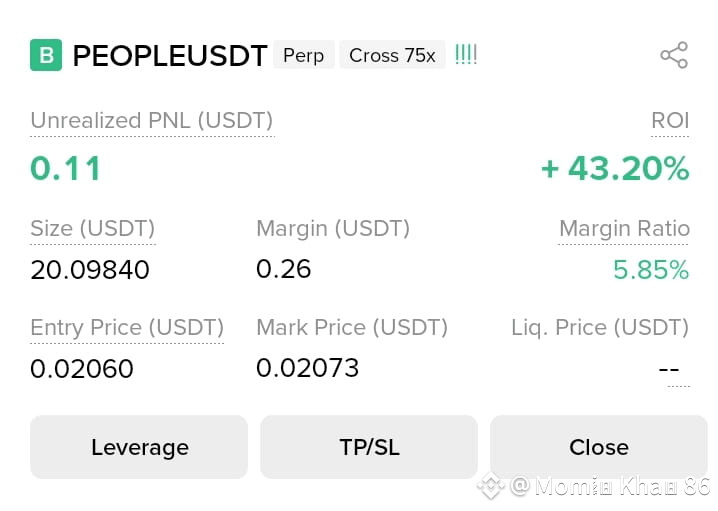
Follow me for small investments and good profits.
$PEOPLE $XRP $BTC
#FTXRefunds #MarketPullback #MyCOSTrade #CEXvsDEX101 #TradingTypes101
Follow me for small investments and good profits.
$PEOPLE $XRP $BTC
#FTXRefunds #MarketPullback #MyCOSTrade #CEXvsDEX101 #TradingTypes101
$PEOPLE $XRP $BTC
#FTXRefunds #MarketPullback #MyCOSTrade #CEXvsDEX101 #TradingTypes101
1
610

·
--
Жоғары (өспелі)
60

·
--
Төмен (кемімелі)
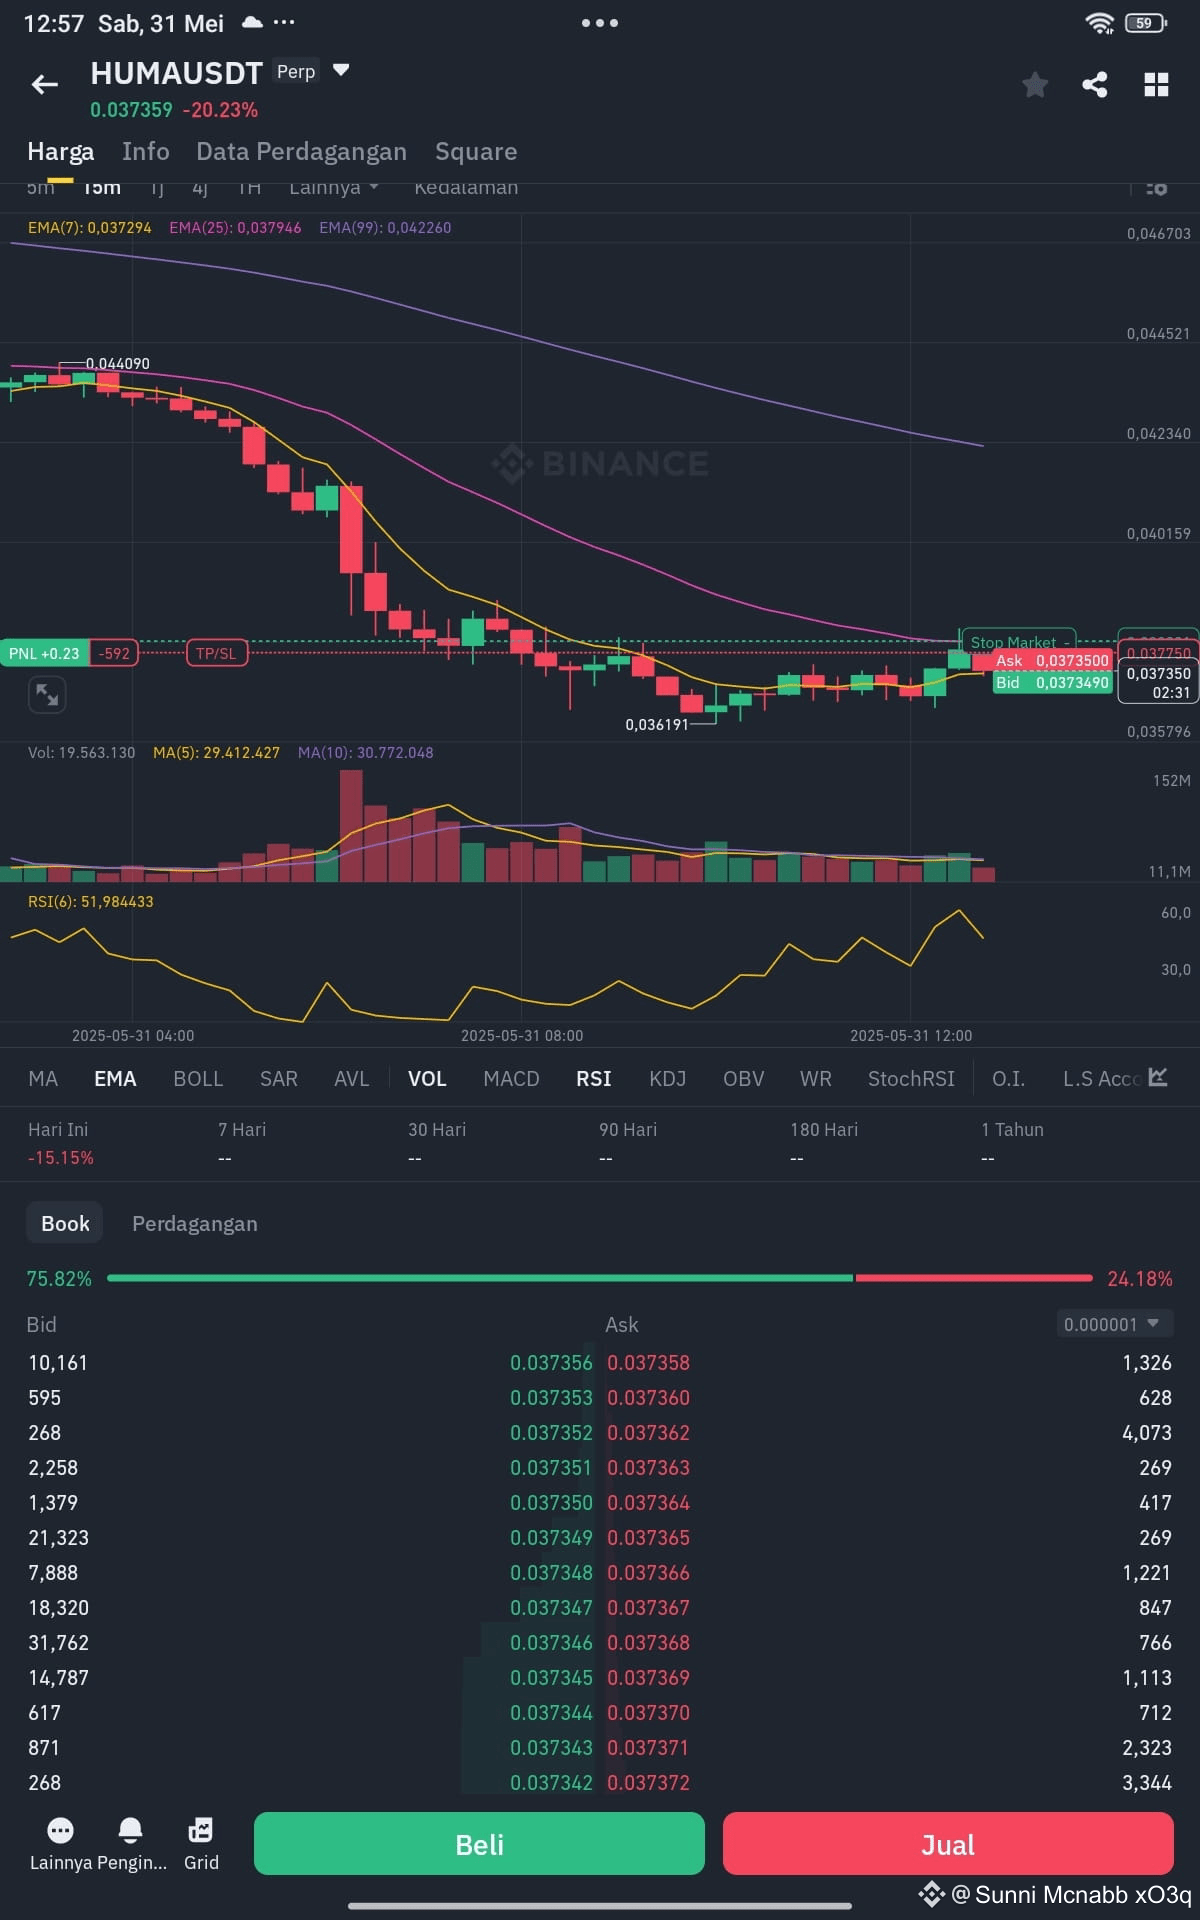
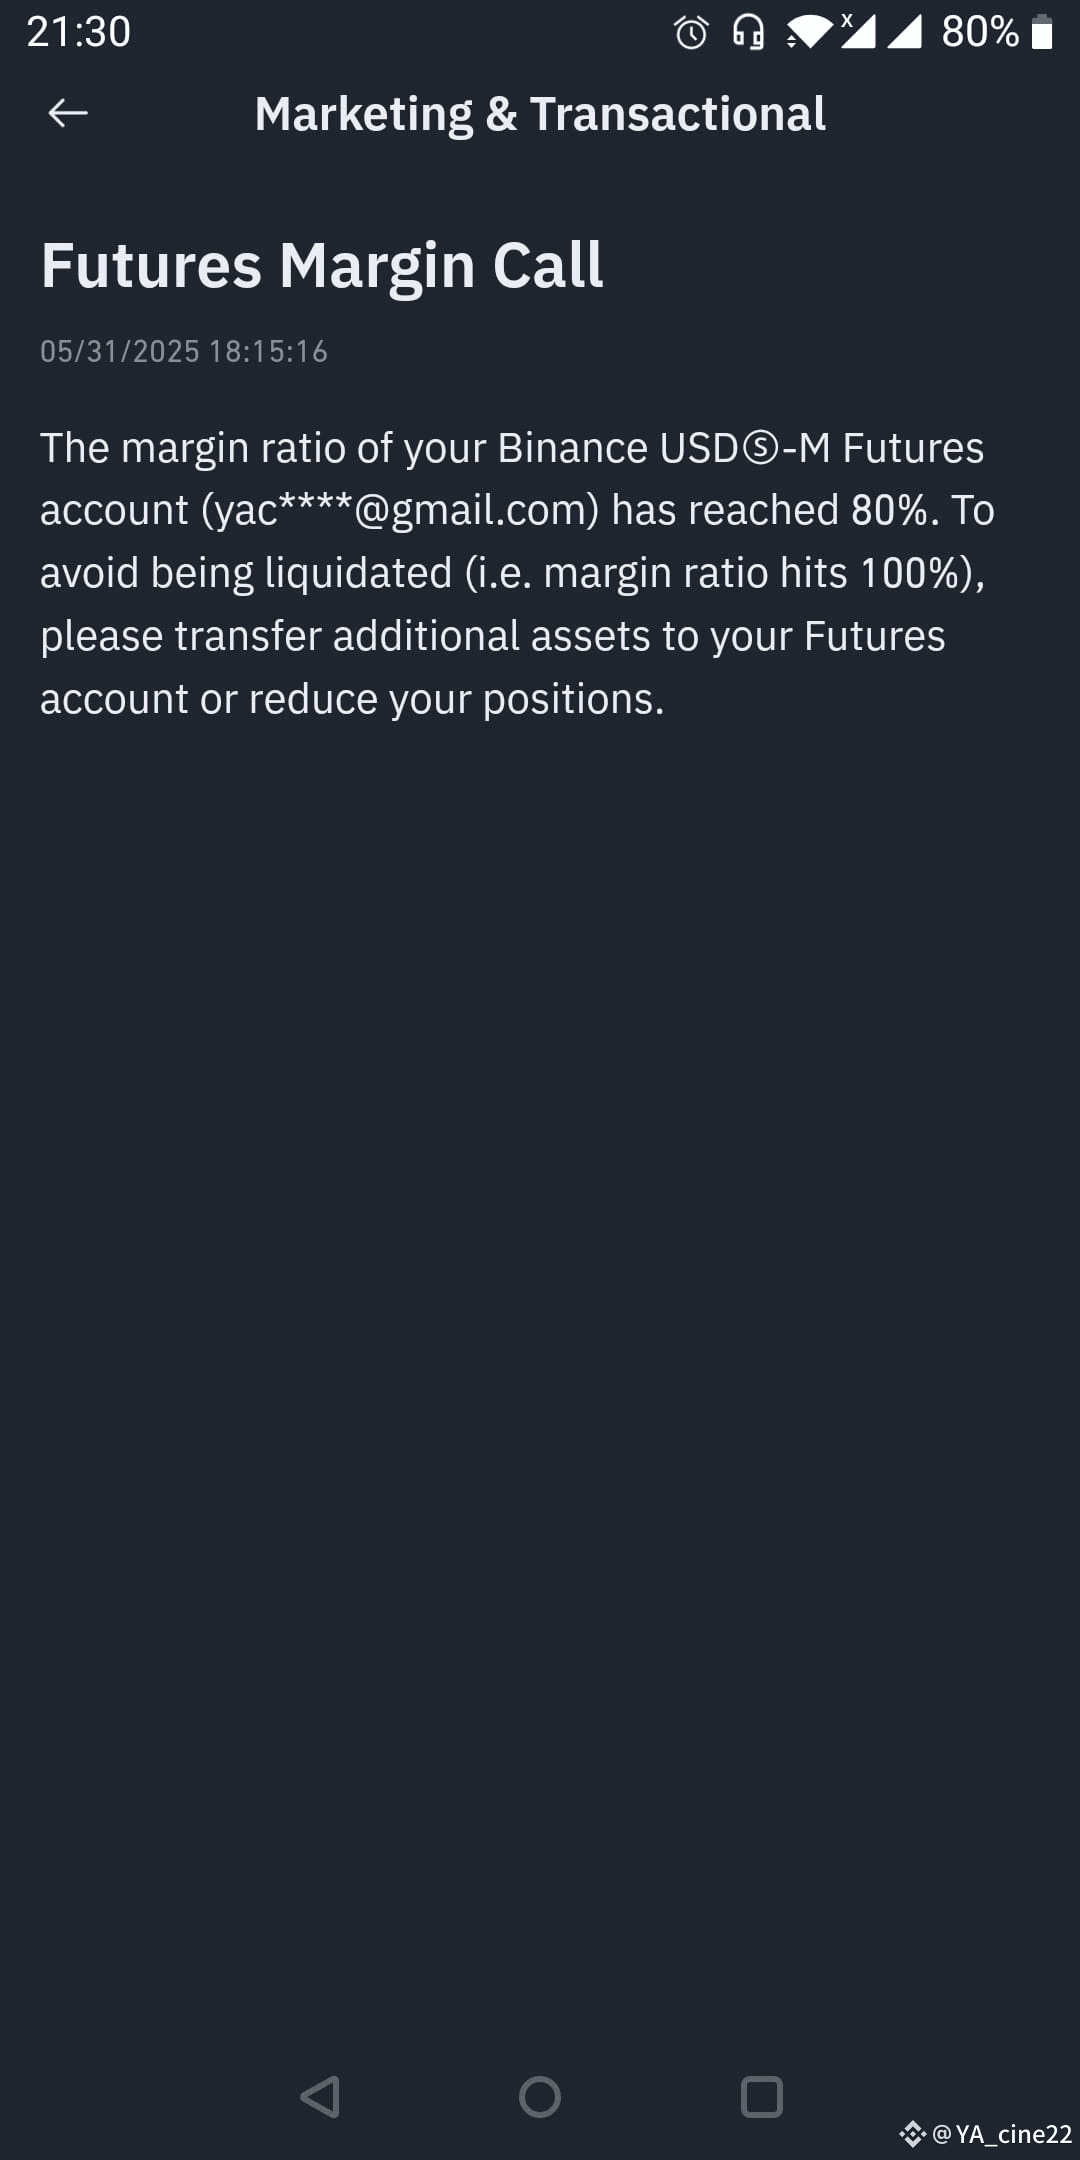
Guess what is about to happen 😲😲😲😲
$BTC $ETH $BNB #CEXvsDEX101 #TradingTypes101 #FTXRefunds #TrumpMediaBitcoinTreasury #PCEMarketWatch
Guess what is about to happen 😲😲😲😲
$BTC $ETH $BNB #CEXvsDEX101 #TradingTypes101 #FTXRefunds #TrumpMediaBitcoinTreasury #PCEMarketWatch
$BTC $ETH $BNB #CEXvsDEX101 #TradingTypes101 #FTXRefunds #TrumpMediaBitcoinTreasury #PCEMarketWatch

42


·
--
Жоғары (өспелі)
946

·
--
Төмен (кемімелі)
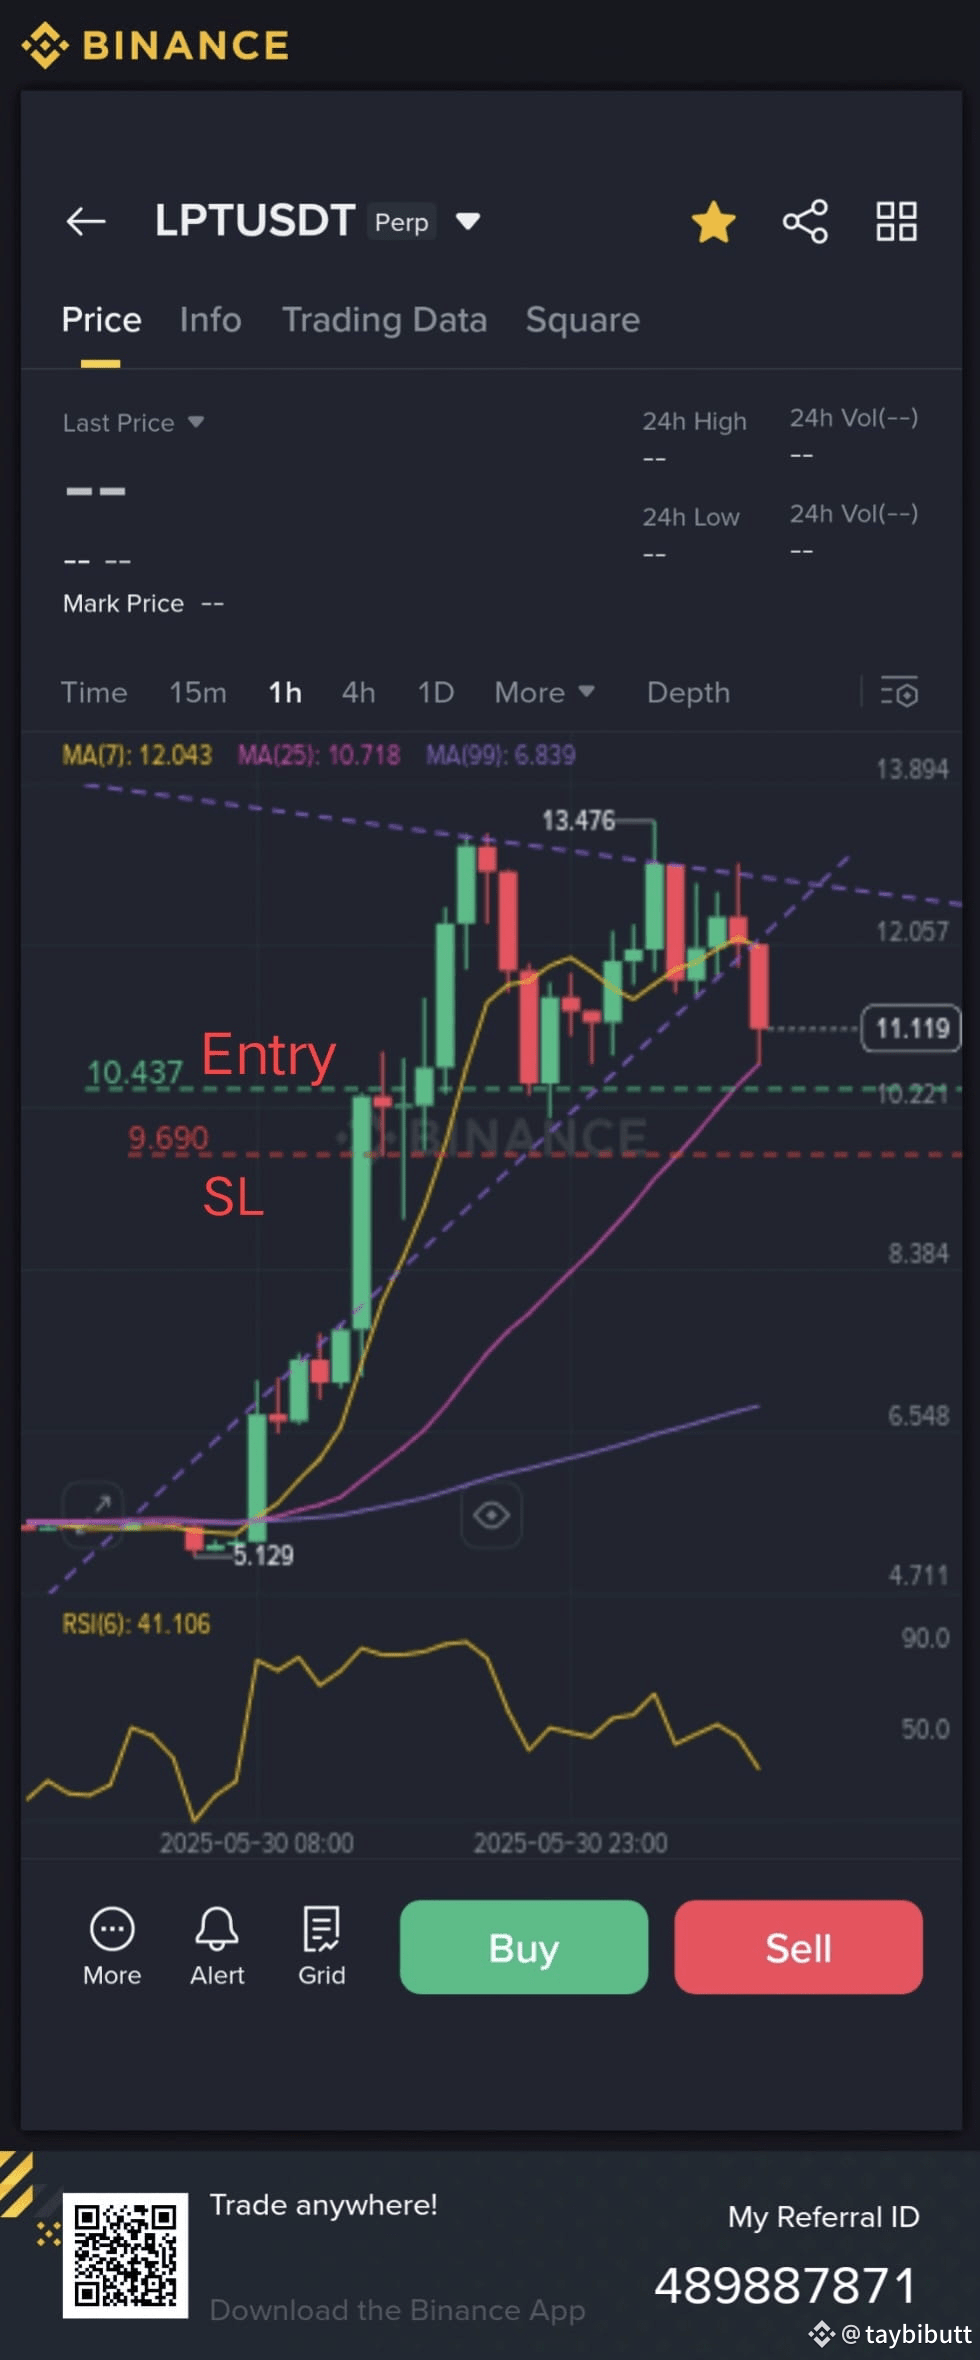
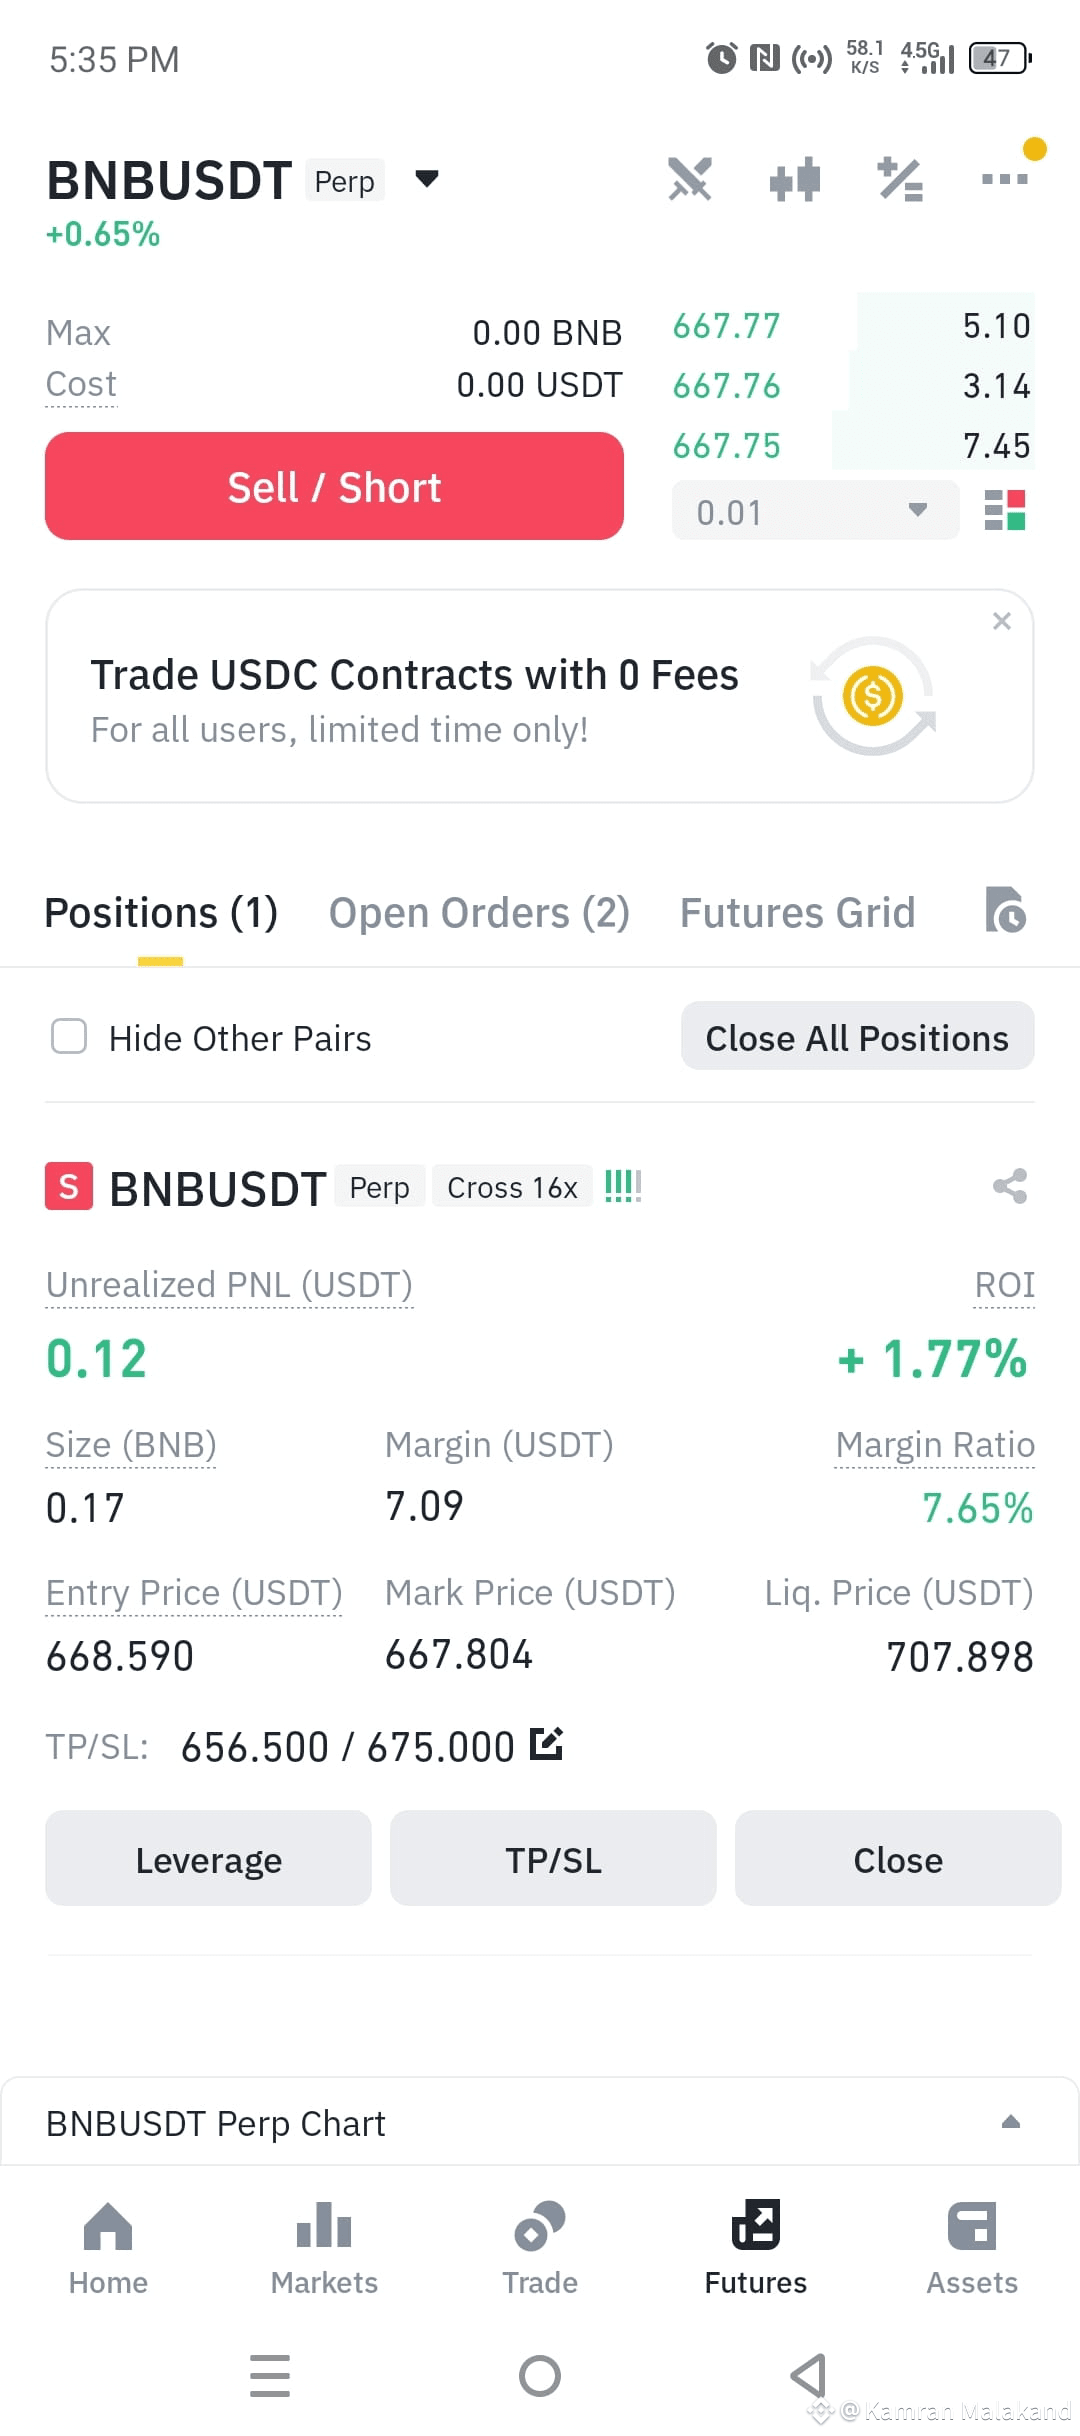
"The signal just started to weaken, and now they are entering at the very moment of the opportunity."#TrumpTariffs #TrumpMediaBitcoinTreasury #BinanceAlphaAlert #MyCOSTrade #FTXRefunds $BNB
"The signal just started to weaken, and now they are entering at the very moment of the opportunity."#TrumpTariffs #TrumpMediaBitcoinTreasury #BinanceAlphaAlert #MyCOSTrade #FTXRefunds $BNB
1
1k

·
--
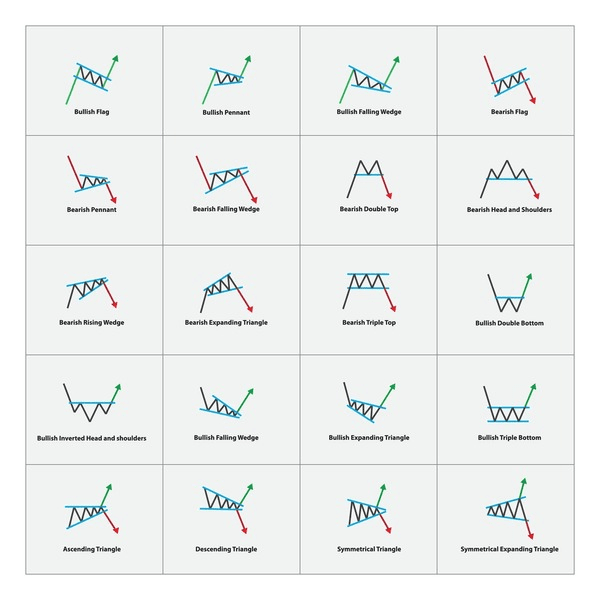
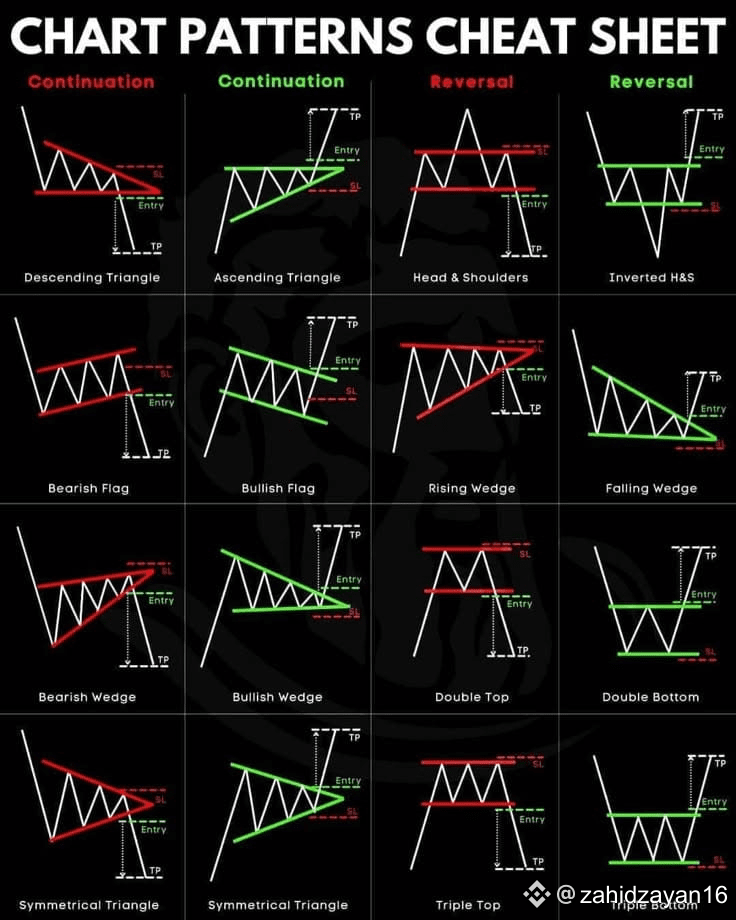
Understanding Chart Patterns
Chart patterns are visual formations on price charts that traders and analysts use to predict future price movements. They are essentially a graphical representation of the battle between buyers and sellers, and recognizing them can provide valuable insights into market psychology.
Different patterns suggest different outcomes. Some, like flags or pennants, indicate a continuation of the current trend after a brief pause. Others, such as head and shoulders or double tops/bottoms, often signal a potential trend reversal.
By studying these patterns, you can gain a better understanding of potential entry and exit points, as well as set realistic price targets and stop-loss levels. Remember, while chart patterns are powerful tools, they are most effective when used in conjunction with other technical analysis indicators and a sound risk management strategy.#CEXvsDEX101 #FTXRefunds
Understanding Chart Patterns
Chart patterns are visual formations on price charts that traders and analysts use to predict future price movements. They are essentially a graphical representation of the battle between buyers and sellers, and recognizing them can provide valuable insights into market psychology.
Different patterns suggest different outcomes. Some, like flags or pennants, indicate a continuation of the current trend after a brief pause. Others, such as head and shoulders or double tops/bottoms, often signal a potential trend reversal.
By studying these patterns, you can gain a better understanding of potential entry and exit points, as well as set realistic price targets and stop-loss levels. Remember, while chart patterns are powerful tools, they are most effective when used in conjunction with other technical analysis indicators and a sound risk management strategy.#CEXvsDEX101 #FTXRefunds
Chart patterns are visual formations on price charts that traders and analysts use to predict future price movements. They are essentially a graphical representation of the battle between buyers and sellers, and recognizing them can provide valuable insights into market psychology.
Different patterns suggest different outcomes. Some, like flags or pennants, indicate a continuation of the current trend after a brief pause. Others, such as head and shoulders or double tops/bottoms, often signal a potential trend reversal.
By studying these patterns, you can gain a better understanding of potential entry and exit points, as well as set realistic price targets and stop-loss levels. Remember, while chart patterns are powerful tools, they are most effective when used in conjunction with other technical analysis indicators and a sound risk management strategy.#CEXvsDEX101 #FTXRefunds
589
·
--
Жоғары (өспелі)
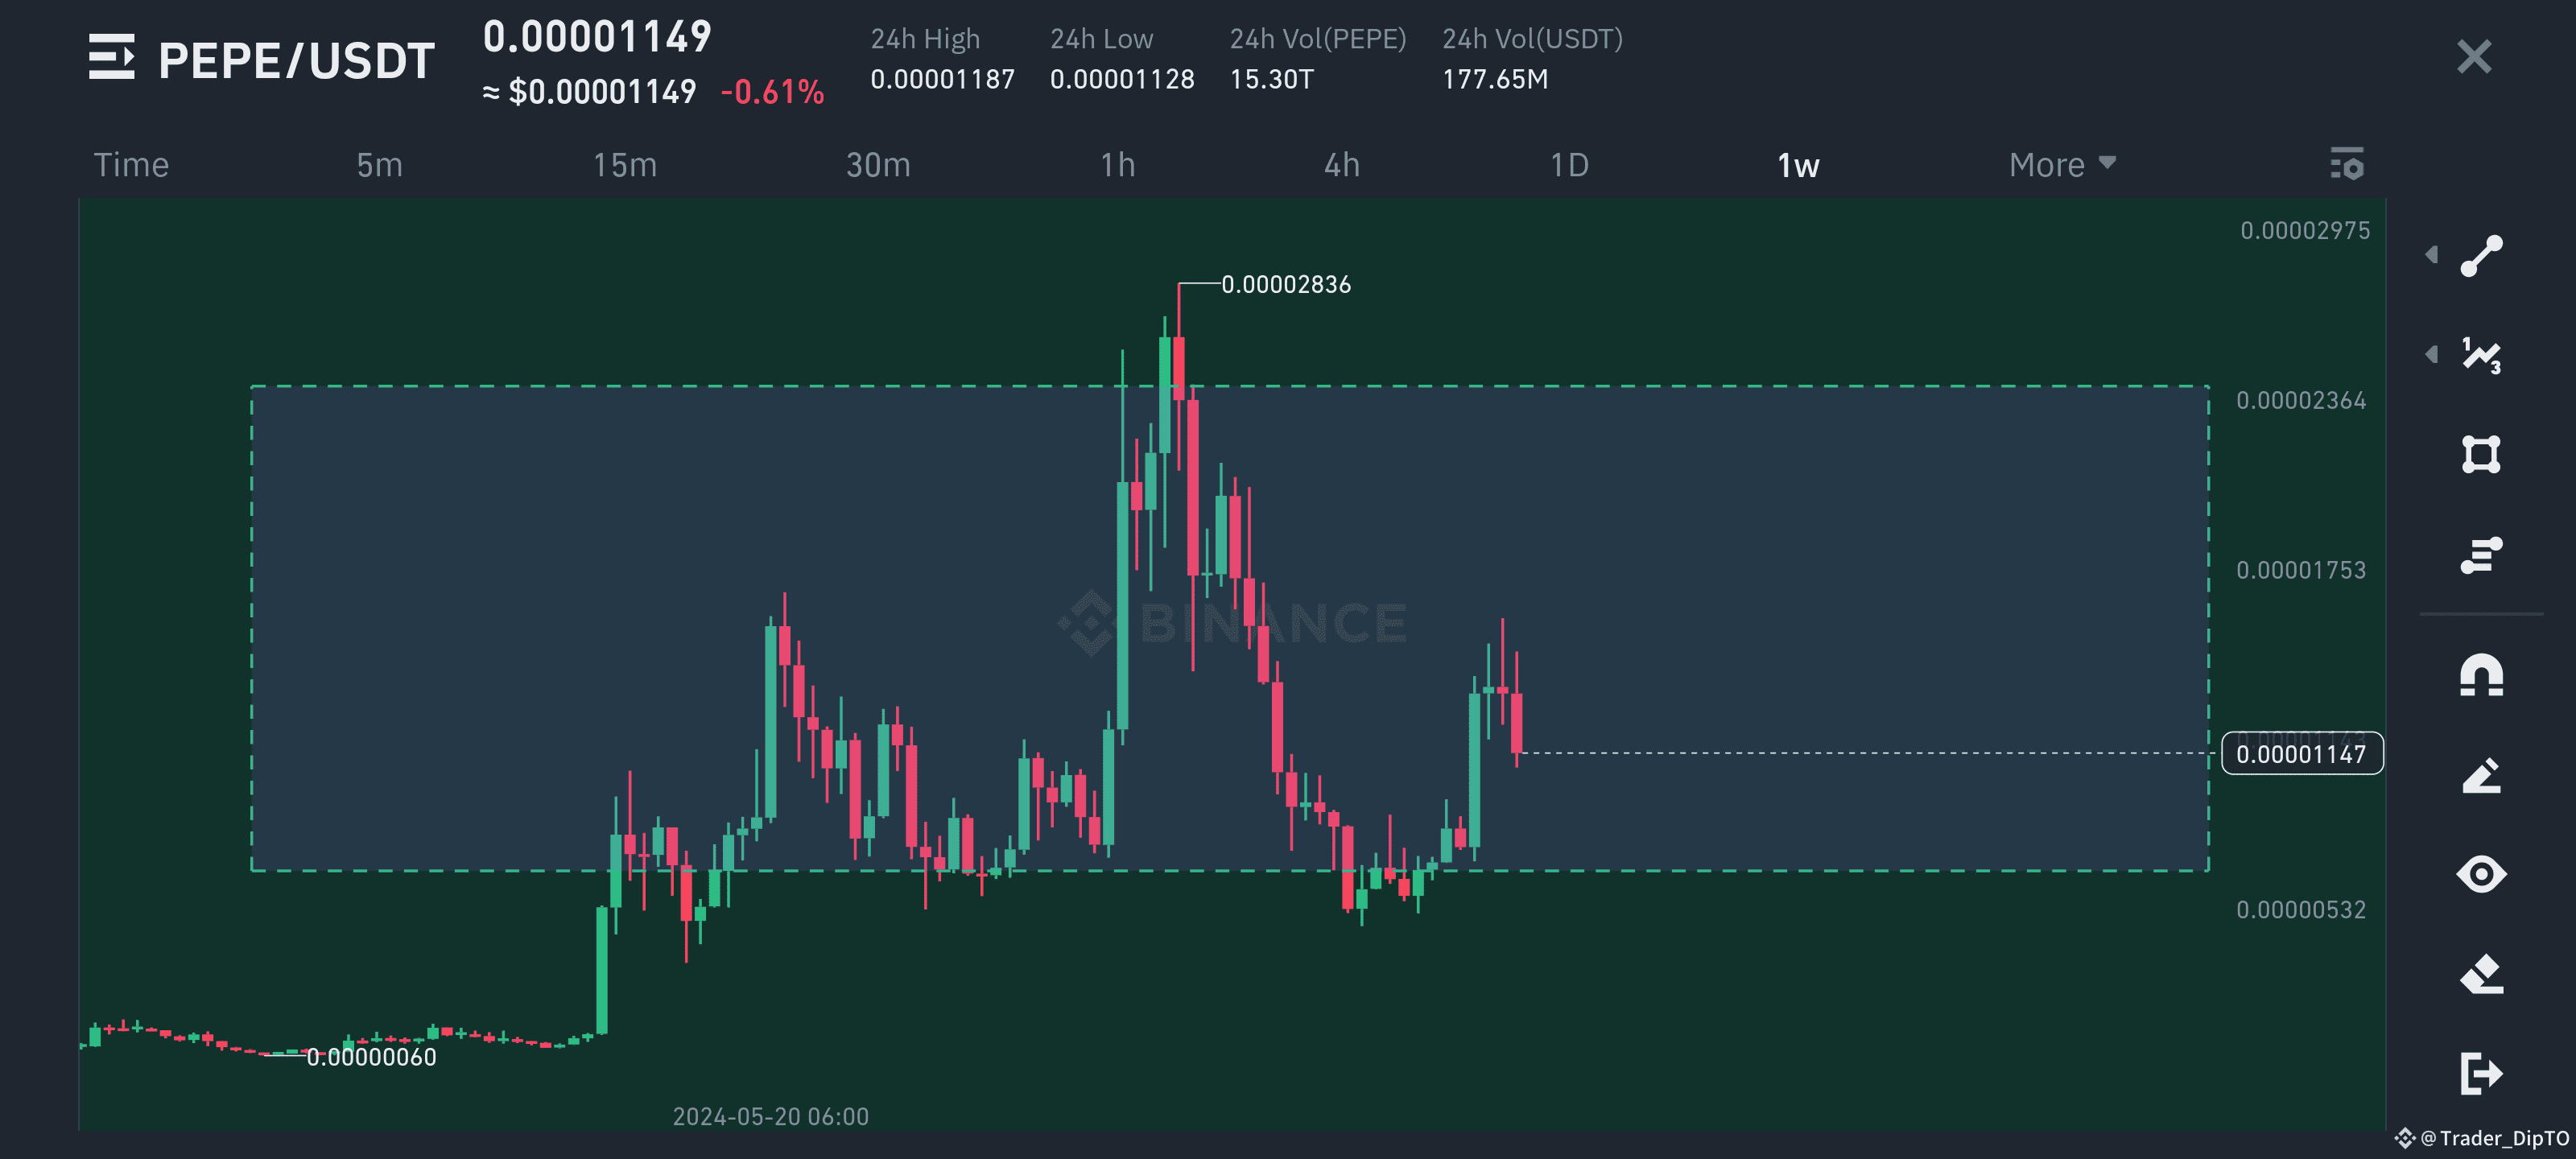
Everyone New trader don't west your money 💰
📌Buy $PEPE coin daily something something and hold for long 🟢🚀
One day you will be code a millionaire confirm 🎯
Follow Me Everyone 👉 @Trader_DipTO
$BOB $DOGE
#bullish #CEXvsDEX101 #TradingTypes101 #SaylorBTCPurchase #FTXRefunds
{spot}(PEPEUSDT)
Everyone New trader don't west your money 💰
📌Buy $PEPE coin daily something something and hold for long 🟢🚀
One day you will be code a millionaire confirm 🎯
Follow Me Everyone 👉 @Trader DipTO
$BOB $DOGE
#bullish #CEXvsDEX101 #TradingTypes101 #SaylorBTCPurchase #FTXRefunds
📌Buy $PEPE coin daily something something and hold for long 🟢🚀
One day you will be code a millionaire confirm 🎯
Follow Me Everyone 👉 @Trader DipTO
$BOB $DOGE
#bullish #CEXvsDEX101 #TradingTypes101 #SaylorBTCPurchase #FTXRefunds
2
6
1.7k
·
--
Жоғары (өспелі)
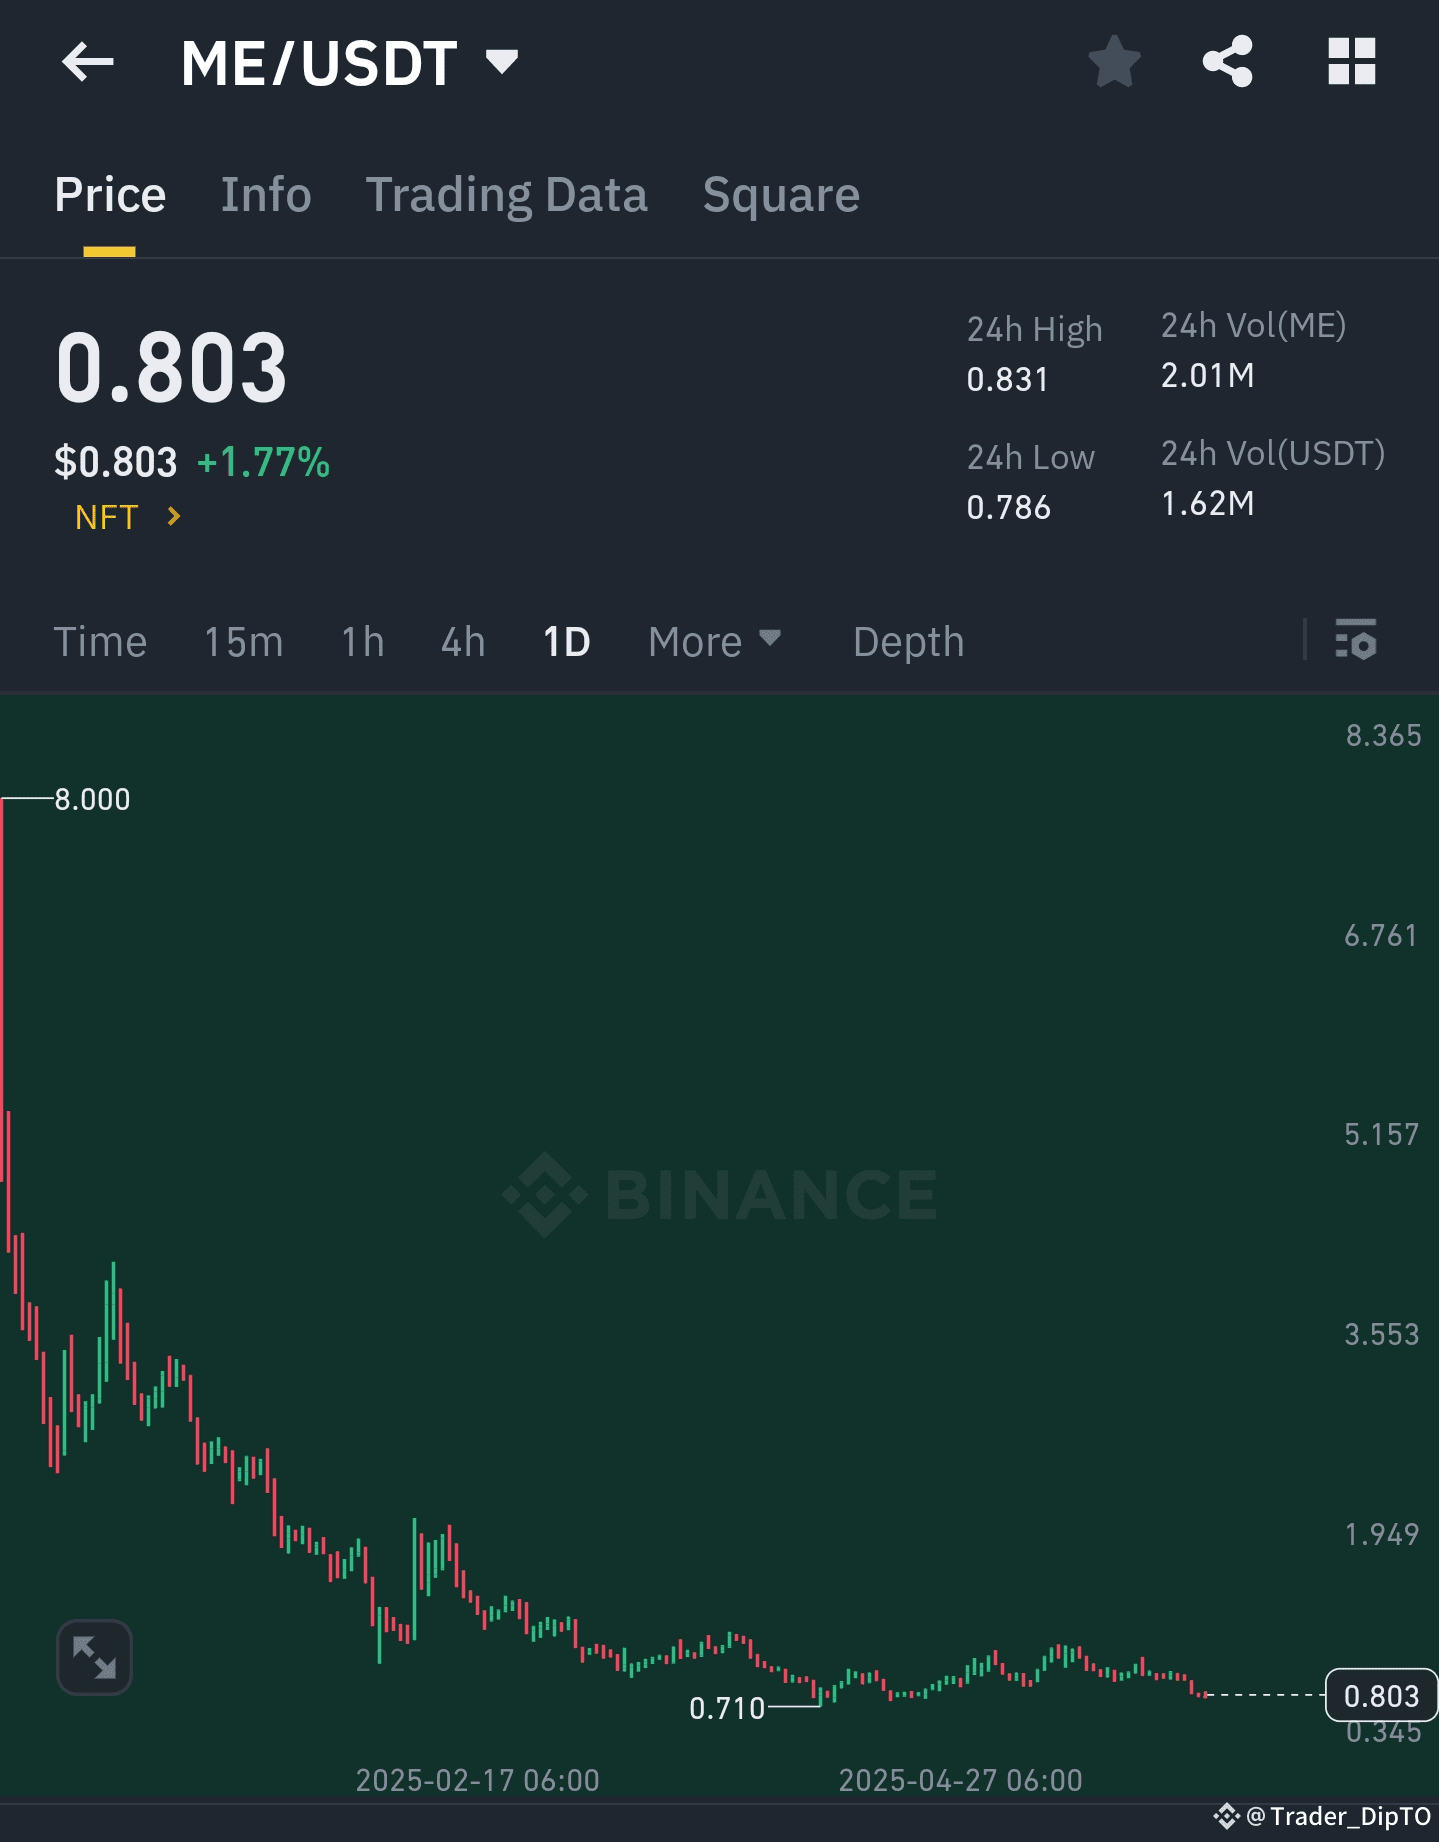
BUY HERE 👉 $ME
Follow me for crypto alart 🟢🚀
#BuyTheDip #CEXvsDEX101 #TradingTypes101 #FTXRefunds #FTXRefunds $LAYER $WCT
BUY HERE 👉 $ME
Follow me for crypto alart 🟢🚀
#BuyTheDip #CEXvsDEX101 #TradingTypes101 #FTXRefunds #FTXRefunds $LAYER $WCT
Follow me for crypto alart 🟢🚀
#BuyTheDip #CEXvsDEX101 #TradingTypes101 #FTXRefunds #FTXRefunds $LAYER $WCT
1
1.6k
·
--
Төмен (кемімелі)
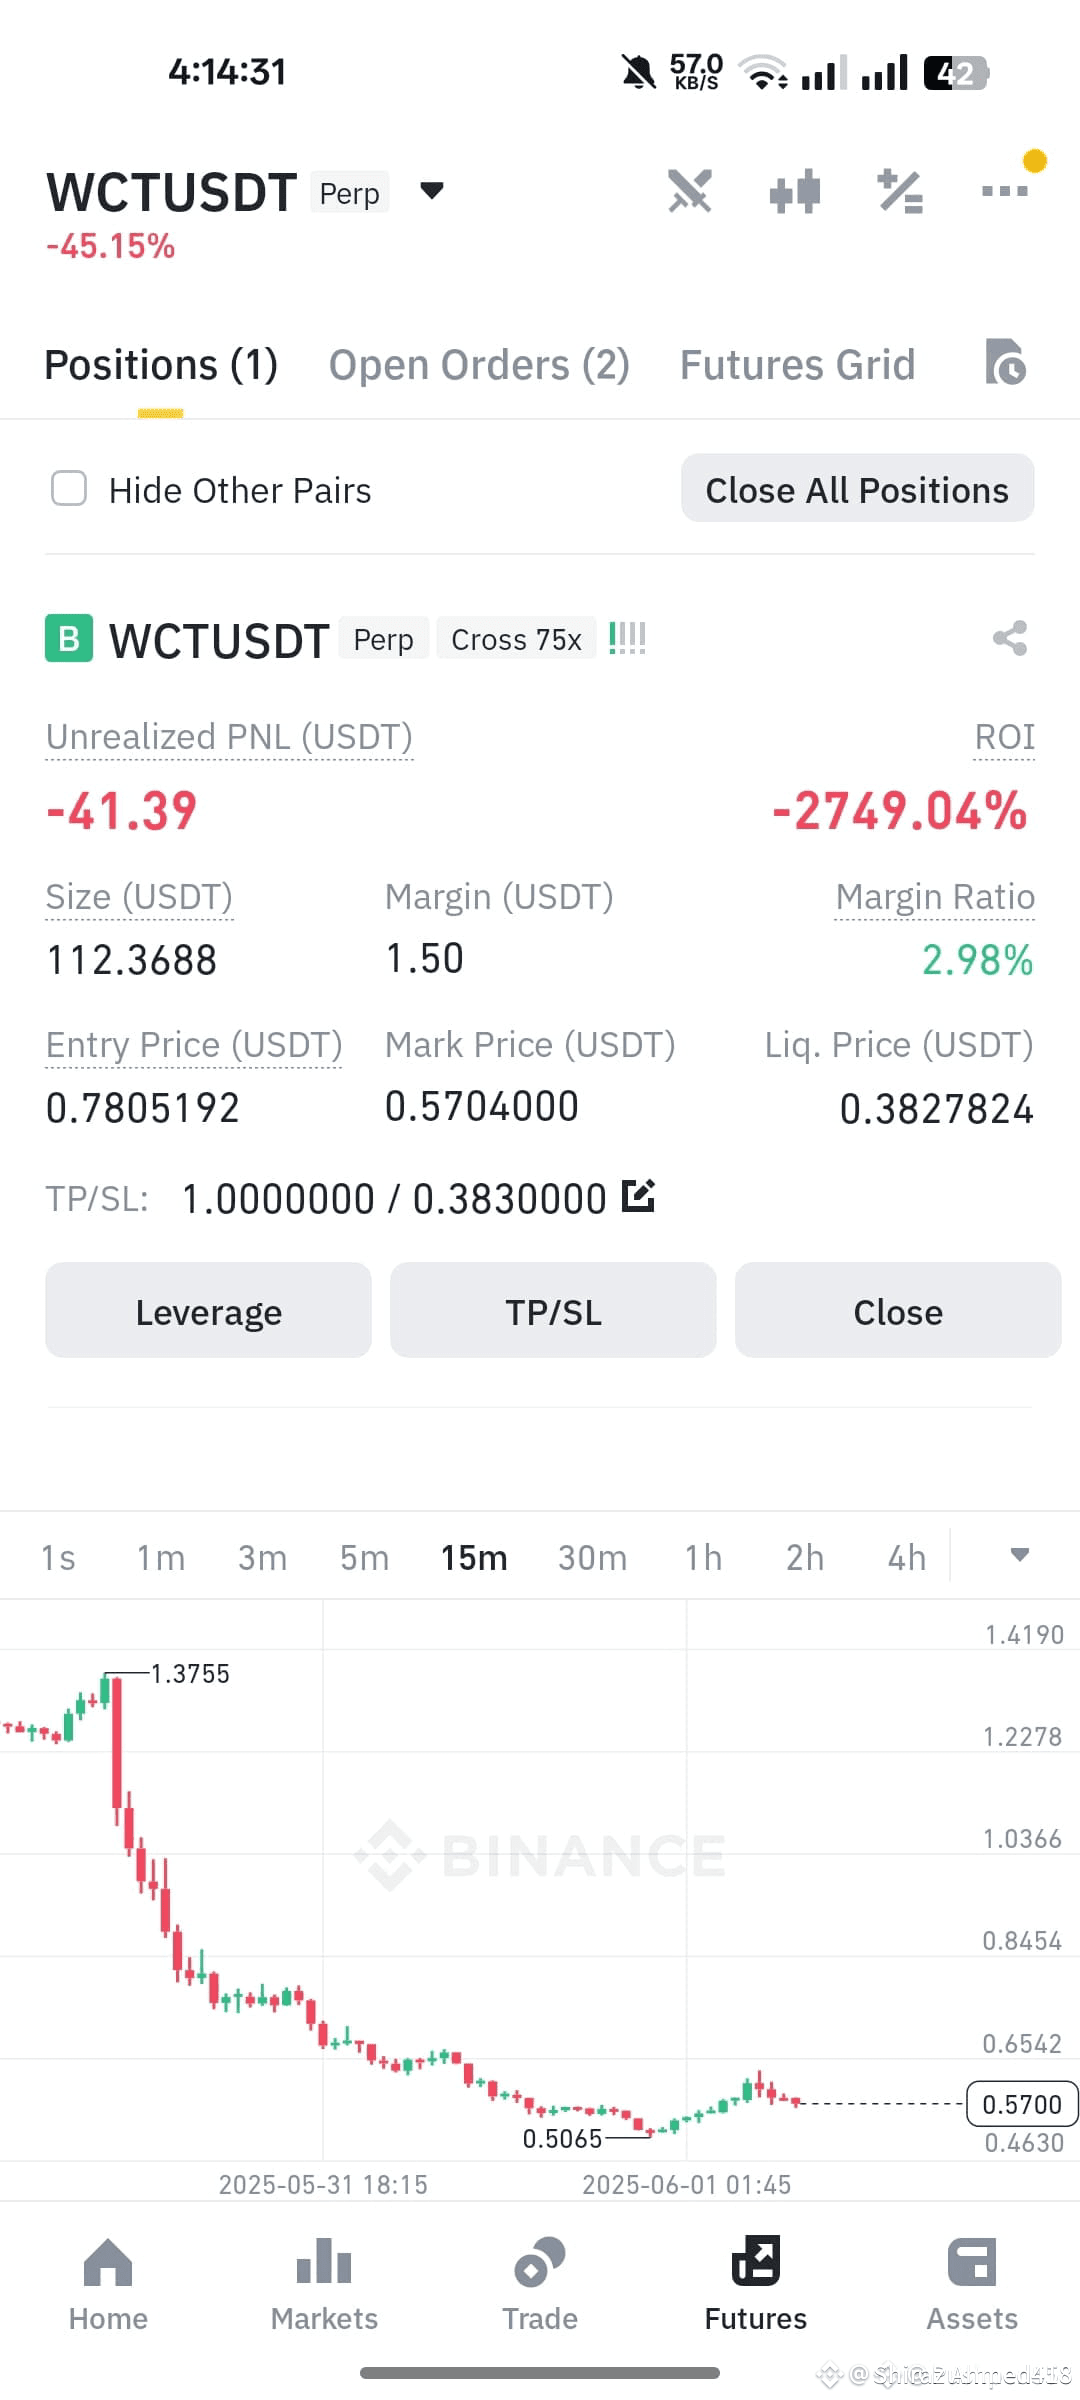
close or hold? please help 🙏😭😭😰😰😨
$BTC $ETH #TrumpTariffs #TrumpMediaBitcoinTreasury #TradingTypes101 #CEXvsDEX101 #FTXRefunds
$WCT
close or hold? please help 🙏😭😭😰😰😨
$BTC $ETH #TrumpTariffs #TrumpMediaBitcoinTreasury #TradingTypes101 #CEXvsDEX101 #FTXRefunds
$WCT
$BTC $ETH #TrumpTariffs #TrumpMediaBitcoinTreasury #TradingTypes101 #CEXvsDEX101 #FTXRefunds
$WCT
62
15
21
68.3k


·
--
Төмен (кемімелі)
3.6k
·
--
Төмен (кемімелі)
1
1
547
Көбірек контент көру үшін кіріңіз
Binance Square платформасында әлемдік криптоқоғамдастыққа қосылыңыз
⚡️ Криптовалюта туралы ең соңғы және пайдалы ақпаратты алыңыз.
💬 Әлемдегі ең ірі криптобиржаның сеніміне ие.
👍 Расталған авторлардың нақты пікірлерін табыңыз.
Электрондық пошта/телефон нөмірі
Трендтегі тақырыптар
1
#JobsReportRaisesHikeOdds
328,599 рет көрілді
2,515 адам талқылап жатыр
2
#CPITestsDecemberRateOutlook
54,590 рет көрілді
619 адам талқылап жатыр
3
#BitcoinRebounds$75KAsChipsLead
27,534 рет көрілді
256 адам талқылап жатыр
4
#US Data Center Rules May Constrain AI Expansion
49,331 рет көрілді
186 адам талқылап жатыр
5
#ARKPlans14ThematicETFsCoveringAIAndTokenizedMarkets
758 рет көрілді
32 адам талқылап жатыр
6
#WillAnthropicListOnTime
87,995 рет көрілді
1,001 адам талқылап жатыр
7
#WillUS-IranTensionsBoostSafe-HavenDemand?
25,863 рет көрілді
262 адам талқылап жатыр
8
#BitcoinETFsSee$412MNetOutflows
6,846 рет көрілді
48 адам талқылап жатыр
9
#HKSFCPlansToRestrictCryptoAndExchangeTerms
24,268 рет көрілді
353 адам талқылап жатыр
10
#TradFiForBeginners
53,265 рет көрілді
777 адам талқылап жатыр