
#footprintchart
footprintchart
61 рет көрілді
2 адам талқылап жатыр
Қызу саудада
Ең соңғы


📊 BTC FOOTPRINT ANALYSIS: WHAT ARE BUYERS AND SELLERS TELLING US?
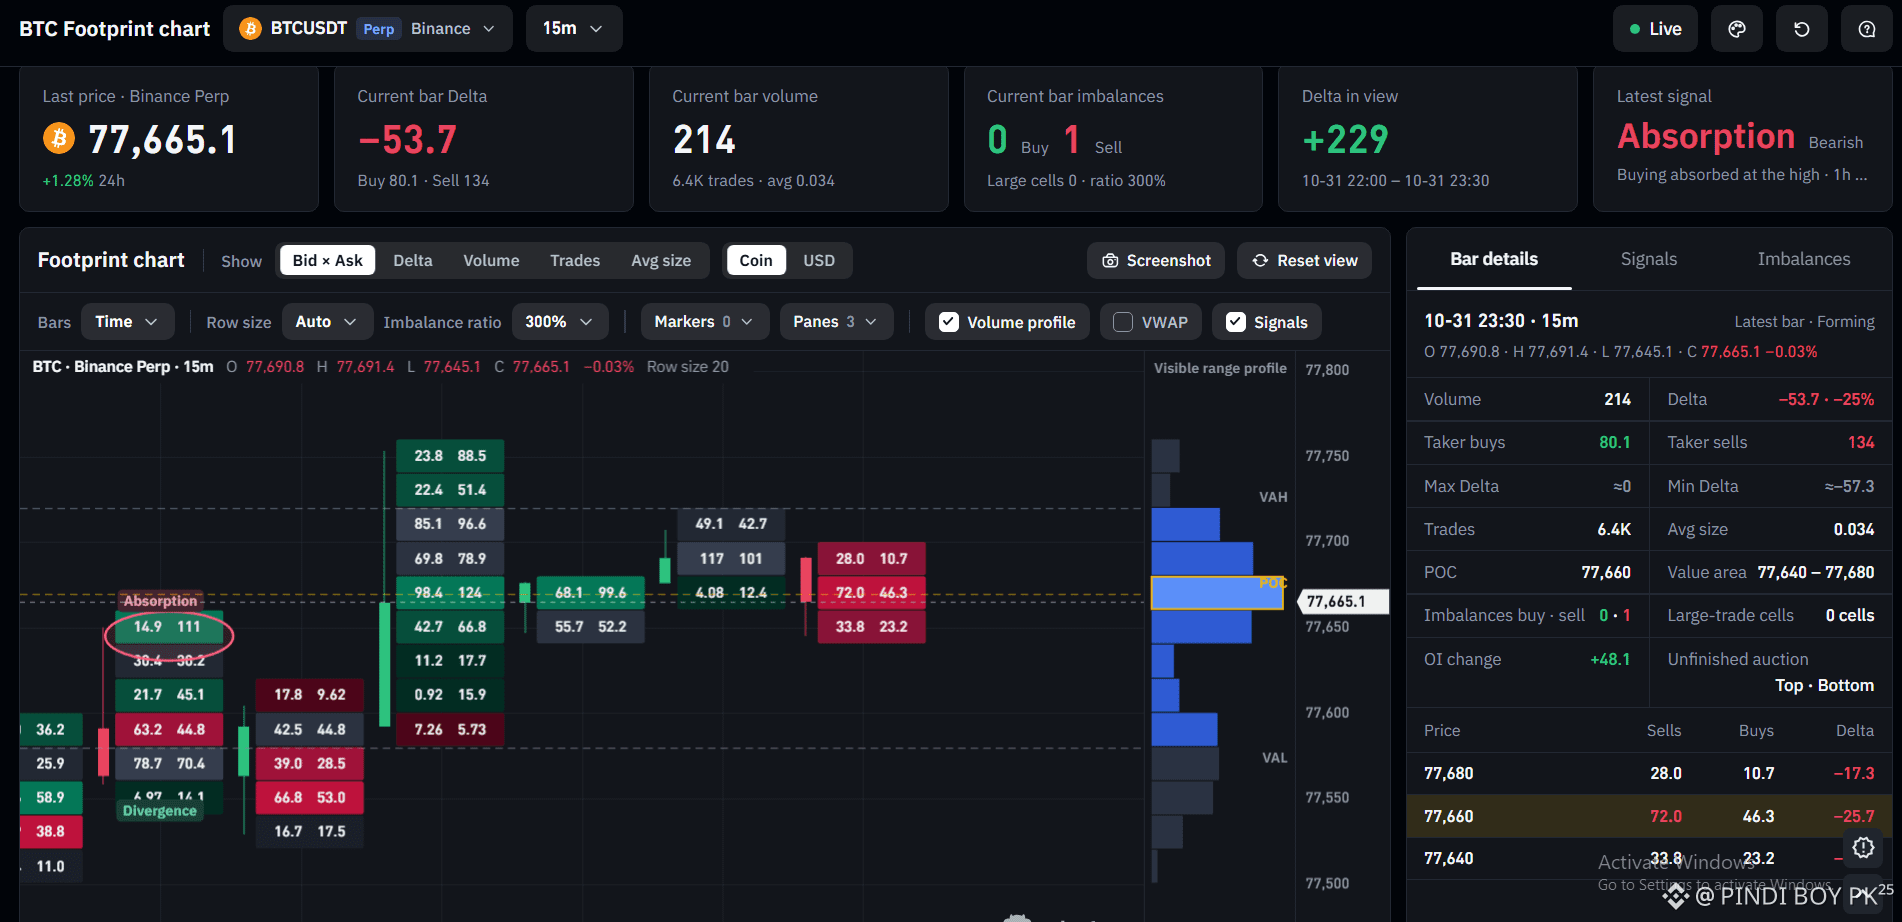
Let’s break down this BTCUSDT 15-minute footprint chart and understand what’s happening behind the candles.
Bitcoin is trading around $77,665 in this snapshot. The current bar shows a negative delta of -53.7, with taker sells at 134 versus taker buys at 80.1. This indicates stronger aggressive selling during the candle, but it doesn't automatically confirm a bearish reversal.
🔍 Here’s What I’m Watching:
🟢 Footprint Numbers: These show buying and selling activity at individual price levels, helping traders identify where aggressive orders are entering.
🔴 Delta: The difference between buying and selling volume. Negative delta suggests sellers are more aggressive, while positive delta indicates stronger buying pressure.
📍 POC at $77,660: This is the price level with the highest traded volume in the displayed bar. The value area is marked between $77,640 and $77,680.
⚠️ Absorption Signal: The chart flags bearish absorption, suggesting buying pressure may be getting absorbed by sellers near a higher price area. Confirmation from subsequent candles is still essential.
My takeaway: I’d watch whether BTC holds the $77,640–$77,660 area or breaks below it. Order flow provides clues, not guarantees. Always manage risk and wait for price confirmation.
#bitcoin #BTC #FootprintChart #cryptotrading #TechnicalAnalysis
$BTC
$LSK
$COW
{spot}(COWUSDT)
📊 BTC FOOTPRINT ANALYSIS: WHAT ARE BUYERS AND SELLERS TELLING US?
Let’s break down this BTCUSDT 15-minute footprint chart and understand what’s happening behind the candles.
Bitcoin is trading around $77,665 in this snapshot. The current bar shows a negative delta of -53.7, with taker sells at 134 versus taker buys at 80.1. This indicates stronger aggressive selling during the candle, but it doesn't automatically confirm a bearish reversal.
🔍 Here’s What I’m Watching:
🟢 Footprint Numbers: These show buying and selling activity at individual price levels, helping traders identify where aggressive orders are entering.
🔴 Delta: The difference between buying and selling volume. Negative delta suggests sellers are more aggressive, while positive delta indicates stronger buying pressure.
📍 POC at $77,660: This is the price level with the highest traded volume in the displayed bar. The value area is marked between $77,640 and $77,680.
⚠️ Absorption Signal: The chart flags bearish absorption, suggesting buying pressure may be getting absorbed by sellers near a higher price area. Confirmation from subsequent candles is still essential.
My takeaway: I’d watch whether BTC holds the $77,640–$77,660 area or breaks below it. Order flow provides clues, not guarantees. Always manage risk and wait for price confirmation.
#bitcoin #BTC #FootprintChart #cryptotrading #TechnicalAnalysis
$BTC
$LSK
$COW
Let’s break down this BTCUSDT 15-minute footprint chart and understand what’s happening behind the candles.
Bitcoin is trading around $77,665 in this snapshot. The current bar shows a negative delta of -53.7, with taker sells at 134 versus taker buys at 80.1. This indicates stronger aggressive selling during the candle, but it doesn't automatically confirm a bearish reversal.
🔍 Here’s What I’m Watching:
🟢 Footprint Numbers: These show buying and selling activity at individual price levels, helping traders identify where aggressive orders are entering.
🔴 Delta: The difference between buying and selling volume. Negative delta suggests sellers are more aggressive, while positive delta indicates stronger buying pressure.
📍 POC at $77,660: This is the price level with the highest traded volume in the displayed bar. The value area is marked between $77,640 and $77,680.
⚠️ Absorption Signal: The chart flags bearish absorption, suggesting buying pressure may be getting absorbed by sellers near a higher price area. Confirmation from subsequent candles is still essential.
My takeaway: I’d watch whether BTC holds the $77,640–$77,660 area or breaks below it. Order flow provides clues, not guarantees. Always manage risk and wait for price confirmation.
#bitcoin #BTC #FootprintChart #cryptotrading #TechnicalAnalysis
$BTC
$LSK
$COW
1
242
Көбірек контент көру үшін кіріңіз
Binance Square платформасында әлемдік криптоқоғамдастыққа қосылыңыз
⚡️ Криптовалюта туралы ең соңғы және пайдалы ақпаратты алыңыз.
💬 Әлемдегі ең ірі криптобиржаның сеніміне ие.
👍 Расталған авторлардың нақты пікірлерін табыңыз.
Электрондық пошта/телефон нөмірі
Трендтегі тақырыптар
1
#BinanceWithdrawalScamWarning
16,586 рет көрілді
440 адам талқылап жатыр
2
#USMidtermElections
568,456 рет көрілді
3,007 адам талқылап жатыр
3
#USOctoberNFP-AreRateCutsStillPossible
24,886 рет көрілді
415 адам талқылап жатыр
4
#AppleEarningsAhead-CanStockHitNewHigh
8,844 рет көрілді
297 адам талқылап жатыр
5
#Verify1to1BinanceReserves
23,133 рет көрілді
334 адам талқылап жатыр
6
#BinanceRestores28FiatWithdrawals
109,575 рет көрілді
961 адам талқылап жатыр
7
#StrategyRepurchases$208MSTRCAdds811Bitcoin
4,293 рет көрілді
15 адам талқылап жатыр
8
#FATFLaunchesReviewOfCryptoHubsMoneyLaunderingControls
515 рет көрілді
10 адам талқылап жатыр
9
#BinanceProcesses$4.65BWithdrawals
101,106 рет көрілді
359 адам талқылап жатыр
10
#HKMALaunchesSAGEAgenticFinanceProject
2,997 рет көрілді
155 адам талқылап жатыр