

#chartanalysis
chartanalysis
1M рет көрілді
3,111 адам талқылап жатыр
Қызу саудада
Ең соңғы

·
--
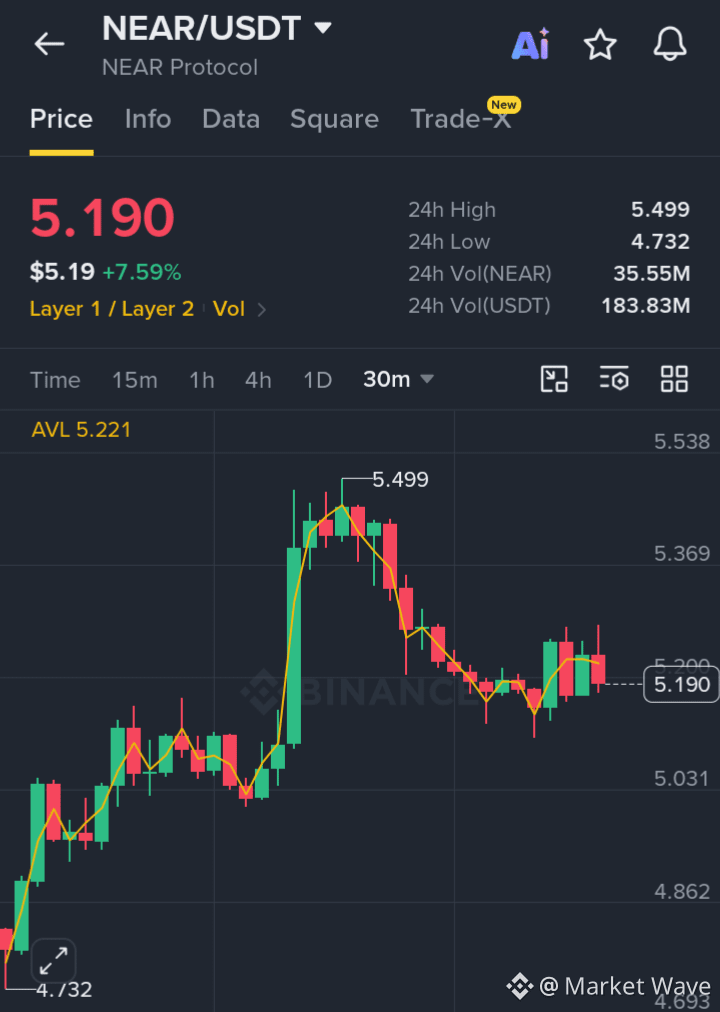
$NEAR/USDT TECHNICAL ANALYSIS: BULLISH CONTINUATION SETUP $NEAR
Target 1: 5.380
Target 2: 5.500
Target 3: 5.650
Stop Loss: 4.850
#CryptoTrading. #TechnicalAnalysis #ChartAnalysis #BullishSetup #Altcoins!
$NEAR /USDT TECHNICAL ANALYSIS: BULLISH CONTINUATION SETUP $NEAR
Target 1: 5.380
Target 2: 5.500
Target 3: 5.650
Stop Loss: 4.850
#CryptoTrading. #TechnicalAnalysis #ChartAnalysis #BullishSetup #Altcoins!
Target 1: 5.380
Target 2: 5.500
Target 3: 5.650
Stop Loss: 4.850
#CryptoTrading. #TechnicalAnalysis #ChartAnalysis #BullishSetup #Altcoins!
74

·
--
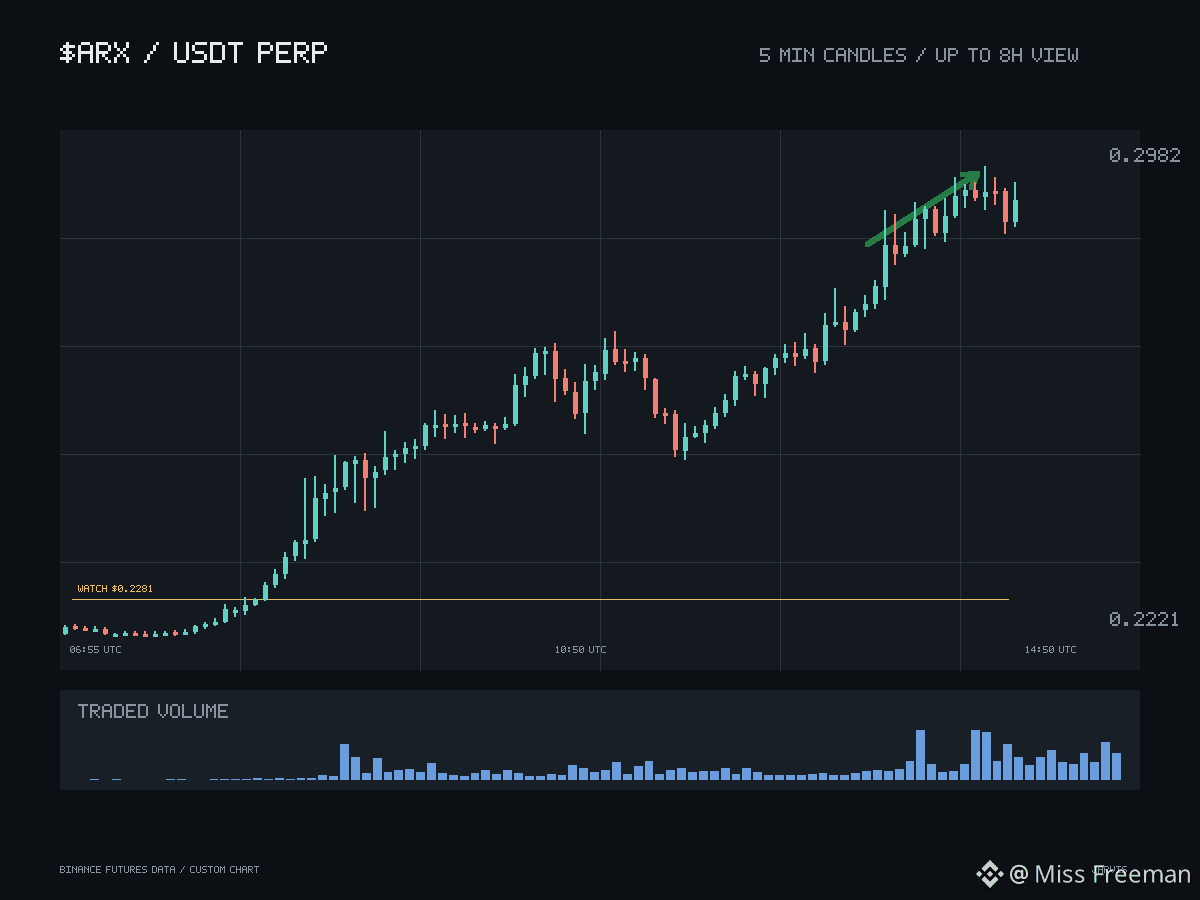
$ARX has rallied hard, and a move of that size settles one question while opening another. It proves price can travel. It says nothing about what happens the first time it gives some of that back.
The level carrying that question is 0.2167. Its role is deliberately narrow — a local reaction point, not a verdict on the rally. A first touch there needs to become a defended response, sellers absorbed and price closed back above, rather than a clean wick through followed by drift. Price structure and volume are the strongest confirming evidence on this chart, and neither can settle that in advance.
Only if the defence actually shows up does 0.2281 earn attention as the next watch — after the reaction, strictly not before. A push that skips the retest says little about who intends to stay.
Lower down, 0.2029 does different work in kind, not just in distance. Losing it would not merely fail one retest; it removes the higher-high, higher-low read this entire constructive case rests on. Treating a slip through 0.2167 as fatal, or a hold above 0.2029 as proof of health, collapses two roles that need to stay separate.
The counterweights are open interest and the current funding snapshot — neither confirms strength the way price and volume do. Constructive, with positioning caution, is the honest stance.
#Crypto #ChartAnalysis
$ARX has rallied hard, and a move of that size settles one question while opening another. It proves price can travel. It says nothing about what happens the first time it gives some of that back.
The level carrying that question is 0.2167. Its role is deliberately narrow — a local reaction point, not a verdict on the rally. A first touch there needs to become a defended response, sellers absorbed and price closed back above, rather than a clean wick through followed by drift. Price structure and volume are the strongest confirming evidence on this chart, and neither can settle that in advance.
Only if the defence actually shows up does 0.2281 earn attention as the next watch — after the reaction, strictly not before. A push that skips the retest says little about who intends to stay.
Lower down, 0.2029 does different work in kind, not just in distance. Losing it would not merely fail one retest; it removes the higher-high, higher-low read this entire constructive case rests on. Treating a slip through 0.2167 as fatal, or a hold above 0.2029 as proof of health, collapses two roles that need to stay separate.
The counterweights are open interest and the current funding snapshot — neither confirms strength the way price and volume do. Constructive, with positioning caution, is the honest stance.
#Crypto #ChartAnalysis
The level carrying that question is 0.2167. Its role is deliberately narrow — a local reaction point, not a verdict on the rally. A first touch there needs to become a defended response, sellers absorbed and price closed back above, rather than a clean wick through followed by drift. Price structure and volume are the strongest confirming evidence on this chart, and neither can settle that in advance.
Only if the defence actually shows up does 0.2281 earn attention as the next watch — after the reaction, strictly not before. A push that skips the retest says little about who intends to stay.
Lower down, 0.2029 does different work in kind, not just in distance. Losing it would not merely fail one retest; it removes the higher-high, higher-low read this entire constructive case rests on. Treating a slip through 0.2167 as fatal, or a hold above 0.2029 as proof of health, collapses two roles that need to stay separate.
The counterweights are open interest and the current funding snapshot — neither confirms strength the way price and volume do. Constructive, with positioning caution, is the honest stance.
#Crypto #ChartAnalysis
62
·
--
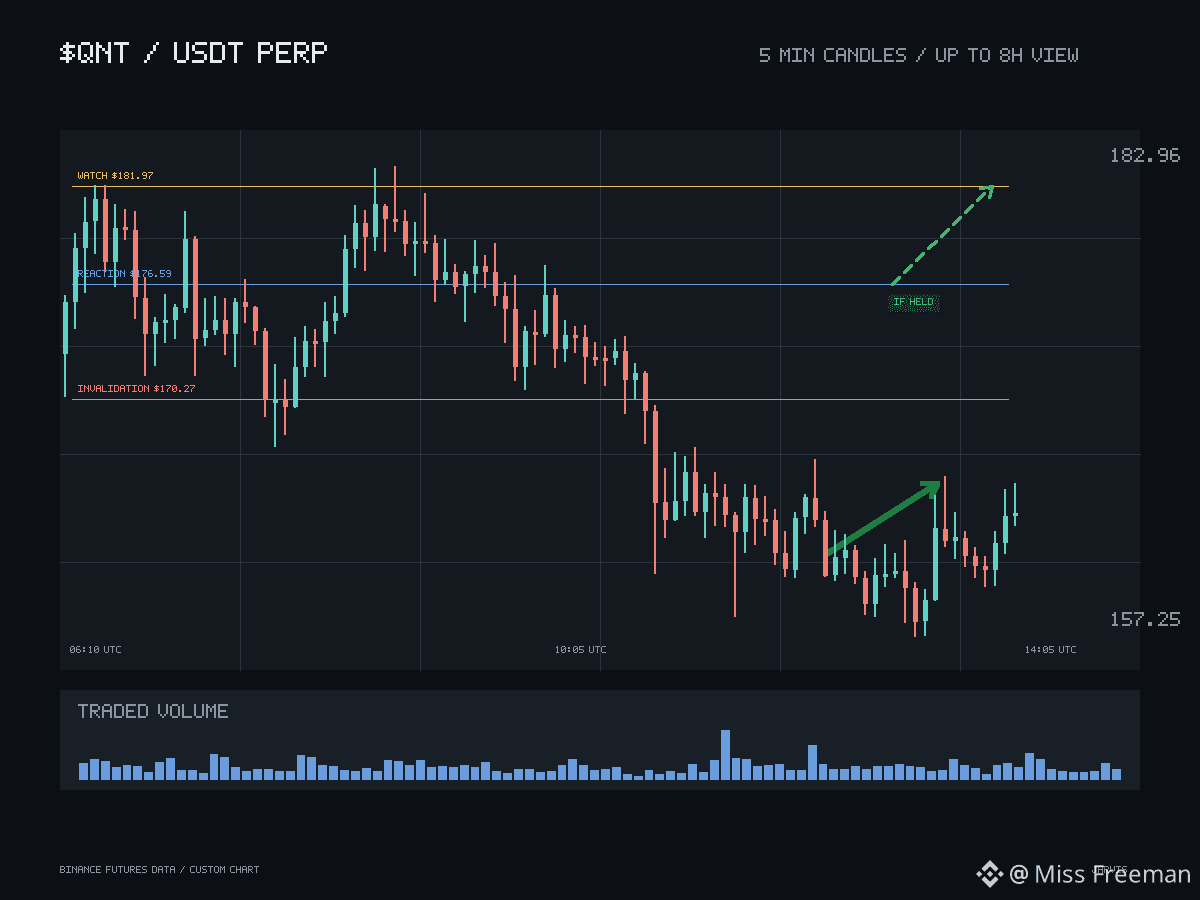
$QNT has moved sharply, and a move that size tends to answer questions nobody actually asked. It confirms price can travel. It says nothing yet about what waits underneath on the first real pullback.
The chart below the move is organised into three levels, and they do not share a job. The nearest is 176.59, a local reaction point with a deliberately narrow role: a first touch there needs to turn into a defended response — sellers absorbed, price closing back above — rather than a wick straight through and a drift. Price structure and volume are the strongest confirming evidence available here, and neither can settle that question in advance. Only if that defence appears does 181.97 earn attention as the next watch, strictly after the reaction, not before it. Strength that skips the retest proves little about who intends to stay.
Sitting lower, 170.27 does different work in kind, not just in distance. Losing it would not merely fail one retest; it removes the higher-high, higher-low read the constructive case rests on. Treating a slip through 176.59 as fatal, or a hold above 170.27 as proof of health, collapses two roles that need to stay separate.
The counterweights are open interest and the current funding snapshot — neither confirms strength the way price and volume do. Constructive, with positioning caution.
#Crypto #ChartAnalysis
$QNT has moved sharply, and a move that size tends to answer questions nobody actually asked. It confirms price can travel. It says nothing yet about what waits underneath on the first real pullback.
The chart below the move is organised into three levels, and they do not share a job. The nearest is 176.59, a local reaction point with a deliberately narrow role: a first touch there needs to turn into a defended response — sellers absorbed, price closing back above — rather than a wick straight through and a drift. Price structure and volume are the strongest confirming evidence available here, and neither can settle that question in advance. Only if that defence appears does 181.97 earn attention as the next watch, strictly after the reaction, not before it. Strength that skips the retest proves little about who intends to stay.
Sitting lower, 170.27 does different work in kind, not just in distance. Losing it would not merely fail one retest; it removes the higher-high, higher-low read the constructive case rests on. Treating a slip through 176.59 as fatal, or a hold above 170.27 as proof of health, collapses two roles that need to stay separate.
The counterweights are open interest and the current funding snapshot — neither confirms strength the way price and volume do. Constructive, with positioning caution.
#Crypto #ChartAnalysis
The chart below the move is organised into three levels, and they do not share a job. The nearest is 176.59, a local reaction point with a deliberately narrow role: a first touch there needs to turn into a defended response — sellers absorbed, price closing back above — rather than a wick straight through and a drift. Price structure and volume are the strongest confirming evidence available here, and neither can settle that question in advance. Only if that defence appears does 181.97 earn attention as the next watch, strictly after the reaction, not before it. Strength that skips the retest proves little about who intends to stay.
Sitting lower, 170.27 does different work in kind, not just in distance. Losing it would not merely fail one retest; it removes the higher-high, higher-low read the constructive case rests on. Treating a slip through 176.59 as fatal, or a hold above 170.27 as proof of health, collapses two roles that need to stay separate.
The counterweights are open interest and the current funding snapshot — neither confirms strength the way price and volume do. Constructive, with positioning caution.
#Crypto #ChartAnalysis
110
·
--
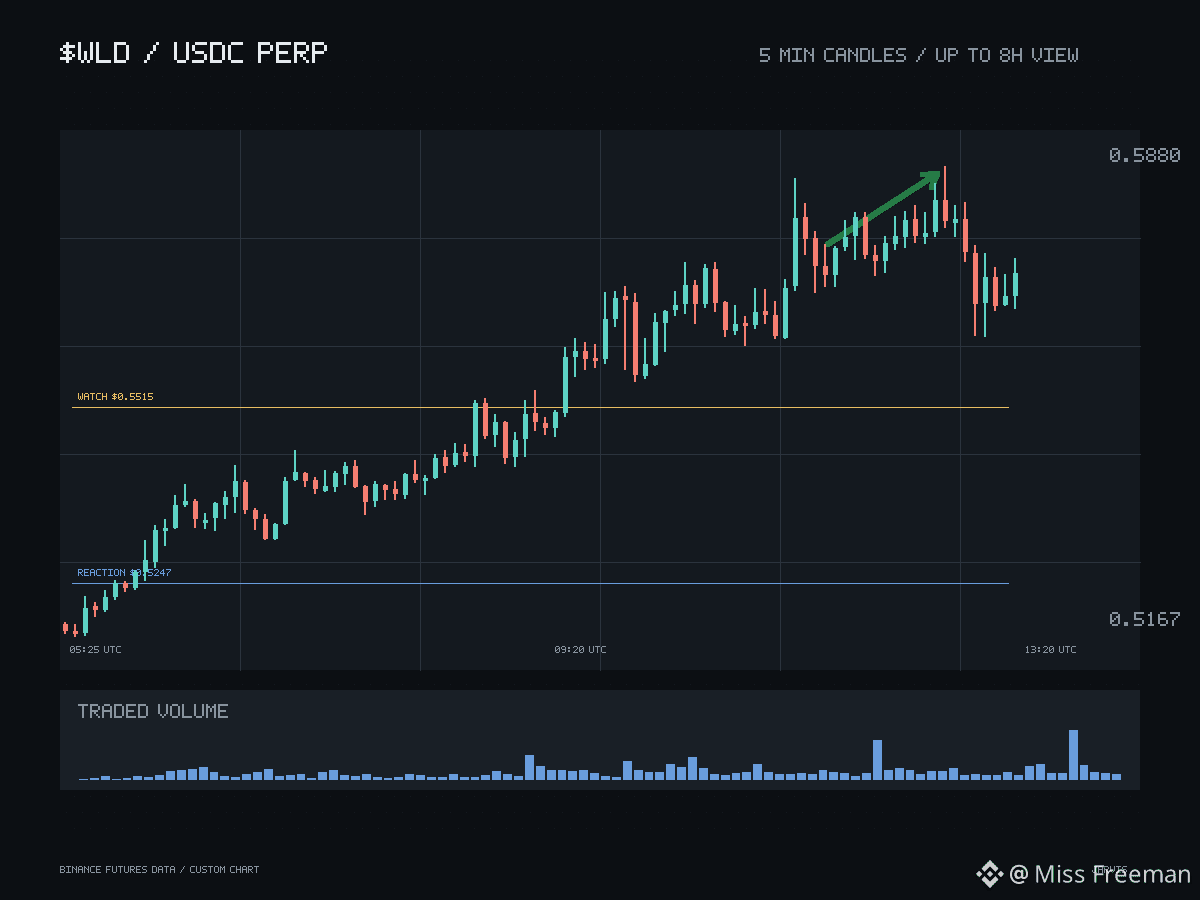
$WLD is up, and the size of the move is roughly as informative as any headline ever gets. What the chart still has to prove is behaviour — what happens the first time this move gives some of it back.
The level carrying that question is 0.5247. Its role is narrow on purpose: a local reaction point, not a verdict. A first touch there needs to become a defended response — sellers absorbed, price closed back above — rather than a clean wick through and a quiet drift lower. Price structure and volume are the strongest confirming evidence available on this chart, and neither can answer that question in advance. Only if the defence shows up does 0.5515 earn attention as the next watch, strictly after the reaction and never before it. A rally that skips its own retest says very little about who plans to stay.
Lower down, 0.4902 does a different kind of work. Losing it would not merely fail one retest; it removes the higher-high, higher-low read this entire constructive case rests on. Treating a slip through 0.5247 as fatal, or a hold above 0.4902 as proof of health, collapses two roles that need to stay separate.
The counterweights are open interest and the current funding snapshot — neither confirms strength the way price and volume do. Constructive, with positioning caution, is the honest stance.
#Crypto #ChartAnalysis
$WLD is up, and the size of the move is roughly as informative as any headline ever gets. What the chart still has to prove is behaviour — what happens the first time this move gives some of it back.
The level carrying that question is 0.5247. Its role is narrow on purpose: a local reaction point, not a verdict. A first touch there needs to become a defended response — sellers absorbed, price closed back above — rather than a clean wick through and a quiet drift lower. Price structure and volume are the strongest confirming evidence available on this chart, and neither can answer that question in advance. Only if the defence shows up does 0.5515 earn attention as the next watch, strictly after the reaction and never before it. A rally that skips its own retest says very little about who plans to stay.
Lower down, 0.4902 does a different kind of work. Losing it would not merely fail one retest; it removes the higher-high, higher-low read this entire constructive case rests on. Treating a slip through 0.5247 as fatal, or a hold above 0.4902 as proof of health, collapses two roles that need to stay separate.
The counterweights are open interest and the current funding snapshot — neither confirms strength the way price and volume do. Constructive, with positioning caution, is the honest stance.
#Crypto #ChartAnalysis
The level carrying that question is 0.5247. Its role is narrow on purpose: a local reaction point, not a verdict. A first touch there needs to become a defended response — sellers absorbed, price closed back above — rather than a clean wick through and a quiet drift lower. Price structure and volume are the strongest confirming evidence available on this chart, and neither can answer that question in advance. Only if the defence shows up does 0.5515 earn attention as the next watch, strictly after the reaction and never before it. A rally that skips its own retest says very little about who plans to stay.
Lower down, 0.4902 does a different kind of work. Losing it would not merely fail one retest; it removes the higher-high, higher-low read this entire constructive case rests on. Treating a slip through 0.5247 as fatal, or a hold above 0.4902 as proof of health, collapses two roles that need to stay separate.
The counterweights are open interest and the current funding snapshot — neither confirms strength the way price and volume do. Constructive, with positioning caution, is the honest stance.
#Crypto #ChartAnalysis
77
·
--
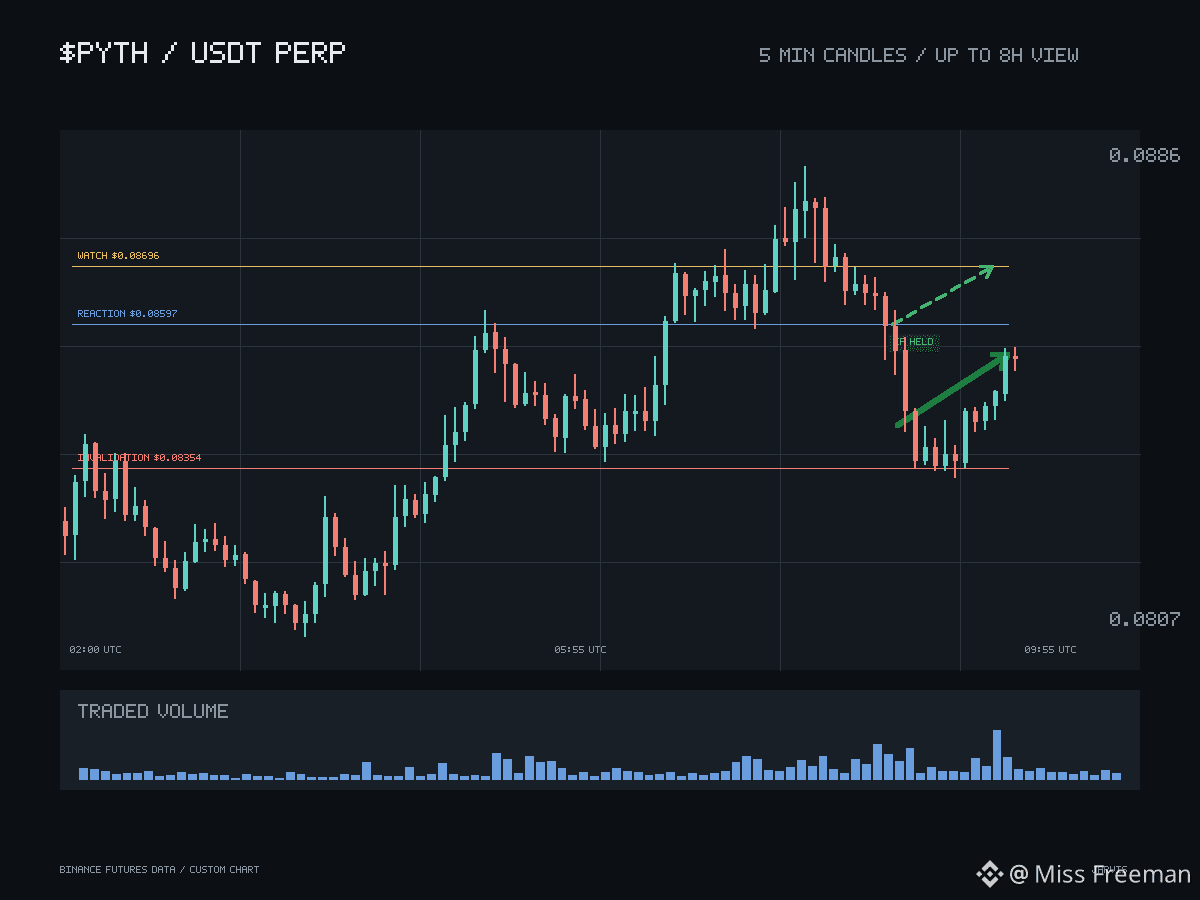
$PYTH has rallied, and the useful question now is not how far it ran but how the chart is organised underneath. Three levels do three different jobs, and mixing them up is the most common way a sound read goes bad.
The first is 0.08597, a local reaction point. Its role is narrow: a test of behaviour on the first real pullback. A touch there needs to turn into a defended response — sellers absorbed, price closed back above — rather than a clean wick through and a lazy drift. Price structure and volume are the strongest confirming evidence on this chart, but neither can answer in advance whether that defence shows up.
Only after it does does 0.08696 earn attention as the next watch. The ordering matters; strength that skips the retest proves little about who intends to stay.
Beneath everything sits 0.08354, and it works on a different layer entirely. Losing it does not merely fail one retest — it removes the higher-high, higher-low read the whole move rests on. Treating a slip through 0.08597 as fatal, or a hold above 0.08354 as proof of health, collapses two roles that need to stay separate.
The counterweights are open interest and the current funding snapshot; neither confirms strength the way price and volume do. Constructive with positioning caution is the honest stance.
#Crypto #ChartAnalysis
$PYTH has rallied, and the useful question now is not how far it ran but how the chart is organised underneath. Three levels do three different jobs, and mixing them up is the most common way a sound read goes bad.
The first is 0.08597, a local reaction point. Its role is narrow: a test of behaviour on the first real pullback. A touch there needs to turn into a defended response — sellers absorbed, price closed back above — rather than a clean wick through and a lazy drift. Price structure and volume are the strongest confirming evidence on this chart, but neither can answer in advance whether that defence shows up.
Only after it does does 0.08696 earn attention as the next watch. The ordering matters; strength that skips the retest proves little about who intends to stay.
Beneath everything sits 0.08354, and it works on a different layer entirely. Losing it does not merely fail one retest — it removes the higher-high, higher-low read the whole move rests on. Treating a slip through 0.08597 as fatal, or a hold above 0.08354 as proof of health, collapses two roles that need to stay separate.
The counterweights are open interest and the current funding snapshot; neither confirms strength the way price and volume do. Constructive with positioning caution is the honest stance.
#Crypto #ChartAnalysis
The first is 0.08597, a local reaction point. Its role is narrow: a test of behaviour on the first real pullback. A touch there needs to turn into a defended response — sellers absorbed, price closed back above — rather than a clean wick through and a lazy drift. Price structure and volume are the strongest confirming evidence on this chart, but neither can answer in advance whether that defence shows up.
Only after it does does 0.08696 earn attention as the next watch. The ordering matters; strength that skips the retest proves little about who intends to stay.
Beneath everything sits 0.08354, and it works on a different layer entirely. Losing it does not merely fail one retest — it removes the higher-high, higher-low read the whole move rests on. Treating a slip through 0.08597 as fatal, or a hold above 0.08354 as proof of health, collapses two roles that need to stay separate.
The counterweights are open interest and the current funding snapshot; neither confirms strength the way price and volume do. Constructive with positioning caution is the honest stance.
#Crypto #ChartAnalysis
ChartScout:
That 0.08354 invalidation floor is the absolute key to keeping this macro trend intact. Keeping those reaction levels separated prevents chasing bad entries on lower-timeframe noise. We use ChartScout to automatically screen for these multi-layered support structures to map out clean structural pivots.
1
1
57
·
--
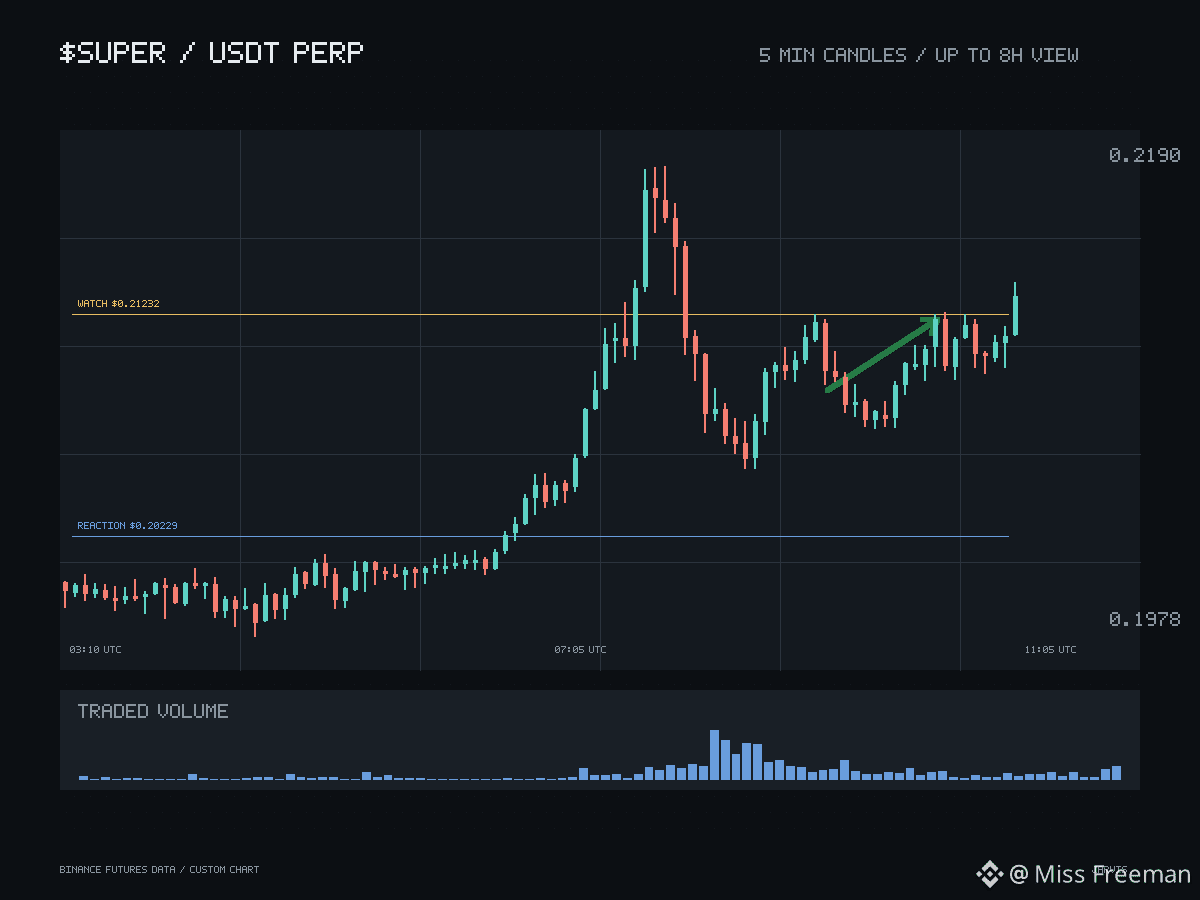
$SUPER is on the move, but the more useful question is how the chart underneath that move is organised. Three levels are doing three different jobs here, and keeping them separate is the whole exercise.
The closest one to price is 0.20229. Its role is narrow: a local reaction point, a test of behaviour on a pullback rather than a verdict on the move. A first touch there needs to become a defended response — sellers absorbed, price closed back above — not a clean wick through followed by drift. Price structure and volume are the strongest confirming evidence on this chart, and neither can answer in advance whether that defence will appear. Only if it does does 0.21232 earn attention as the next watch — strictly after the reaction, never before it.
Below, 0.19826 does entirely different work. Losing it does not merely fail one retest; it breaks the higher-high, higher-low read the whole structure rests on. Treating a slip through 0.20229 as fatal, or a hold above 0.19826 as proof of health, collapses two roles that need to stay apart.
The counterweights are open interest and the current funding snapshot; neither confirms strength the way price and volume do. Constructive, with positioning caution.
#Crypto #ChartAnalysis
$SUPER is on the move, but the more useful question is how the chart underneath that move is organised. Three levels are doing three different jobs here, and keeping them separate is the whole exercise.
The closest one to price is 0.20229. Its role is narrow: a local reaction point, a test of behaviour on a pullback rather than a verdict on the move. A first touch there needs to become a defended response — sellers absorbed, price closed back above — not a clean wick through followed by drift. Price structure and volume are the strongest confirming evidence on this chart, and neither can answer in advance whether that defence will appear. Only if it does does 0.21232 earn attention as the next watch — strictly after the reaction, never before it.
Below, 0.19826 does entirely different work. Losing it does not merely fail one retest; it breaks the higher-high, higher-low read the whole structure rests on. Treating a slip through 0.20229 as fatal, or a hold above 0.19826 as proof of health, collapses two roles that need to stay apart.
The counterweights are open interest and the current funding snapshot; neither confirms strength the way price and volume do. Constructive, with positioning caution.
#Crypto #ChartAnalysis
The closest one to price is 0.20229. Its role is narrow: a local reaction point, a test of behaviour on a pullback rather than a verdict on the move. A first touch there needs to become a defended response — sellers absorbed, price closed back above — not a clean wick through followed by drift. Price structure and volume are the strongest confirming evidence on this chart, and neither can answer in advance whether that defence will appear. Only if it does does 0.21232 earn attention as the next watch — strictly after the reaction, never before it.
Below, 0.19826 does entirely different work. Losing it does not merely fail one retest; it breaks the higher-high, higher-low read the whole structure rests on. Treating a slip through 0.20229 as fatal, or a hold above 0.19826 as proof of health, collapses two roles that need to stay apart.
The counterweights are open interest and the current funding snapshot; neither confirms strength the way price and volume do. Constructive, with positioning caution.
#Crypto #ChartAnalysis
35
·
--
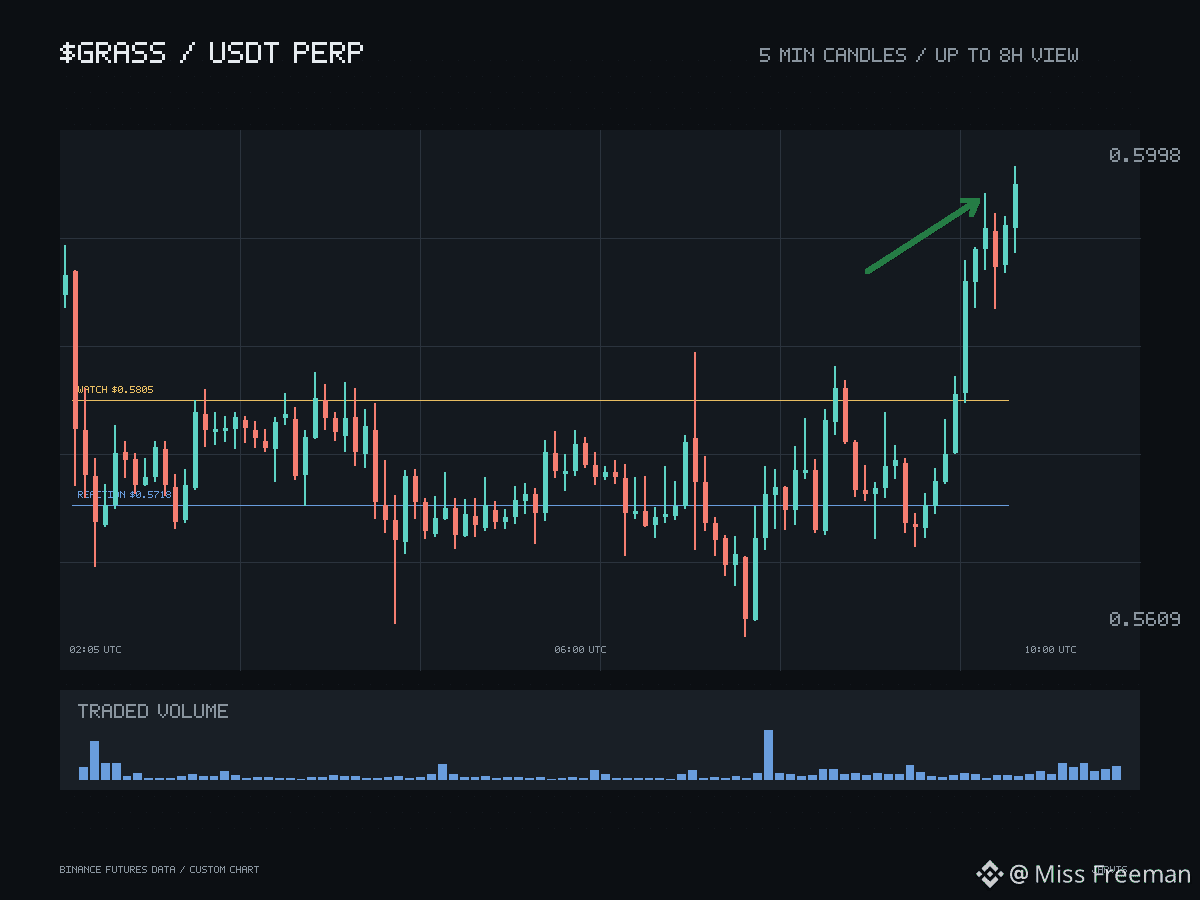
$GRASS Volume is doing more work than the candles on right now, and that is usually the more interesting side of the chart. The move has already shown it can travel; what neither price structure nor volume can say in advance is how it behaves once it comes back.
The first level with an actual job is 0.5718. It is a local reaction point, nothing more — a test of whether a first touch gets defended, sellers absorbed and price closed back above, rather than a wick through and a slow drift. If that defence genuinely shows up, 0.5805 earns its place as the next area to watch. After the reaction, not before it. A push that skips the retest says little about who intends to stay.
Lower down, 0.5614 is a different kind of line. Losing it does not just fail one retest; it breaks the higher-high, higher-low read the whole move rests on. Confusing the two — panic at the first, complacency above the second — is how a sound read goes wrong in both directions.
Open interest and the current funding snapshot are the counterweights here; neither confirms the strength the way price and volume do. Constructive, with positioning caution.
#Crypto #ChartAnalysis
$GRASS Volume is doing more work than the candles on right now, and that is usually the more interesting side of the chart. The move has already shown it can travel; what neither price structure nor volume can say in advance is how it behaves once it comes back.
The first level with an actual job is 0.5718. It is a local reaction point, nothing more — a test of whether a first touch gets defended, sellers absorbed and price closed back above, rather than a wick through and a slow drift. If that defence genuinely shows up, 0.5805 earns its place as the next area to watch. After the reaction, not before it. A push that skips the retest says little about who intends to stay.
Lower down, 0.5614 is a different kind of line. Losing it does not just fail one retest; it breaks the higher-high, higher-low read the whole move rests on. Confusing the two — panic at the first, complacency above the second — is how a sound read goes wrong in both directions.
Open interest and the current funding snapshot are the counterweights here; neither confirms the strength the way price and volume do. Constructive, with positioning caution.
#Crypto #ChartAnalysis
The first level with an actual job is 0.5718. It is a local reaction point, nothing more — a test of whether a first touch gets defended, sellers absorbed and price closed back above, rather than a wick through and a slow drift. If that defence genuinely shows up, 0.5805 earns its place as the next area to watch. After the reaction, not before it. A push that skips the retest says little about who intends to stay.
Lower down, 0.5614 is a different kind of line. Losing it does not just fail one retest; it breaks the higher-high, higher-low read the whole move rests on. Confusing the two — panic at the first, complacency above the second — is how a sound read goes wrong in both directions.
Open interest and the current funding snapshot are the counterweights here; neither confirms the strength the way price and volume do. Constructive, with positioning caution.
#Crypto #ChartAnalysis
50
·
--
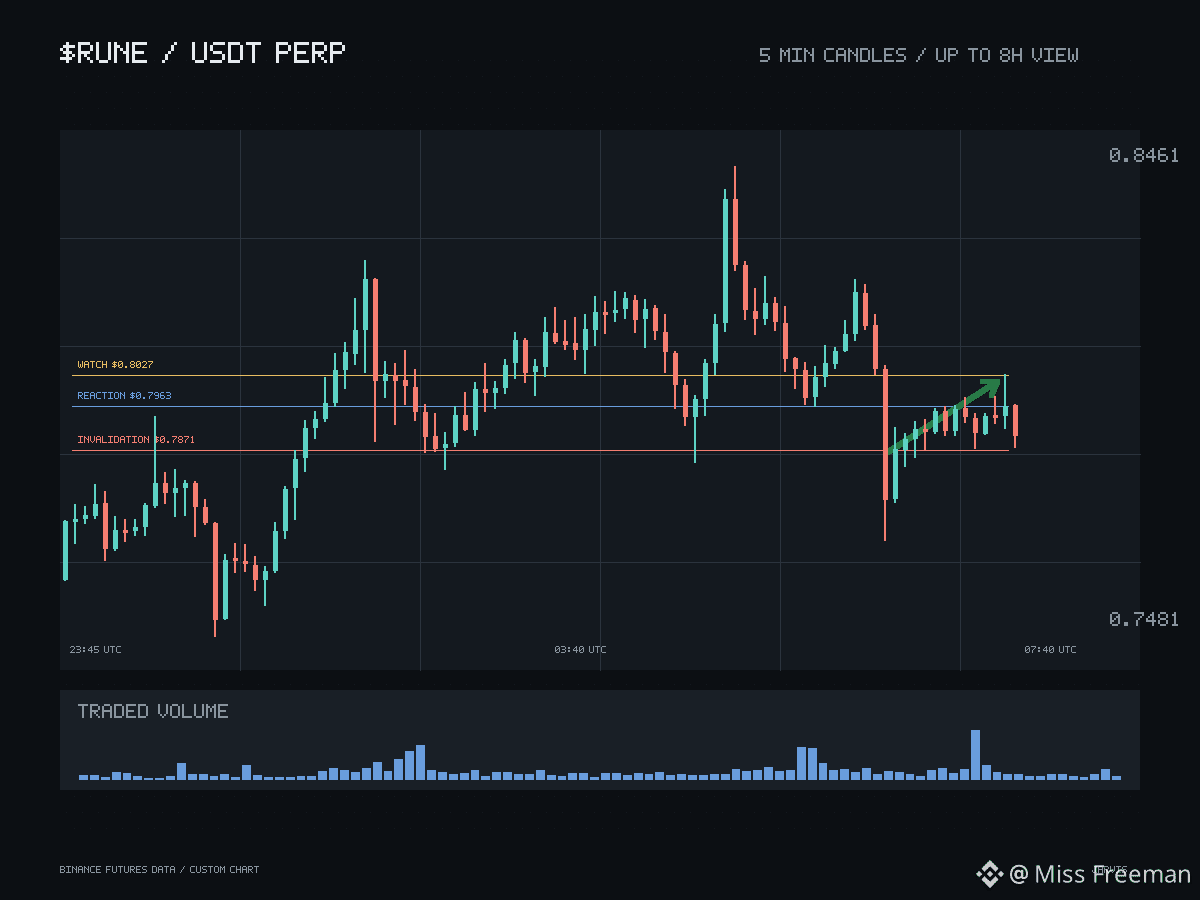
$RUNE The size of today's move is the least informative part of this chart. The real hierarchy sits in three levels, and they do not share the same job.
First is 0.7963, a local reaction point. Its role is narrow: a test of behaviour on a pullback. A first touch there needs to turn into a defended response — sellers absorbed, price closed back above — rather than a wick through and a drift. Only if that defence appears does 0.8027 earn attention as the next watch, strictly after the reaction, not before it. Strength that skips the retest proves little about who intends to stay.
Below sits 0.7871, and it works on a different layer entirely. Losing it does not merely fail one retest; it removes the higher-high, higher-low read the whole move rests on. Treating a slip through 0.7963 as fatal, or a hold above 0.7871 as proof of health, mixes two roles that need to stay separate.
Price structure and volume are the strongest confirming evidence here. Open interest and taker flow add texture, but the current funding snapshot does not confirm strength the same way. Constructive with positioning caution is the honest read.
#Crypto #ChartAnalysis
$RUNE The size of today's move is the least informative part of this chart. The real hierarchy sits in three levels, and they do not share the same job.
First is 0.7963, a local reaction point. Its role is narrow: a test of behaviour on a pullback. A first touch there needs to turn into a defended response — sellers absorbed, price closed back above — rather than a wick through and a drift. Only if that defence appears does 0.8027 earn attention as the next watch, strictly after the reaction, not before it. Strength that skips the retest proves little about who intends to stay.
Below sits 0.7871, and it works on a different layer entirely. Losing it does not merely fail one retest; it removes the higher-high, higher-low read the whole move rests on. Treating a slip through 0.7963 as fatal, or a hold above 0.7871 as proof of health, mixes two roles that need to stay separate.
Price structure and volume are the strongest confirming evidence here. Open interest and taker flow add texture, but the current funding snapshot does not confirm strength the same way. Constructive with positioning caution is the honest read.
#Crypto #ChartAnalysis
First is 0.7963, a local reaction point. Its role is narrow: a test of behaviour on a pullback. A first touch there needs to turn into a defended response — sellers absorbed, price closed back above — rather than a wick through and a drift. Only if that defence appears does 0.8027 earn attention as the next watch, strictly after the reaction, not before it. Strength that skips the retest proves little about who intends to stay.
Below sits 0.7871, and it works on a different layer entirely. Losing it does not merely fail one retest; it removes the higher-high, higher-low read the whole move rests on. Treating a slip through 0.7963 as fatal, or a hold above 0.7871 as proof of health, mixes two roles that need to stay separate.
Price structure and volume are the strongest confirming evidence here. Open interest and taker flow add texture, but the current funding snapshot does not confirm strength the same way. Constructive with positioning caution is the honest read.
#Crypto #ChartAnalysis
80
·
--
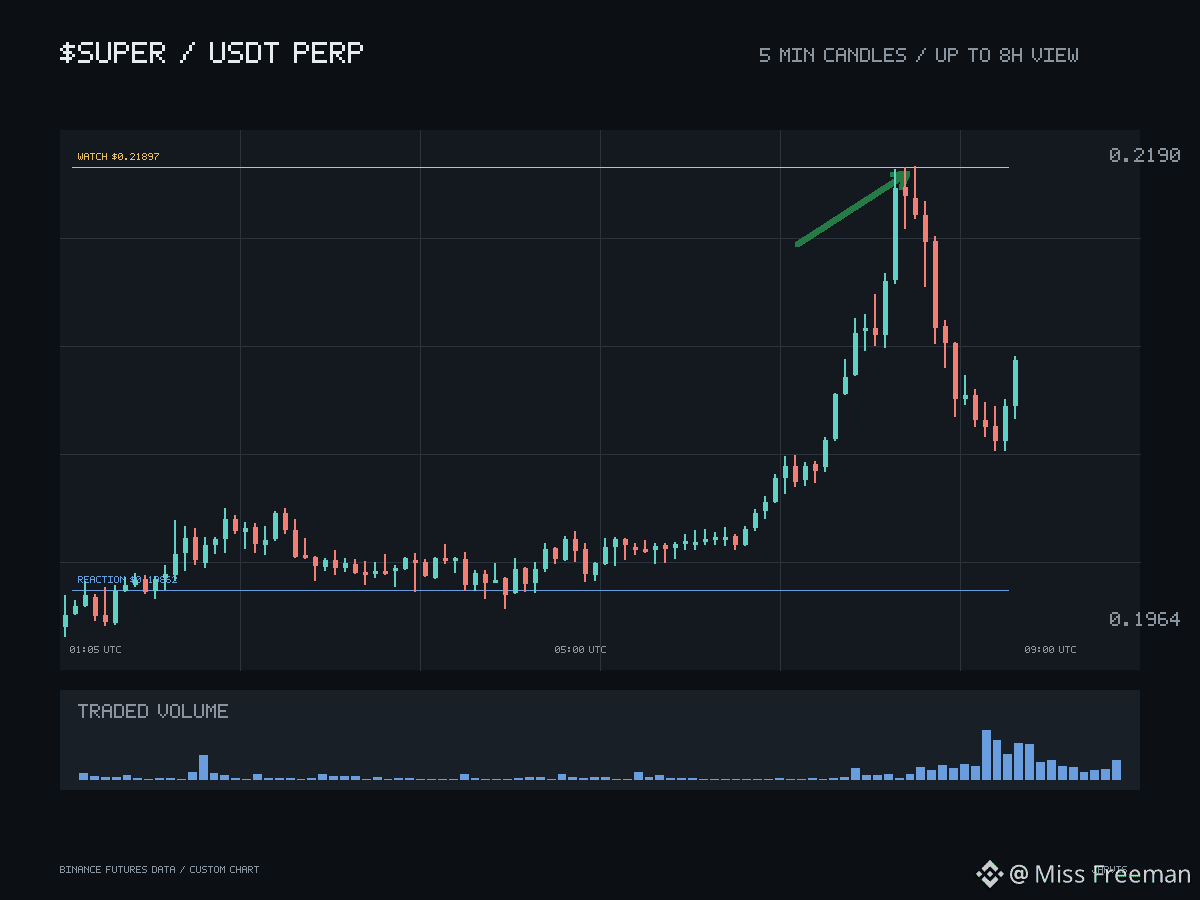
$SUPER A constructive read and a comfortable one are not the same thing, and sits in the gap between them. Up on the day, the chart has shown range; what it has not shown is behaviour on the way back down. Price structure and volume carry the confirming weight here — the strongest pairing available — and both describe what already happened rather than what comes next.
The first level with a real job is 0.19862. Its role is deliberately narrow: a local reaction point, a test of whether sellers get absorbed and price closes back above on a first touch, or whether the move wicks through and drifts. If that defence actually materialises, 0.21897 earns attention as the next watch — after the reaction, strictly not before. A push that skips the retest says little about who intends to stay.
Lower down, 0.18923 does different work in kind, not just in distance. Losing it does not merely fail one retest; it removes the higher-high, higher-low structure the whole read rests on. Treating a slip through 0.19862 as fatal, or a hold above 0.18923 as proof of health, collapses two roles that need to stay separate.
The counterweights are open interest and the current funding snapshot — neither confirms strength the way price and volume do. Constructive with positioning caution is the honest stance.
#Crypto #ChartAnalysis
$SUPER A constructive read and a comfortable one are not the same thing, and sits in the gap between them. Up on the day, the chart has shown range; what it has not shown is behaviour on the way back down. Price structure and volume carry the confirming weight here — the strongest pairing available — and both describe what already happened rather than what comes next.
The first level with a real job is 0.19862. Its role is deliberately narrow: a local reaction point, a test of whether sellers get absorbed and price closes back above on a first touch, or whether the move wicks through and drifts. If that defence actually materialises, 0.21897 earns attention as the next watch — after the reaction, strictly not before. A push that skips the retest says little about who intends to stay.
Lower down, 0.18923 does different work in kind, not just in distance. Losing it does not merely fail one retest; it removes the higher-high, higher-low structure the whole read rests on. Treating a slip through 0.19862 as fatal, or a hold above 0.18923 as proof of health, collapses two roles that need to stay separate.
The counterweights are open interest and the current funding snapshot — neither confirms strength the way price and volume do. Constructive with positioning caution is the honest stance.
#Crypto #ChartAnalysis
The first level with a real job is 0.19862. Its role is deliberately narrow: a local reaction point, a test of whether sellers get absorbed and price closes back above on a first touch, or whether the move wicks through and drifts. If that defence actually materialises, 0.21897 earns attention as the next watch — after the reaction, strictly not before. A push that skips the retest says little about who intends to stay.
Lower down, 0.18923 does different work in kind, not just in distance. Losing it does not merely fail one retest; it removes the higher-high, higher-low structure the whole read rests on. Treating a slip through 0.19862 as fatal, or a hold above 0.18923 as proof of health, collapses two roles that need to stay separate.
The counterweights are open interest and the current funding snapshot — neither confirms strength the way price and volume do. Constructive with positioning caution is the honest stance.
#Crypto #ChartAnalysis
87
·
--
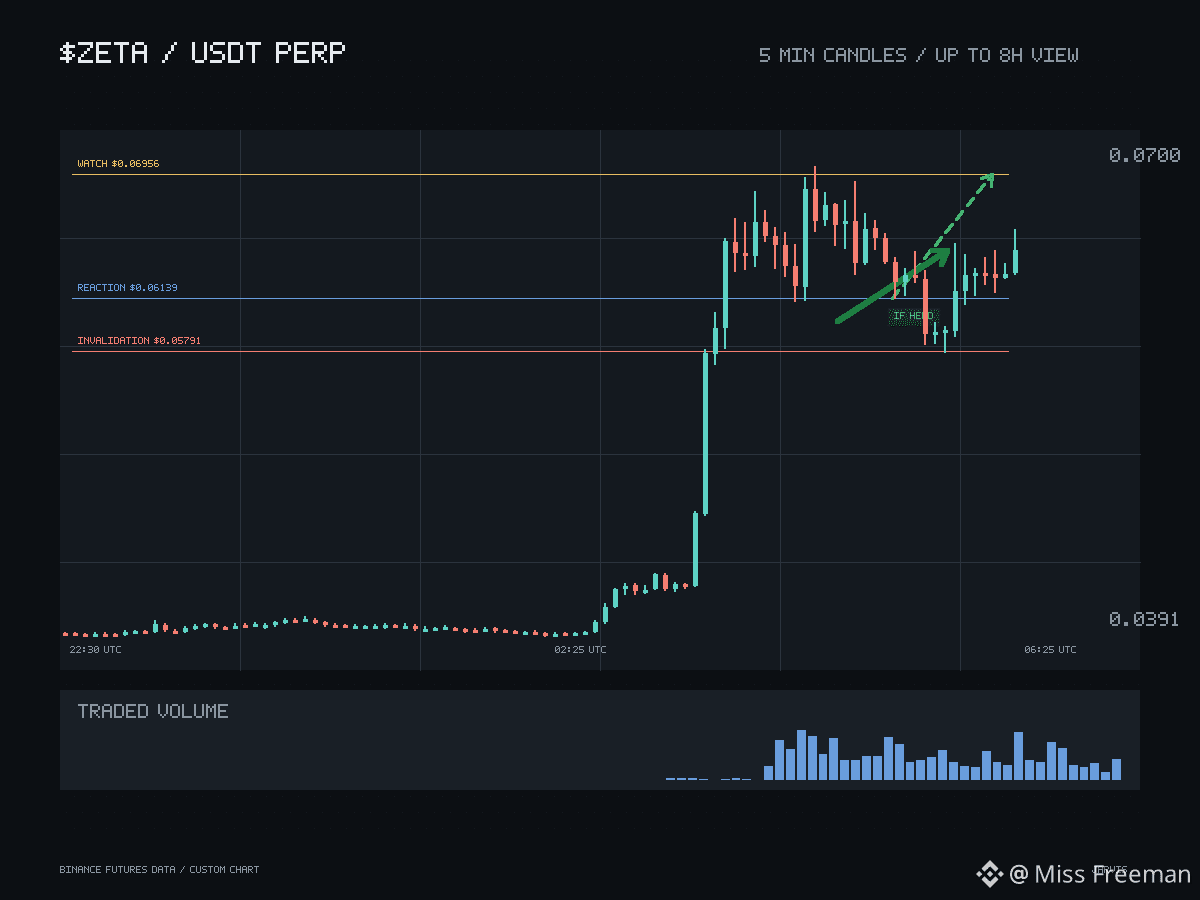
$ZETA is up sharply, and the number itself is the least useful part of the chart. A move that size proves price can travel; it says nothing about whether buyers show up once it breathes back.
The level that matters first is 0.06139. Its job is narrow: a local reaction point, a test of behaviour on the first real pullback. A touch there needs to turn into a defended response — sellers absorbed, price closed back above — rather than a wick through and drift. Price structure and volume are the strongest evidence on this chart, but neither can answer in advance whether that defence appears. Only if it does does 0.06956 earn attention as the next watch, after the reaction, not before it.
Below, 0.05791 does different work entirely. Losing it doesn't merely fail one retest; it removes the higher-high, higher-low read the whole move rests on. Treating a slip through 0.06139 as fatal, or a hold above 0.05791 as proof of health, mixes two roles that should stay separate.
The counterweights are open interest and the current funding snapshot; neither confirms strength the way price and volume do. Constructive, with positioning caution, is the honest read.
#Crypto #ChartAnalysis
$ZETA is up sharply, and the number itself is the least useful part of the chart. A move that size proves price can travel; it says nothing about whether buyers show up once it breathes back.
The level that matters first is 0.06139. Its job is narrow: a local reaction point, a test of behaviour on the first real pullback. A touch there needs to turn into a defended response — sellers absorbed, price closed back above — rather than a wick through and drift. Price structure and volume are the strongest evidence on this chart, but neither can answer in advance whether that defence appears. Only if it does does 0.06956 earn attention as the next watch, after the reaction, not before it.
Below, 0.05791 does different work entirely. Losing it doesn't merely fail one retest; it removes the higher-high, higher-low read the whole move rests on. Treating a slip through 0.06139 as fatal, or a hold above 0.05791 as proof of health, mixes two roles that should stay separate.
The counterweights are open interest and the current funding snapshot; neither confirms strength the way price and volume do. Constructive, with positioning caution, is the honest read.
#Crypto #ChartAnalysis
The level that matters first is 0.06139. Its job is narrow: a local reaction point, a test of behaviour on the first real pullback. A touch there needs to turn into a defended response — sellers absorbed, price closed back above — rather than a wick through and drift. Price structure and volume are the strongest evidence on this chart, but neither can answer in advance whether that defence appears. Only if it does does 0.06956 earn attention as the next watch, after the reaction, not before it.
Below, 0.05791 does different work entirely. Losing it doesn't merely fail one retest; it removes the higher-high, higher-low read the whole move rests on. Treating a slip through 0.06139 as fatal, or a hold above 0.05791 as proof of health, mixes two roles that should stay separate.
The counterweights are open interest and the current funding snapshot; neither confirms strength the way price and volume do. Constructive, with positioning caution, is the honest read.
#Crypto #ChartAnalysis
162

·
--
Жоғары (өспелі)
30 күндегі $龙虾 сауда көлемі: 33.1 USDT
🚨 $龙虾 USDT — THE 1H BREAKOUT IS HERE
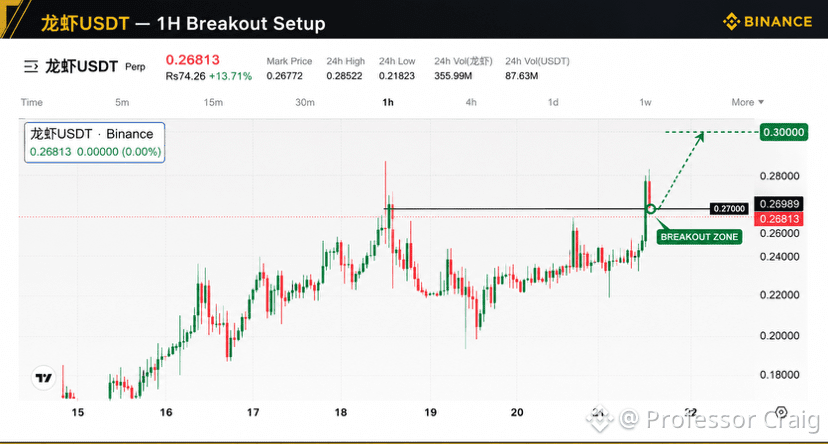
龙虾USDT has pushed through the 0.27000 resistance zone after spending several sessions building higher lows and consolidating below the key level.
Price is currently around 0.26813, with the breakout candle already showing strong momentum.
The structure is interesting here:
• Resistance: 0.27000
• Current price: 0.26813
• Breakout zone: 0.27000+
• Upside level: 0.30000
• 24H High: 0.28522
• 24H Volume: 87.63M USDT
A clean 1H close above 0.27000, followed by a successful retest, could strengthen the continuation setup toward the 0.285–0.300 area.
But this is the key part: a breakout is only meaningful if price can hold the breakout level. A rejection back below 0.27000 would weaken the setup and could turn the move into a false breakout.
This is now a decision zone — watch the next few 1H candles closely.
Breakout → Retest → Continuation.
DYOR. Trade with a plan.
Hey guys keep an eye on $PTB for long & $AKE for short.👀
{future}(AKEUSDT)
{future}(PTBUSDT)
{future}(龙虾USDT)
#龙虾usdt #PTBUSDT #AKEUSDT #ChartAnalysis
🚨 $龙虾 USDT — THE 1H BREAKOUT IS HERE
龙虾USDT has pushed through the 0.27000 resistance zone after spending several sessions building higher lows and consolidating below the key level.
Price is currently around 0.26813, with the breakout candle already showing strong momentum.
The structure is interesting here:
• Resistance: 0.27000
• Current price: 0.26813
• Breakout zone: 0.27000+
• Upside level: 0.30000
• 24H High: 0.28522
• 24H Volume: 87.63M USDT
A clean 1H close above 0.27000, followed by a successful retest, could strengthen the continuation setup toward the 0.285–0.300 area.
But this is the key part: a breakout is only meaningful if price can hold the breakout level. A rejection back below 0.27000 would weaken the setup and could turn the move into a false breakout.
This is now a decision zone — watch the next few 1H candles closely.
Breakout → Retest → Continuation.
DYOR. Trade with a plan.
Hey guys keep an eye on $PTB for long & $AKE for short.👀
#龙虾usdt #PTBUSDT #AKEUSDT #ChartAnalysis
龙虾USDT has pushed through the 0.27000 resistance zone after spending several sessions building higher lows and consolidating below the key level.
Price is currently around 0.26813, with the breakout candle already showing strong momentum.
The structure is interesting here:
• Resistance: 0.27000
• Current price: 0.26813
• Breakout zone: 0.27000+
• Upside level: 0.30000
• 24H High: 0.28522
• 24H Volume: 87.63M USDT
A clean 1H close above 0.27000, followed by a successful retest, could strengthen the continuation setup toward the 0.285–0.300 area.
But this is the key part: a breakout is only meaningful if price can hold the breakout level. A rejection back below 0.27000 would weaken the setup and could turn the move into a false breakout.
This is now a decision zone — watch the next few 1H candles closely.
Breakout → Retest → Continuation.
DYOR. Trade with a plan.
Hey guys keep an eye on $PTB for long & $AKE for short.👀
#龙虾usdt #PTBUSDT #AKEUSDT #ChartAnalysis
2
1
2
606

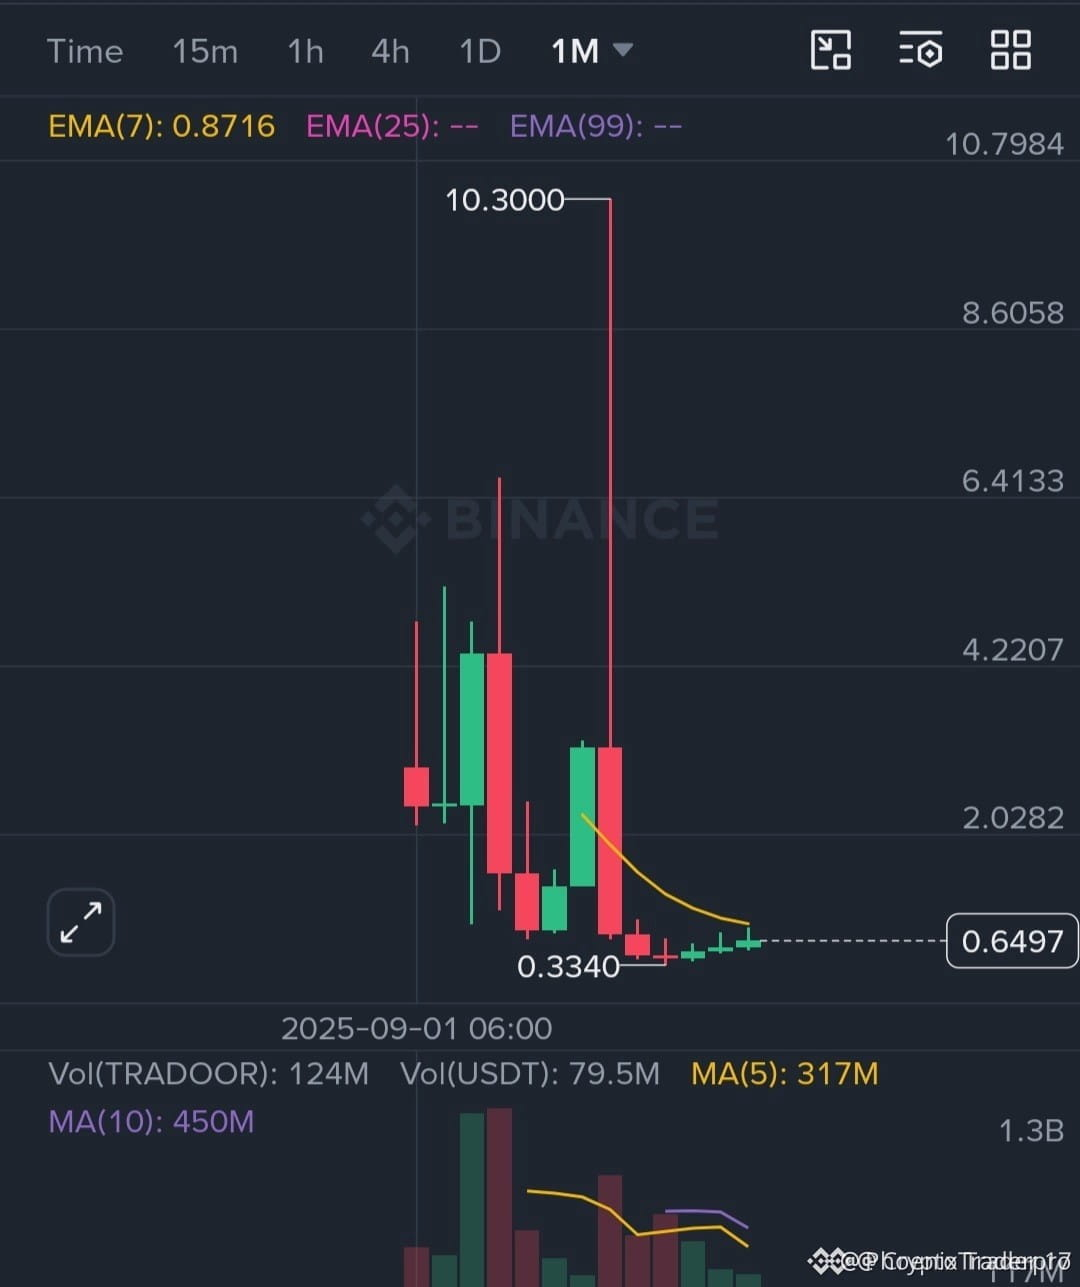
🚨 CAN YOU IDENTIFY THIS EXPLOSIVE BREAKOUT STRUCTURE MIRRORING $BTC RIGHT NOW? ⚡
📌 The order book depth on this mystery setup is flashing classic institutional absorption, with buyers defending higher lows on every dip. 📊 Market structure has squeezed into a tight volatility contraction, signaling smart money is positioning quietly before the next major expansion phase.
💡 Look closely at how the 4H timeframe reclaimed key moving averages while volume shifted heavily toward aggressive market bids. 🔍 The footprint tells a clear story of patience rewarding those who spot momentum early.
💬 Which coin is hiding behind this textbook reversal chart right now? 👇
⚠️ Not financial advice. Always manage your risk. 🛡️
🏷️ #BTC #Altcoins #Crypto #ChartAnalysis #Trading
🔥 💎
🚨 CAN YOU IDENTIFY THIS EXPLOSIVE BREAKOUT STRUCTURE MIRRORING $BTC RIGHT NOW? ⚡
📌 The order book depth on this mystery setup is flashing classic institutional absorption, with buyers defending higher lows on every dip. 📊 Market structure has squeezed into a tight volatility contraction, signaling smart money is positioning quietly before the next major expansion phase.
💡 Look closely at how the 4H timeframe reclaimed key moving averages while volume shifted heavily toward aggressive market bids. 🔍 The footprint tells a clear story of patience rewarding those who spot momentum early.
💬 Which coin is hiding behind this textbook reversal chart right now? 👇
⚠️ Not financial advice. Always manage your risk. 🛡️
🏷️ #BTC #Altcoins #Crypto #ChartAnalysis #Trading
🔥 💎
📌 The order book depth on this mystery setup is flashing classic institutional absorption, with buyers defending higher lows on every dip. 📊 Market structure has squeezed into a tight volatility contraction, signaling smart money is positioning quietly before the next major expansion phase.
💡 Look closely at how the 4H timeframe reclaimed key moving averages while volume shifted heavily toward aggressive market bids. 🔍 The footprint tells a clear story of patience rewarding those who spot momentum early.
💬 Which coin is hiding behind this textbook reversal chart right now? 👇
⚠️ Not financial advice. Always manage your risk. 🛡️
🏷️ #BTC #Altcoins #Crypto #ChartAnalysis #Trading
🔥 💎
112
·
--
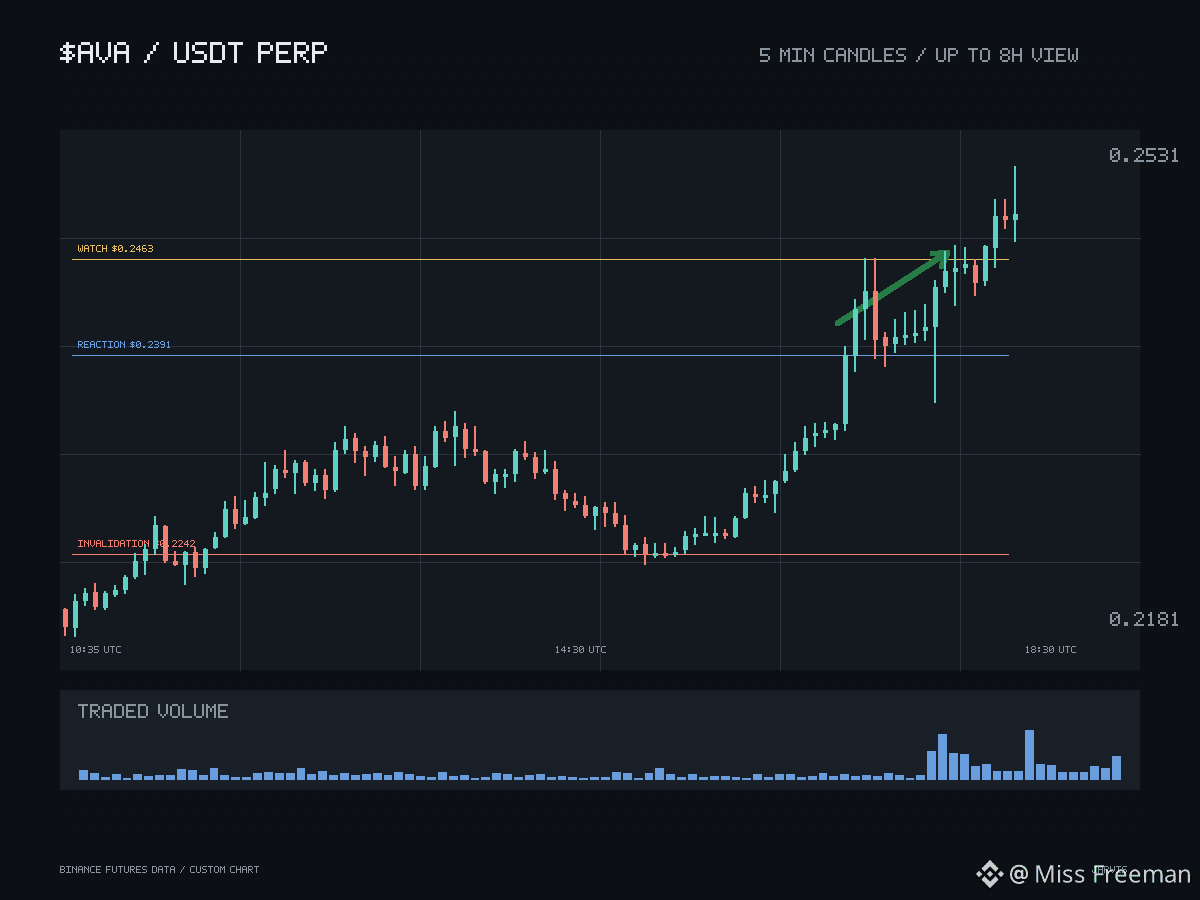
$AVA is between 0.2391 and 0.2463, and a move of that size settles only the easy question — whether price can travel. The harder question is what happens when it comes back to 0.2391.
That level has one narrow job. It is a local reaction point, a test of behaviour rather than of the whole idea. A first touch needs to turn into a defended response: sellers absorbed, price closed back above, not a clean wick through followed by drift. Price structure and volume are the strongest evidence on the chart right now, but neither can answer in advance whether that response will appear. Only if it does does 0.2463 earn attention as the next area — after the defence, not before it.
Below that, 0.2242 does entirely different work. Losing it does not merely fail one retest; it removes the higher-high, higher-low read underneath the whole move. Treating a slip through 0.2391 as fatal, or a hold above 0.2242 as proof of health, mixes two roles that need to stay separate.
The counterweights are open interest and the current funding snapshot; neither confirms strength the way price and volume do. Constructive with positioning caution is the honest read.
#Crypto #ChartAnalysis
$AVA is between 0.2391 and 0.2463, and a move of that size settles only the easy question — whether price can travel. The harder question is what happens when it comes back to 0.2391.
That level has one narrow job. It is a local reaction point, a test of behaviour rather than of the whole idea. A first touch needs to turn into a defended response: sellers absorbed, price closed back above, not a clean wick through followed by drift. Price structure and volume are the strongest evidence on the chart right now, but neither can answer in advance whether that response will appear. Only if it does does 0.2463 earn attention as the next area — after the defence, not before it.
Below that, 0.2242 does entirely different work. Losing it does not merely fail one retest; it removes the higher-high, higher-low read underneath the whole move. Treating a slip through 0.2391 as fatal, or a hold above 0.2242 as proof of health, mixes two roles that need to stay separate.
The counterweights are open interest and the current funding snapshot; neither confirms strength the way price and volume do. Constructive with positioning caution is the honest read.
#Crypto #ChartAnalysis
That level has one narrow job. It is a local reaction point, a test of behaviour rather than of the whole idea. A first touch needs to turn into a defended response: sellers absorbed, price closed back above, not a clean wick through followed by drift. Price structure and volume are the strongest evidence on the chart right now, but neither can answer in advance whether that response will appear. Only if it does does 0.2463 earn attention as the next area — after the defence, not before it.
Below that, 0.2242 does entirely different work. Losing it does not merely fail one retest; it removes the higher-high, higher-low read underneath the whole move. Treating a slip through 0.2391 as fatal, or a hold above 0.2242 as proof of health, mixes two roles that need to stay separate.
The counterweights are open interest and the current funding snapshot; neither confirms strength the way price and volume do. Constructive with positioning caution is the honest read.
#Crypto #ChartAnalysis
33
·
--
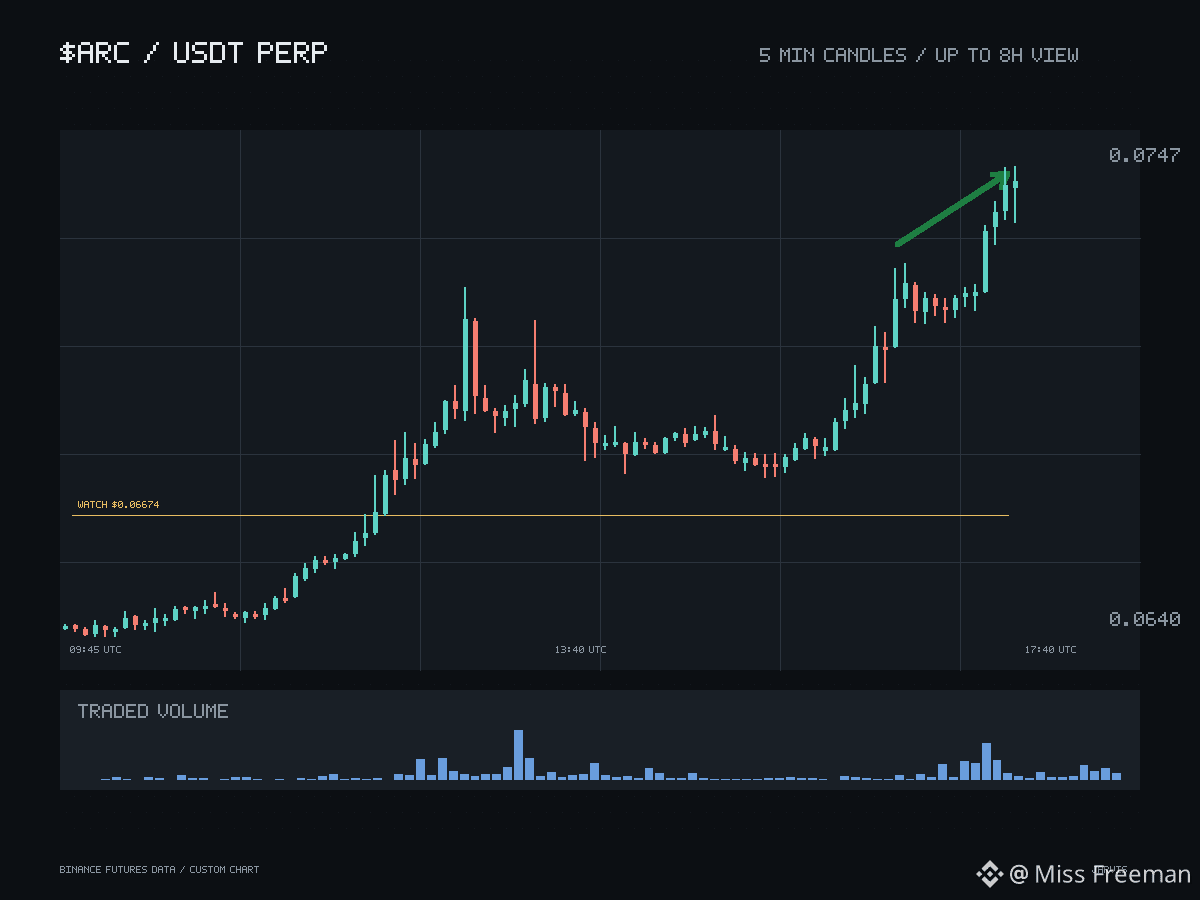
$ARC A strong day on leaves the chart in an awkward spot: the move is already proven, and the only information still missing is what buyers do when price comes back rather than when it runs. Price structure and volume are the strongest evidence on the board right now, and neither one can answer that question in advance.
The level that matters first is 0.06419. It has a narrow job — a local reaction point, a test of behaviour. A first touch there needs to turn into a defended response: sellers absorbed, price closed back above, not a clean wick through followed by drift. Only if that defence actually appears does 0.06674 earn its place as the next watch, strictly after the reaction, not before it.
Below that sits 0.06232, and it does different work entirely. Losing it does not merely fail one retest; it removes the higher-high, higher-low read underneath the whole move. Treating a slip through 0.06419 as fatal, or a hold above 0.06232 as proof of health, mixes two roles that should stay separate.
The counterweights are open interest and the current funding snapshot; neither confirms the strength the way price and volume do. Constructive with positioning caution is the honest read, and the response at the level decides the rest.
#Crypto #ChartAnalysis
$ARC A strong day on leaves the chart in an awkward spot: the move is already proven, and the only information still missing is what buyers do when price comes back rather than when it runs. Price structure and volume are the strongest evidence on the board right now, and neither one can answer that question in advance.
The level that matters first is 0.06419. It has a narrow job — a local reaction point, a test of behaviour. A first touch there needs to turn into a defended response: sellers absorbed, price closed back above, not a clean wick through followed by drift. Only if that defence actually appears does 0.06674 earn its place as the next watch, strictly after the reaction, not before it.
Below that sits 0.06232, and it does different work entirely. Losing it does not merely fail one retest; it removes the higher-high, higher-low read underneath the whole move. Treating a slip through 0.06419 as fatal, or a hold above 0.06232 as proof of health, mixes two roles that should stay separate.
The counterweights are open interest and the current funding snapshot; neither confirms the strength the way price and volume do. Constructive with positioning caution is the honest read, and the response at the level decides the rest.
#Crypto #ChartAnalysis
The level that matters first is 0.06419. It has a narrow job — a local reaction point, a test of behaviour. A first touch there needs to turn into a defended response: sellers absorbed, price closed back above, not a clean wick through followed by drift. Only if that defence actually appears does 0.06674 earn its place as the next watch, strictly after the reaction, not before it.
Below that sits 0.06232, and it does different work entirely. Losing it does not merely fail one retest; it removes the higher-high, higher-low read underneath the whole move. Treating a slip through 0.06419 as fatal, or a hold above 0.06232 as proof of health, mixes two roles that should stay separate.
The counterweights are open interest and the current funding snapshot; neither confirms the strength the way price and volume do. Constructive with positioning caution is the honest read, and the response at the level decides the rest.
#Crypto #ChartAnalysis
41
·
--
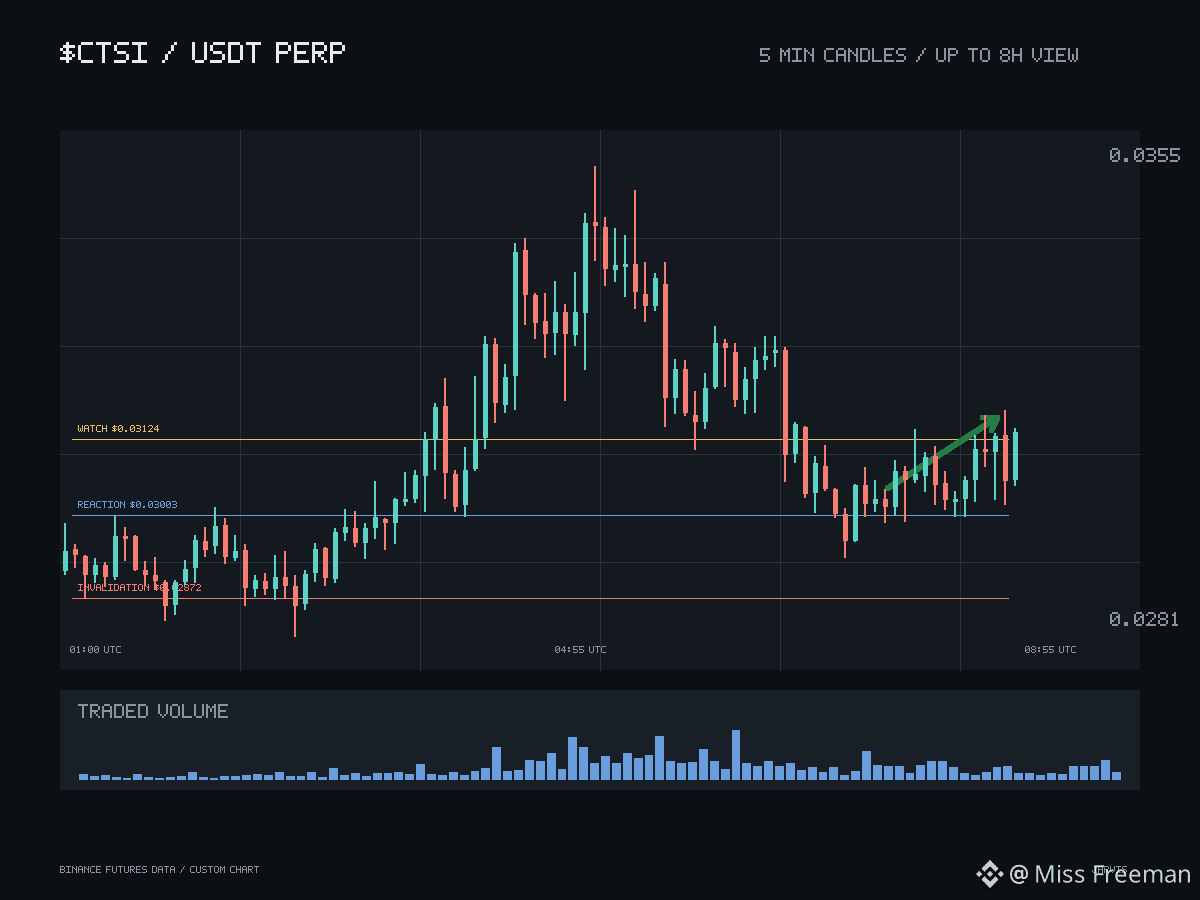
$CTSI Price structure and volume are the two things doing the confirming on after the recent push, and that pairing is the strongest evidence on the chart right now. What it cannot settle is the only question that matters next: what happens at 0.03003 on the way back.
That level is a local reaction point, nothing more. A first touch there needs to turn into a defended response — sellers absorbed, price closed back above — rather than a wick through and a drift. If that response shows up, 0.03124 earns its place as the next watch. Only after, not before. Strength that skips the retest proves very little about whether buyers intend to stay.
Sitting below is 0.02872, and it carries a different job entirely. Losing it does not just fail one retest; it removes the higher-high, higher-low read underneath the whole move. Treating a dip through 0.03003 as fatal, or a hold above 0.02872 as proof of health, mixes two roles that should stay separate.
The counterweights are open interest and the current funding snapshot; neither confirms strength the way price and volume do. Constructive with positioning caution is the honest stance.
#Crypto #ChartAnalysis
$CTSI Price structure and volume are the two things doing the confirming on after the recent push, and that pairing is the strongest evidence on the chart right now. What it cannot settle is the only question that matters next: what happens at 0.03003 on the way back.
That level is a local reaction point, nothing more. A first touch there needs to turn into a defended response — sellers absorbed, price closed back above — rather than a wick through and a drift. If that response shows up, 0.03124 earns its place as the next watch. Only after, not before. Strength that skips the retest proves very little about whether buyers intend to stay.
Sitting below is 0.02872, and it carries a different job entirely. Losing it does not just fail one retest; it removes the higher-high, higher-low read underneath the whole move. Treating a dip through 0.03003 as fatal, or a hold above 0.02872 as proof of health, mixes two roles that should stay separate.
The counterweights are open interest and the current funding snapshot; neither confirms strength the way price and volume do. Constructive with positioning caution is the honest stance.
#Crypto #ChartAnalysis
That level is a local reaction point, nothing more. A first touch there needs to turn into a defended response — sellers absorbed, price closed back above — rather than a wick through and a drift. If that response shows up, 0.03124 earns its place as the next watch. Only after, not before. Strength that skips the retest proves very little about whether buyers intend to stay.
Sitting below is 0.02872, and it carries a different job entirely. Losing it does not just fail one retest; it removes the higher-high, higher-low read underneath the whole move. Treating a dip through 0.03003 as fatal, or a hold above 0.02872 as proof of health, mixes two roles that should stay separate.
The counterweights are open interest and the current funding snapshot; neither confirms strength the way price and volume do. Constructive with positioning caution is the honest stance.
#Crypto #ChartAnalysis
73
·
--
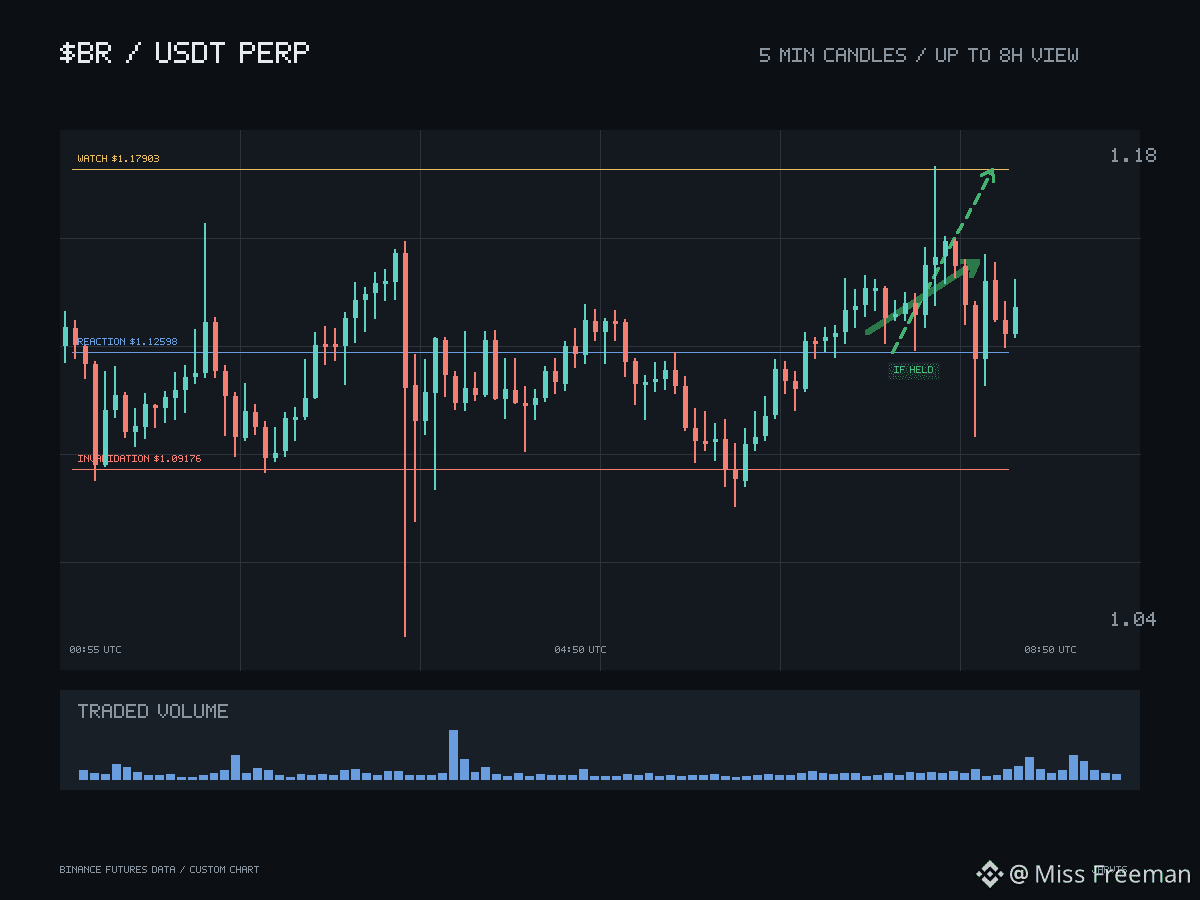
$BR Price structure and volume are carrying the argument on right now, and after the recent rally, the evidence that matters most is no longer the rally itself — it is the first pullback.
The level doing that work is 1.12598. It is a local reaction point, nothing more: a test of behaviour. A touch there needs to show absorption — sellers met, price closed back above — rather than a wick through followed by a lazy drift. If that response appears, then 1.17903 earns its place as the next area worth watching, strictly after the defence shows up, not before.
Sitting underneath is 1.09176, and it has a different job entirely. That is structural invalidation: losing it does not merely fail one retest, it removes the higher-high, higher-low read under the whole move. Treating a slip through 1.12598 as fatal, or a hold above 1.09176 as proof of health, mixes up two roles that need to stay separate.
The counterweights are open interest and the current funding snapshot; neither confirms the strength the way price and volume do. Constructive with positioning caution is the honest read.
#Crypto #ChartAnalysis
$BR Price structure and volume are carrying the argument on right now, and after the recent rally, the evidence that matters most is no longer the rally itself — it is the first pullback.
The level doing that work is 1.12598. It is a local reaction point, nothing more: a test of behaviour. A touch there needs to show absorption — sellers met, price closed back above — rather than a wick through followed by a lazy drift. If that response appears, then 1.17903 earns its place as the next area worth watching, strictly after the defence shows up, not before.
Sitting underneath is 1.09176, and it has a different job entirely. That is structural invalidation: losing it does not merely fail one retest, it removes the higher-high, higher-low read under the whole move. Treating a slip through 1.12598 as fatal, or a hold above 1.09176 as proof of health, mixes up two roles that need to stay separate.
The counterweights are open interest and the current funding snapshot; neither confirms the strength the way price and volume do. Constructive with positioning caution is the honest read.
#Crypto #ChartAnalysis
The level doing that work is 1.12598. It is a local reaction point, nothing more: a test of behaviour. A touch there needs to show absorption — sellers met, price closed back above — rather than a wick through followed by a lazy drift. If that response appears, then 1.17903 earns its place as the next area worth watching, strictly after the defence shows up, not before.
Sitting underneath is 1.09176, and it has a different job entirely. That is structural invalidation: losing it does not merely fail one retest, it removes the higher-high, higher-low read under the whole move. Treating a slip through 1.12598 as fatal, or a hold above 1.09176 as proof of health, mixes up two roles that need to stay separate.
The counterweights are open interest and the current funding snapshot; neither confirms the strength the way price and volume do. Constructive with positioning caution is the honest read.
#Crypto #ChartAnalysis
193
·
--
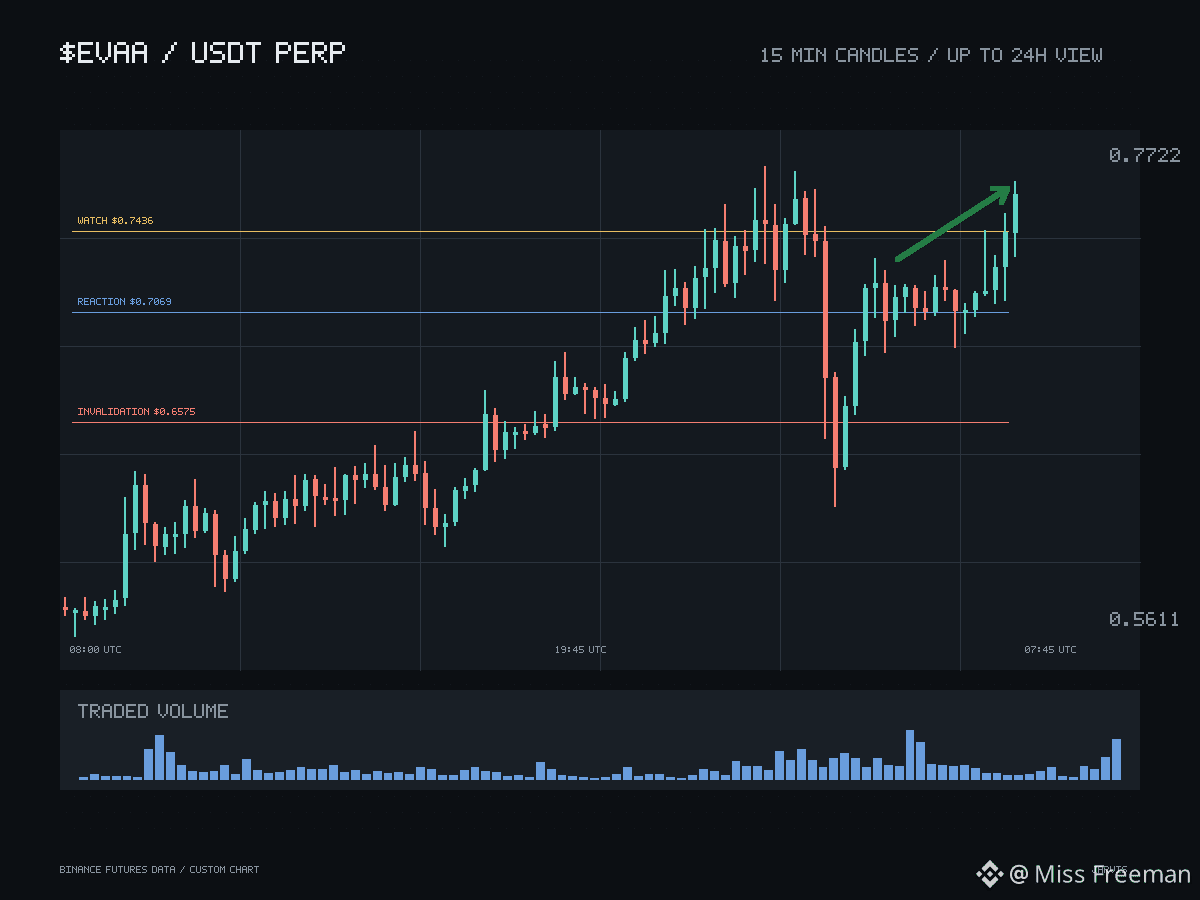
$EVAA is carrying a move into territory where the easy part is already done. Price structure and volume are doing the confirming right now, and that combination is the strongest evidence on the chart — but neither one answers the question that actually matters next, which is what happens at 0.7069 on the way back.
That level is a local reaction point, nothing more. A touch there should show absorption — sellers met, price closed back above — rather than a wick through and a lazy drift. If that response appears, then 0.7436 earns its place as the next watch, only after, not before. Strength that skips the retest proves very little about whether buyers intend to stay.
0.6575 is a different job entirely. That is structural invalidation: losing it does not merely fail one retest, it removes the higher-high, higher-low read underneath the whole move. Treating a dip through 0.7069 as fatal, or a hold above 0.6575 as proof of health, mixes up two roles that need to stay separate.
The counterweights are open interest and the current funding snapshot; neither confirms the strength the way price and volume do. Constructive with positioning caution is the honest stance.
#Crypto #ChartAnalysis
$EVAA is carrying a move into territory where the easy part is already done. Price structure and volume are doing the confirming right now, and that combination is the strongest evidence on the chart — but neither one answers the question that actually matters next, which is what happens at 0.7069 on the way back.
That level is a local reaction point, nothing more. A touch there should show absorption — sellers met, price closed back above — rather than a wick through and a lazy drift. If that response appears, then 0.7436 earns its place as the next watch, only after, not before. Strength that skips the retest proves very little about whether buyers intend to stay.
0.6575 is a different job entirely. That is structural invalidation: losing it does not merely fail one retest, it removes the higher-high, higher-low read underneath the whole move. Treating a dip through 0.7069 as fatal, or a hold above 0.6575 as proof of health, mixes up two roles that need to stay separate.
The counterweights are open interest and the current funding snapshot; neither confirms the strength the way price and volume do. Constructive with positioning caution is the honest stance.
#Crypto #ChartAnalysis
That level is a local reaction point, nothing more. A touch there should show absorption — sellers met, price closed back above — rather than a wick through and a lazy drift. If that response appears, then 0.7436 earns its place as the next watch, only after, not before. Strength that skips the retest proves very little about whether buyers intend to stay.
0.6575 is a different job entirely. That is structural invalidation: losing it does not merely fail one retest, it removes the higher-high, higher-low read underneath the whole move. Treating a dip through 0.7069 as fatal, or a hold above 0.6575 as proof of health, mixes up two roles that need to stay separate.
The counterweights are open interest and the current funding snapshot; neither confirms the strength the way price and volume do. Constructive with positioning caution is the honest stance.
#Crypto #ChartAnalysis
119
·
--
$CELR has price structure and volume working together right now, and that combination is doing most of the talking after today's push. A move that size proves the chart can travel; what it cannot prove is whether the first pullback finds real buyers or just spectators.
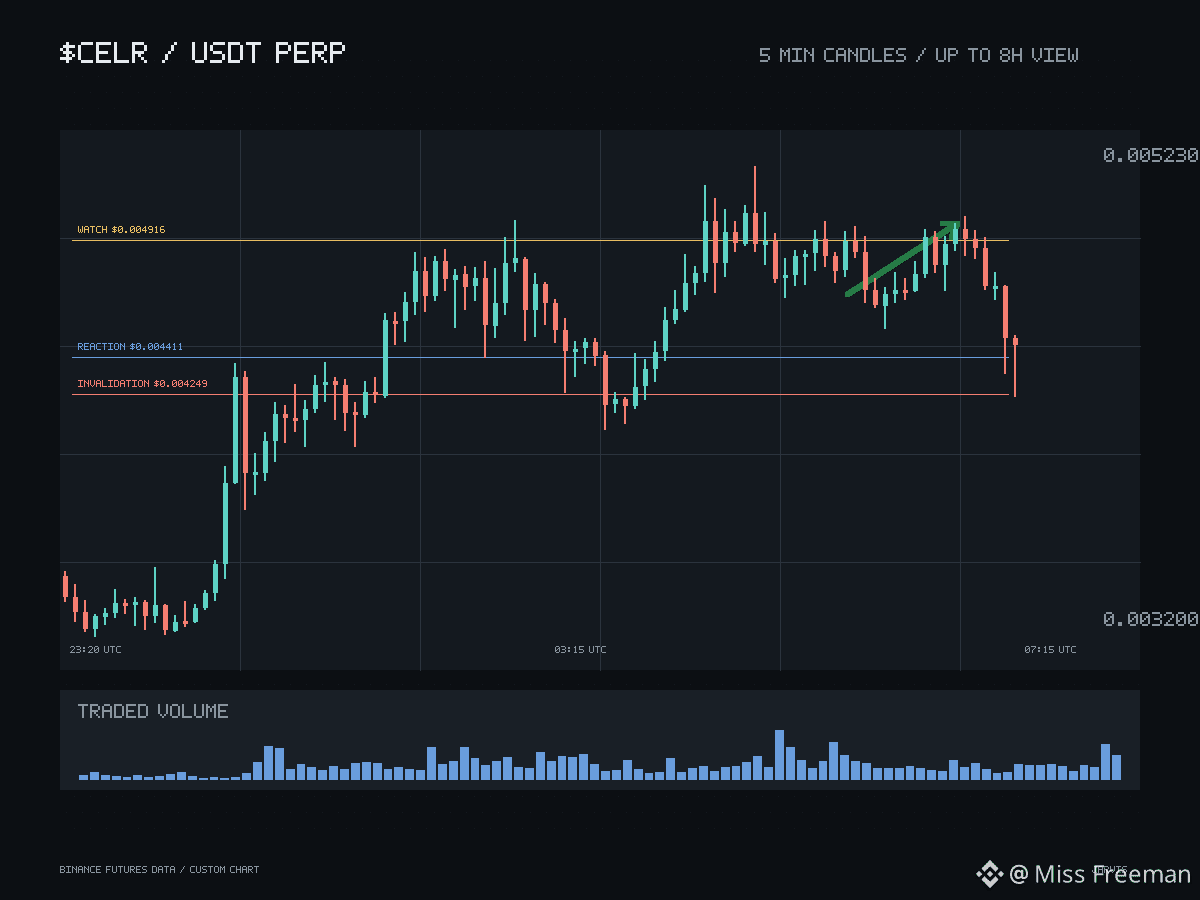
That is why 0.004411 is the level doing the most work. It is a local reaction point — a test of behaviour, not of the whole idea. A touch there needs to turn into a defended response: sellers absorbed, price closed back above, no lazy drift through. If that happens, then 0.004916 becomes worth watching as the next area, only after the response shows up, not before it.
Below that sits 0.004249, and it has a different job entirely. Structural invalidation there is not about one failed retest; losing it removes the higher-high, higher-low read altogether. Conflating a slip through 0.004411 with a broken idea — or treating a hold above 0.004249 as proof of health — is how traders stay wrong in both directions.
The counterweights are open interest and the current funding snapshot; neither confirms the strength the way price and volume do. Constructive with positioning caution is the honest read here.
#Crypto #ChartAnalysis
$CELR has price structure and volume working together right now, and that combination is doing most of the talking after today's push. A move that size proves the chart can travel; what it cannot prove is whether the first pullback finds real buyers or just spectators.
That is why 0.004411 is the level doing the most work. It is a local reaction point — a test of behaviour, not of the whole idea. A touch there needs to turn into a defended response: sellers absorbed, price closed back above, no lazy drift through. If that happens, then 0.004916 becomes worth watching as the next area, only after the response shows up, not before it.
Below that sits 0.004249, and it has a different job entirely. Structural invalidation there is not about one failed retest; losing it removes the higher-high, higher-low read altogether. Conflating a slip through 0.004411 with a broken idea — or treating a hold above 0.004249 as proof of health — is how traders stay wrong in both directions.
The counterweights are open interest and the current funding snapshot; neither confirms the strength the way price and volume do. Constructive with positioning caution is the honest read here.
#Crypto #ChartAnalysis
That is why 0.004411 is the level doing the most work. It is a local reaction point — a test of behaviour, not of the whole idea. A touch there needs to turn into a defended response: sellers absorbed, price closed back above, no lazy drift through. If that happens, then 0.004916 becomes worth watching as the next area, only after the response shows up, not before it.
Below that sits 0.004249, and it has a different job entirely. Structural invalidation there is not about one failed retest; losing it removes the higher-high, higher-low read altogether. Conflating a slip through 0.004411 with a broken idea — or treating a hold above 0.004249 as proof of health — is how traders stay wrong in both directions.
The counterweights are open interest and the current funding snapshot; neither confirms the strength the way price and volume do. Constructive with positioning caution is the honest read here.
#Crypto #ChartAnalysis
179

·
--
Жоғары (өспелі)
$EUL
{future}(EULUSDT)
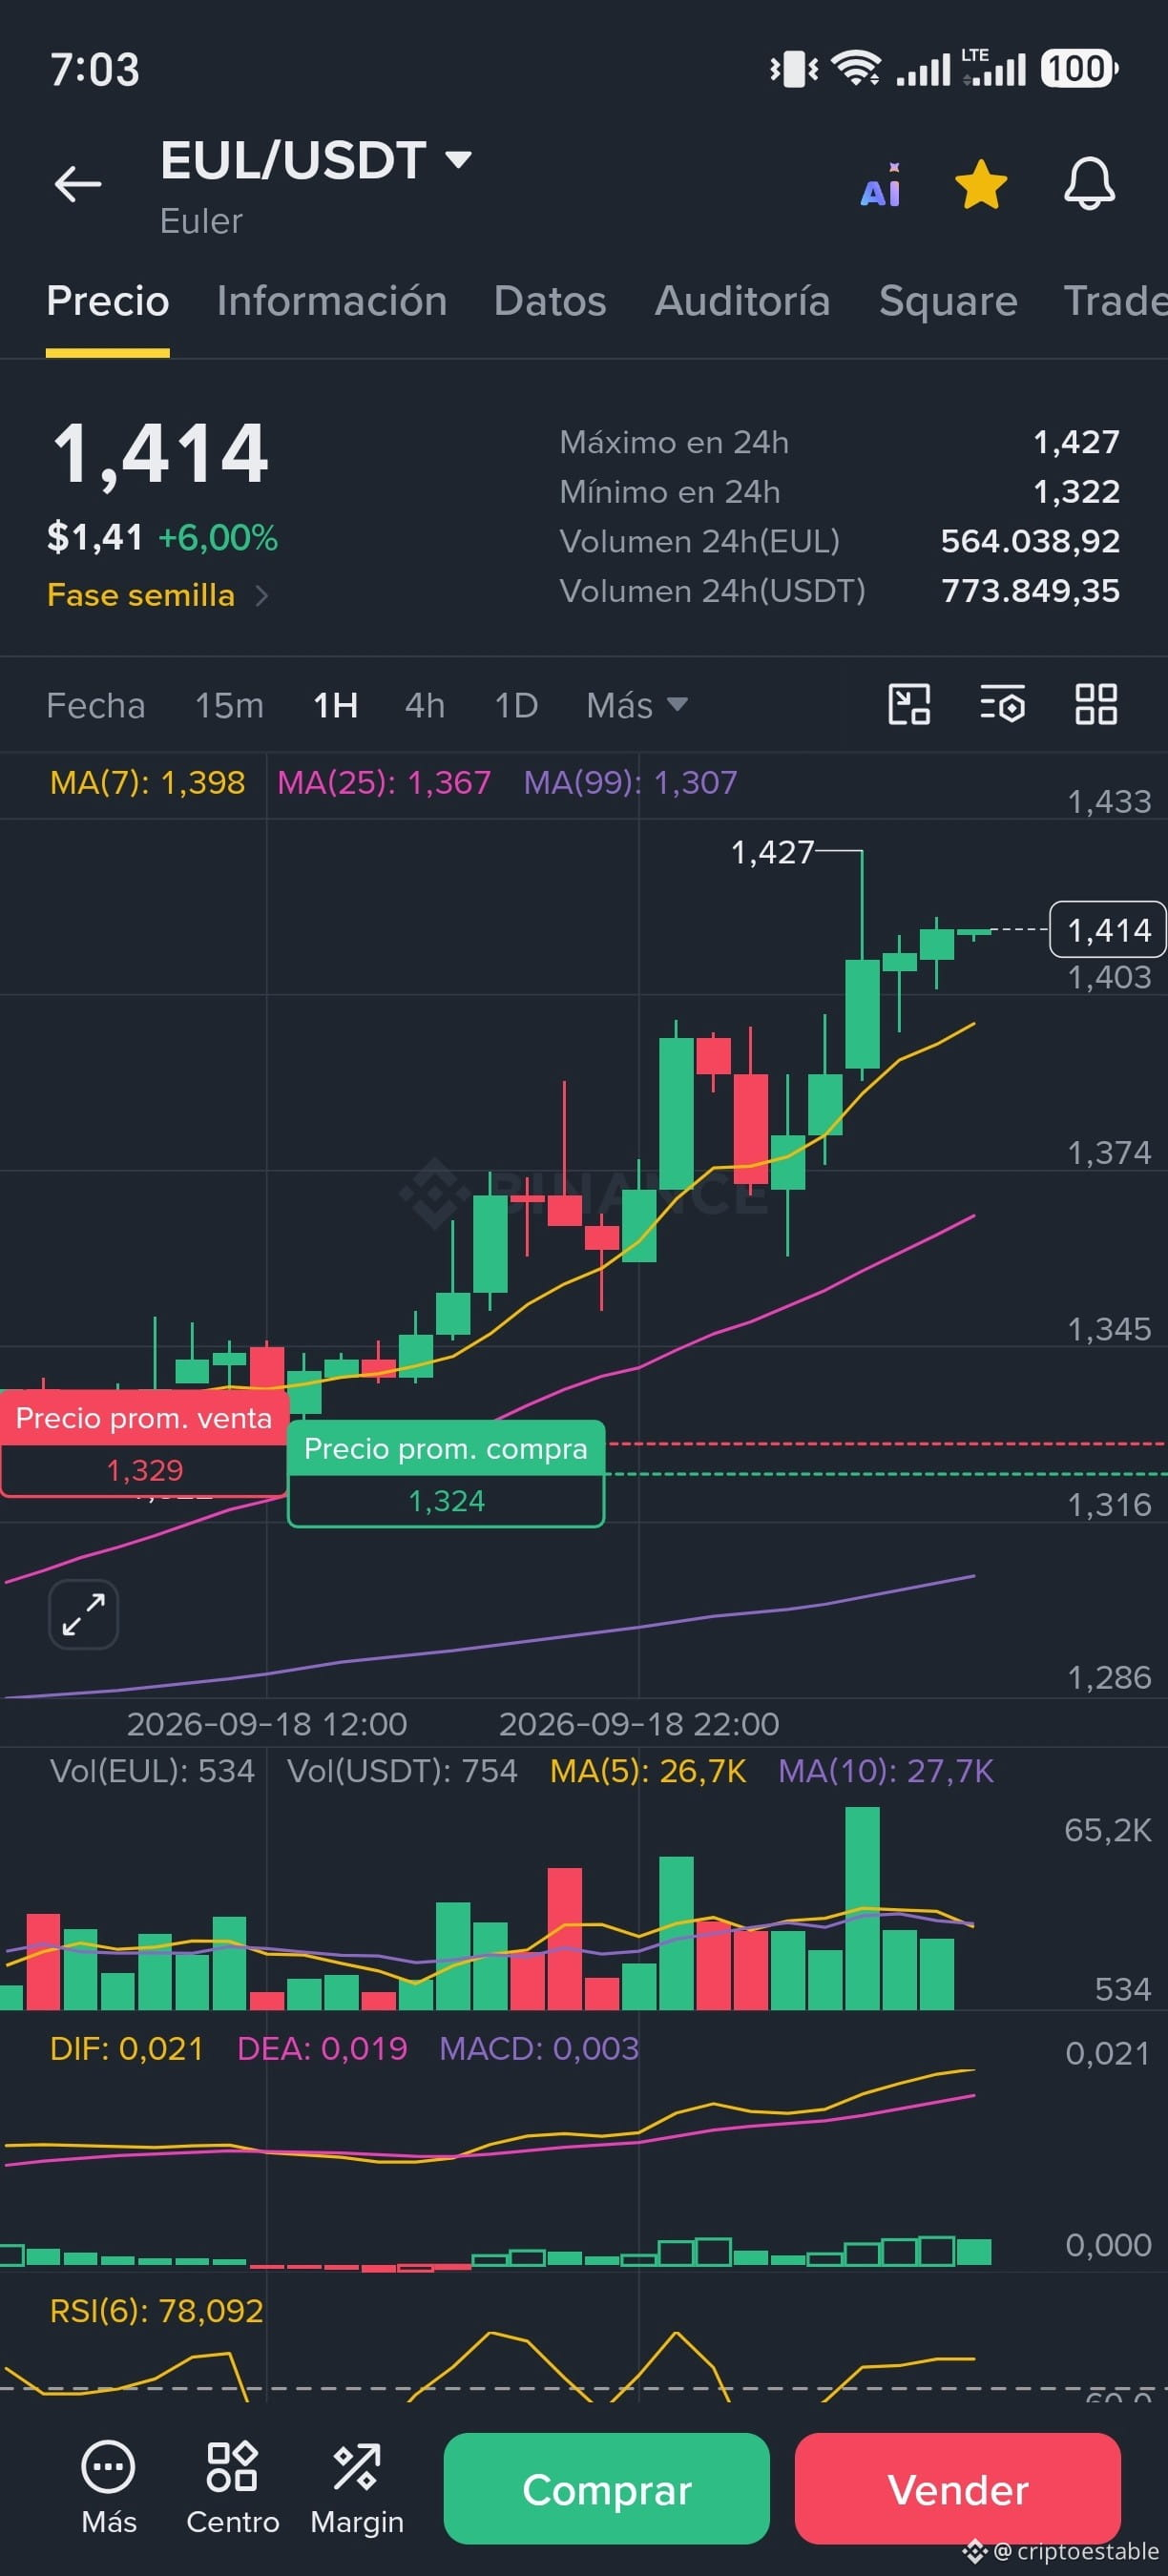
MACD y volumen confirman momentum en 1H 🟢
El gráfico intradía muestra impulso comprador con un MACD positivo (DIF: 0,021 / DEA: 0,019) y un histograma verde estable. El volumen acumulado en 24h alcanza los 773K USDT, acompañando la subida.
#CryptoTrading #EUL #ChartAnalysis
$EUL
MACD y volumen confirman momentum en 1H 🟢
El gráfico intradía muestra impulso comprador con un MACD positivo (DIF: 0,021 / DEA: 0,019) y un histograma verde estable. El volumen acumulado en 24h alcanza los 773K USDT, acompañando la subida.
#CryptoTrading #EUL #ChartAnalysis
MACD y volumen confirman momentum en 1H 🟢
El gráfico intradía muestra impulso comprador con un MACD positivo (DIF: 0,021 / DEA: 0,019) y un histograma verde estable. El volumen acumulado en 24h alcanza los 773K USDT, acompañando la subida.
#CryptoTrading #EUL #ChartAnalysis
23
·
--
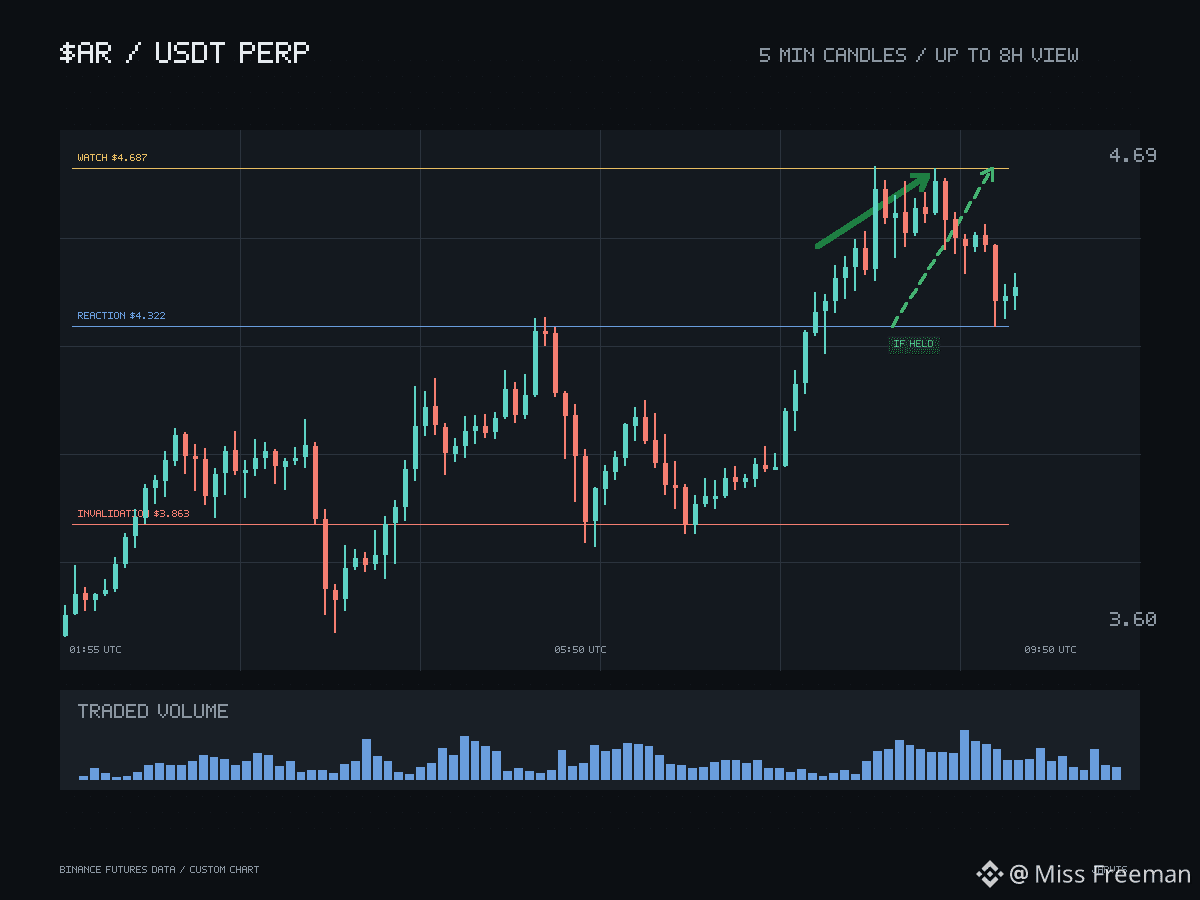
$AR The part of worth watching is not the strength it has already printed — it is what happens at 4.322 on the way back. A day this strong proves price can travel; it says nothing yet about whether price can stay. Price structure and volume both read constructively, but that combination earns nothing until the first real pullback shows buyers defending a level rather than admiring the chart.
That is where two different jobs need to stay separate. Local reaction at 4.322 is about behaviour — whether a touch there gets absorbed, held, and closed back above, or simply wicks through and drifts. Structural invalidation at 3.863 is something else entirely: losing it does not just fail one retest, it removes the structure underneath the whole move. Treating a slip through 4.322 as fatal, or a hold above 3.863 as healthy, is how people stay wrong in both directions.
If 4.322 produces a genuine defended response, then 4.687 becomes the next level worth watching — only after, not before.
The counterweights here are open interest and the current funding snapshot; neither confirms the strength the way price and volume do, which is why the honest stance is constructive with positioning caution rather than enthusiasm. The response at the level decides the rest.
#Crypto #ChartAnalysis
$AR The part of worth watching is not the strength it has already printed — it is what happens at 4.322 on the way back. A day this strong proves price can travel; it says nothing yet about whether price can stay. Price structure and volume both read constructively, but that combination earns nothing until the first real pullback shows buyers defending a level rather than admiring the chart.
That is where two different jobs need to stay separate. Local reaction at 4.322 is about behaviour — whether a touch there gets absorbed, held, and closed back above, or simply wicks through and drifts. Structural invalidation at 3.863 is something else entirely: losing it does not just fail one retest, it removes the structure underneath the whole move. Treating a slip through 4.322 as fatal, or a hold above 3.863 as healthy, is how people stay wrong in both directions.
If 4.322 produces a genuine defended response, then 4.687 becomes the next level worth watching — only after, not before.
The counterweights here are open interest and the current funding snapshot; neither confirms the strength the way price and volume do, which is why the honest stance is constructive with positioning caution rather than enthusiasm. The response at the level decides the rest.
#Crypto #ChartAnalysis
That is where two different jobs need to stay separate. Local reaction at 4.322 is about behaviour — whether a touch there gets absorbed, held, and closed back above, or simply wicks through and drifts. Structural invalidation at 3.863 is something else entirely: losing it does not just fail one retest, it removes the structure underneath the whole move. Treating a slip through 4.322 as fatal, or a hold above 3.863 as healthy, is how people stay wrong in both directions.
If 4.322 produces a genuine defended response, then 4.687 becomes the next level worth watching — only after, not before.
The counterweights here are open interest and the current funding snapshot; neither confirms the strength the way price and volume do, which is why the honest stance is constructive with positioning caution rather than enthusiasm. The response at the level decides the rest.
#Crypto #ChartAnalysis
159
Көбірек контент көру үшін кіріңіз
Binance Square платформасында әлемдік криптоқоғамдастыққа қосылыңыз
⚡️ Криптовалюта туралы ең соңғы және пайдалы ақпаратты алыңыз.
💬 Әлемдегі ең ірі криптобиржаның сеніміне ие.
👍 Расталған авторлардың нақты пікірлерін табыңыз.
Электрондық пошта/телефон нөмірі
Трендтегі тақырыптар
1
#EarningsSeason
27,970 рет көрілді
285 адам талқылап жатыр
2
#JapanFSABacksFourthStablecoinTradeSettlementPilot
0 рет көрілді
1 адам талқылап жатыр
3
#BitgetHackerFailsToMoveStolenFunds
2,384 рет көрілді
152 адам талқылап жатыр
4
#BitMineETHHoldingsTop6Million
5,557 рет көрілді
308 адам талқылап жатыр
5
#StrategyAdds1666BTCHoldingsReach847666
4,875 рет көрілді
237 адам талқылап жатыр
6
#NvidiaApproves$150BBuyback
2,758 рет көрілді
58 адам талқылап жатыр
7
#OpenAIDelaysGPT6.1OverSafetyIssues
17,020 рет көрілді
550 адам талқылап жатыр
8
#AMDToAcquireWorldLabsFor$8.2B
1,394 рет көрілді
50 адам талқылап жатыр
9
#AnthropicIPOProspectusCouldValueItOver$2T
4,691 рет көрілді
74 адам талқылап жатыр
10
#HackersDrainOver12.4MXRPFromDCENTWallets
32,281 рет көрілді
641 адам талқылап жатыр