
#biralcrypto
biralcrypto
19 рет көрілді
2 адам талқылап жатыр
Қызу саудада
Ең соңғы

Executive Summary
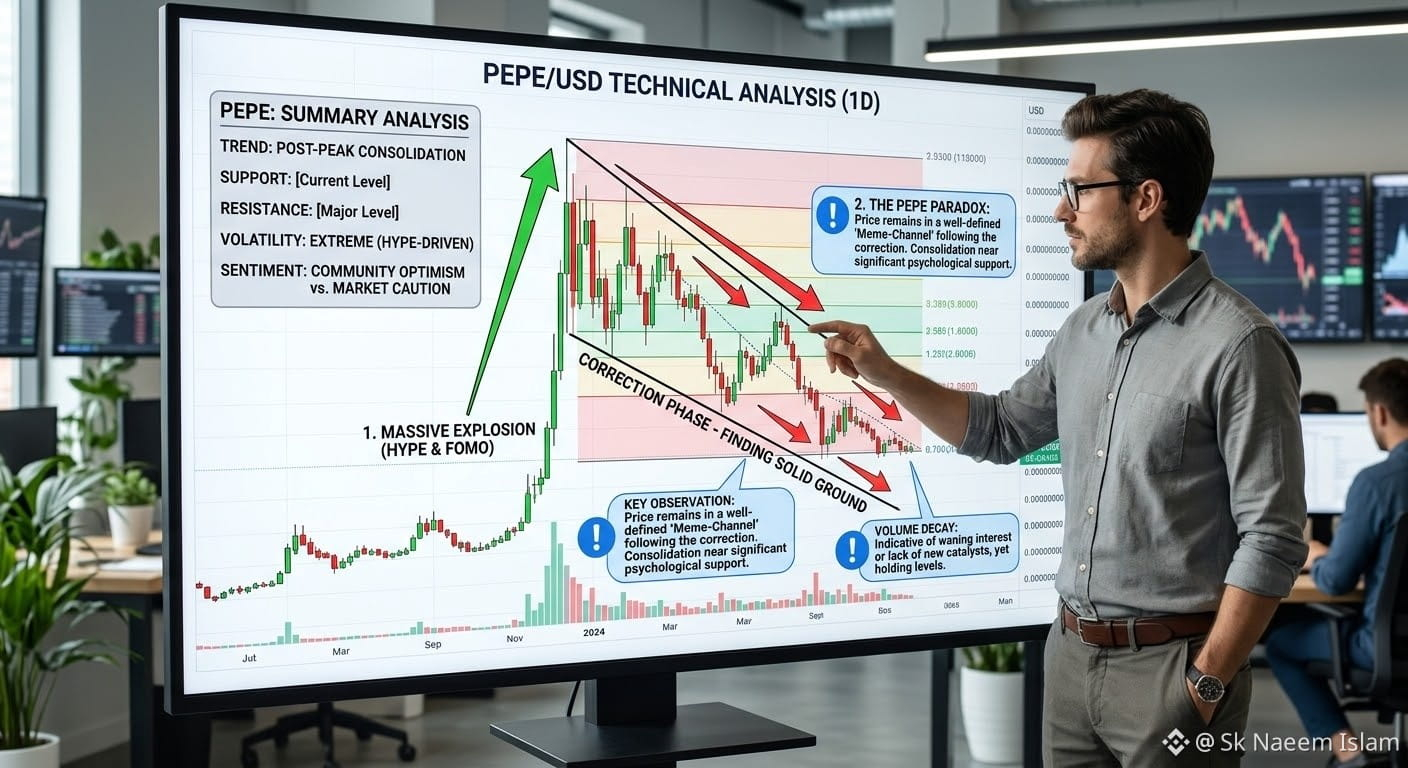
$PEPE remains one of the premier meme tokens in the cryptocurrency market. While fundamentally driven by social sentiment and speculative market momentum, its technical structure on daily and weekly timeframes presents clear support and resistance levels for traders.
Key Technical Indicators & Structure
Current Price Zone: PEPE is currently consolidating around $0.0000050.
Moving Averages (EMA): The price is holding near the 50-day and 200-day Exponential Moving Averages (EMAs). Trading above these key moving averages indicates a stable medium-term baseline, where pullbacks often attract buying interest.
Support & Resistance:
Immediate Support: $0.0000046 – $0.0000047. A breakdown below this level opens up lower liquidity zones near $0.0000038.
Main Resistance: $0.0000053 – $0.0000056. Clearing this zone is required for bulls to retest higher resistance targets.
.
Relative Strength Index (RSI): Floating around 55–58 (Neutral zone), indicating market equilibrium with room for momentum in either direction without being overbought or oversold.
Candlestick Pattern Insights
Rejection Shadows (Wicks): Recent lower shadow wicks around the $0.0000046 support zone demonstrate aggressive dip-buying, preventing deeper retracements.
Market Structure: As seen on multi-month technical charts, major market movements in PEPE are defined by rapid expansion phases (large bullish green candles) followed by prolonged consolidation channels.
#BTCRebounds80K #PEEPEE #BiralCrypto #SuadiArabia #ADPUSPrivateEmployersAdd86000JobsInOctober
{spot}(PEPEUSDT)
Executive Summary
$PEPE remains one of the premier meme tokens in the cryptocurrency market. While fundamentally driven by social sentiment and speculative market momentum, its technical structure on daily and weekly timeframes presents clear support and resistance levels for traders.
Key Technical Indicators & Structure
Current Price Zone: PEPE is currently consolidating around $0.0000050.
Moving Averages (EMA): The price is holding near the 50-day and 200-day Exponential Moving Averages (EMAs). Trading above these key moving averages indicates a stable medium-term baseline, where pullbacks often attract buying interest.
Support & Resistance:
Immediate Support: $0.0000046 – $0.0000047. A breakdown below this level opens up lower liquidity zones near $0.0000038.
Main Resistance: $0.0000053 – $0.0000056. Clearing this zone is required for bulls to retest higher resistance targets.
.
Relative Strength Index (RSI): Floating around 55–58 (Neutral zone), indicating market equilibrium with room for momentum in either direction without being overbought or oversold.
Candlestick Pattern Insights
Rejection Shadows (Wicks): Recent lower shadow wicks around the $0.0000046 support zone demonstrate aggressive dip-buying, preventing deeper retracements.
Market Structure: As seen on multi-month technical charts, major market movements in PEPE are defined by rapid expansion phases (large bullish green candles) followed by prolonged consolidation channels.
#BTCRebounds80K #PEEPEE #BiralCrypto #SuadiArabia #ADPUSPrivateEmployersAdd86000JobsInOctober
$PEPE remains one of the premier meme tokens in the cryptocurrency market. While fundamentally driven by social sentiment and speculative market momentum, its technical structure on daily and weekly timeframes presents clear support and resistance levels for traders.
Key Technical Indicators & Structure
Current Price Zone: PEPE is currently consolidating around $0.0000050.
Moving Averages (EMA): The price is holding near the 50-day and 200-day Exponential Moving Averages (EMAs). Trading above these key moving averages indicates a stable medium-term baseline, where pullbacks often attract buying interest.
Support & Resistance:
Immediate Support: $0.0000046 – $0.0000047. A breakdown below this level opens up lower liquidity zones near $0.0000038.
Main Resistance: $0.0000053 – $0.0000056. Clearing this zone is required for bulls to retest higher resistance targets.
.
Relative Strength Index (RSI): Floating around 55–58 (Neutral zone), indicating market equilibrium with room for momentum in either direction without being overbought or oversold.
Candlestick Pattern Insights
Rejection Shadows (Wicks): Recent lower shadow wicks around the $0.0000046 support zone demonstrate aggressive dip-buying, preventing deeper retracements.
Market Structure: As seen on multi-month technical charts, major market movements in PEPE are defined by rapid expansion phases (large bullish green candles) followed by prolonged consolidation channels.
#BTCRebounds80K #PEEPEE #BiralCrypto #SuadiArabia #ADPUSPrivateEmployersAdd86000JobsInOctober
73
Көбірек контент көру үшін кіріңіз
Binance Square платформасында әлемдік криптоқоғамдастыққа қосылыңыз
⚡️ Криптовалюта туралы ең соңғы және пайдалы ақпаратты алыңыз.
💬 Әлемдегі ең ірі криптобиржаның сеніміне ие.
👍 Расталған авторлардың нақты пікірлерін табыңыз.
Электрондық пошта/телефон нөмірі
Трендтегі тақырыптар
1
#BTCRebounds80K
38,098 рет көрілді
594 адам талқылап жатыр
2
#Binance98PercentReplenished
30,349 рет көрілді
499 адам талқылап жатыр
3
#USMidterms-WhatAreMarketsExpecting?
313,665 рет көрілді
2,000 адам талқылап жатыр
4
#USOctoberNFP-AreRateCutsStillPossible
382,341 рет көрілді
2,795 адам талқылап жатыр
5
#AMDBeatsExpectations-AINarrativeContinues
91,187 рет көрілді
764 адам талқылап жатыр
6
#CircleQ3Revenue865M
24,864 рет көрілді
426 адам талқылап жатыр
7
#BinanceIncidentReport
524,820 рет көрілді
2,112 адам талқылап жатыр
8
#USStocksOpenHigherAsDowGains1.9%
4,659 рет көрілді
70 адам талқылап жатыр
9
#ADPUSPrivateEmployersAdd86000JobsInOctober
3,346 рет көрілді
47 адам талқылап жатыр
10
#FrenchAssemblyPassesSelfCustodiedCryptoReportingAmendment
904 рет көрілді
23 адам талқылап жатыр