

#anlysetrendingchart
anlysetrendingchart
5 рет көрілді
2 адам талқылап жатыр
Қызу саудада
Ең соңғы

·
--
Жоғары (өспелі)
#BinanceExplorers
📊 Mastering Binance Trading: Bullish vs. Bearish Trend Analysis (1D & 3H) 🚀📉
Understanding the connection between macro market structure and micro price action is essential for consistent trading success. This guide breaks down the key differences between Bullish and Bearish market environments using 1-Day (1D) and 3-Hour (3H) timeframes:
🟢 1. Bullish Trend (Uptrend)
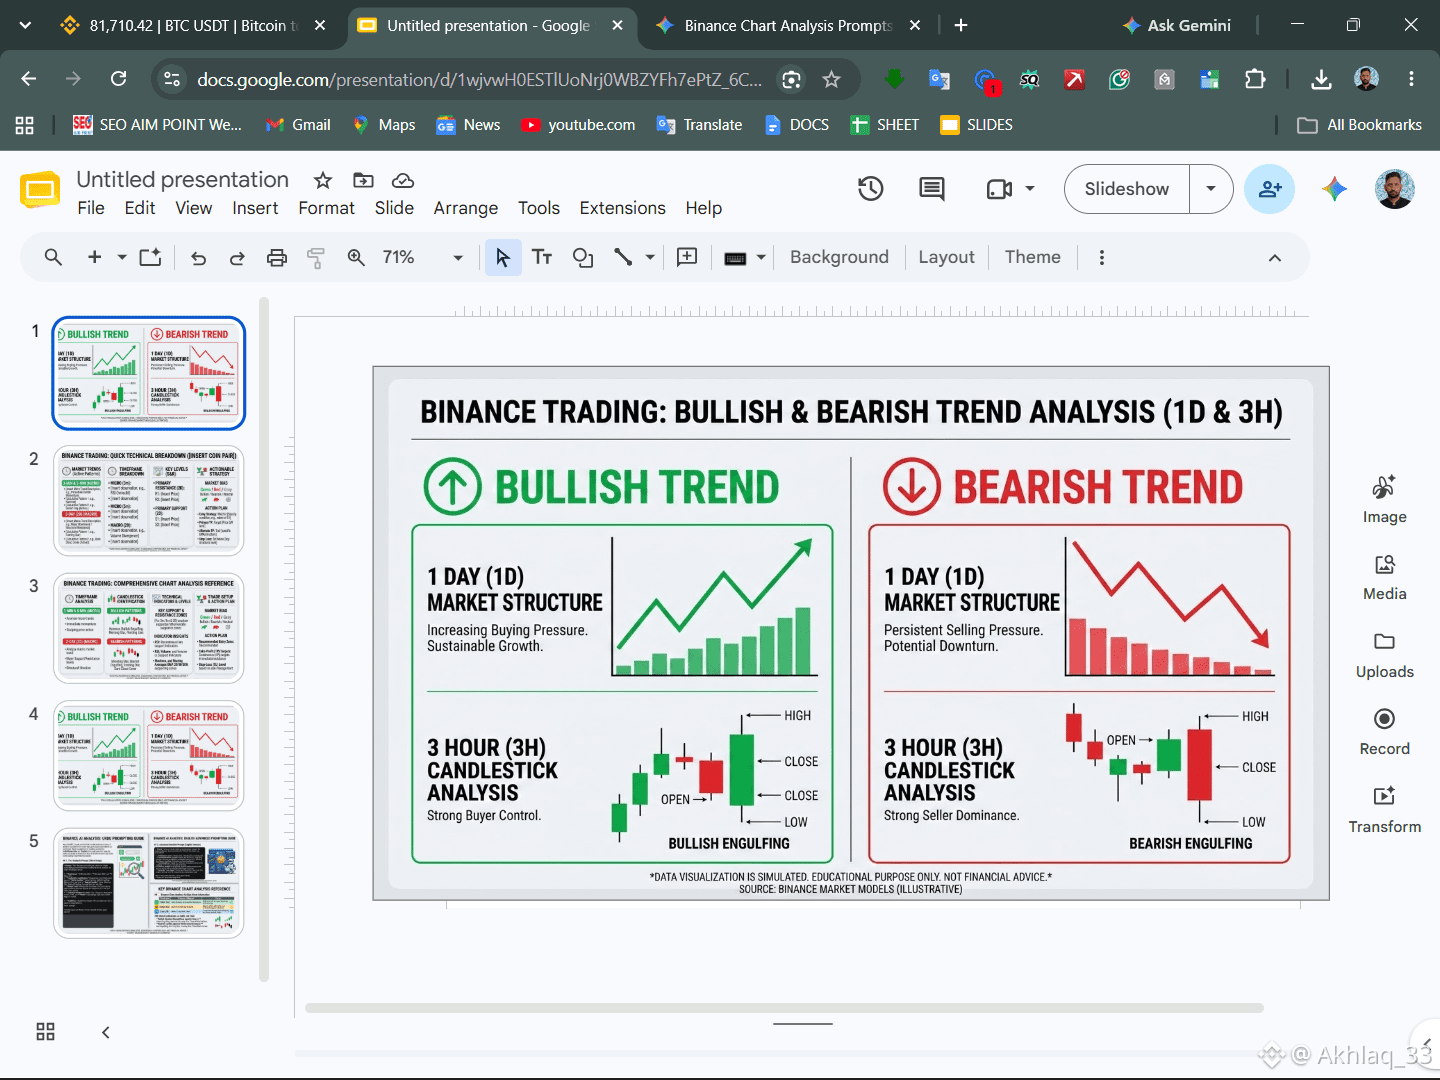
1D Market Structure: Characterized by increasing buying pressure and sustainable upward growth. Higher highs and higher lows indicate strong buyer control on the macro scale.
3H Candlestick Analysis: Features powerful reversal patterns like the Bullish Engulfing Candle, signaling aggressive buyer takeover and ideal entry opportunities.
🔴 2. Bearish Trend (Downtrend)
1D Market Structure: Characterized by persistent selling pressure and continuous downside price action. Lower highs and lower lows confirm a structural downturn.
3H Candlestick Analysis: Highlights strong seller dominance with patterns like the Bearish Engulfing Candle, signaling potential distribution or short setups.
💡 Key Takeaway for Traders: Always align your trades with higher timeframe momentum! Use the 1D chart to establish your overall directional bias and the 3H chart for precise entry execution using key candlestick confirmations.
#anlysetrendingchart #CelestiaRises16%To2026High #StrategySharesFall9%OnFriday $BTC
{spot}(BTCUSDT)
#BinanceExplorers
📊 Mastering Binance Trading: Bullish vs. Bearish Trend Analysis (1D & 3H) 🚀📉
Understanding the connection between macro market structure and micro price action is essential for consistent trading success. This guide breaks down the key differences between Bullish and Bearish market environments using 1-Day (1D) and 3-Hour (3H) timeframes:
🟢 1. Bullish Trend (Uptrend)
1D Market Structure: Characterized by increasing buying pressure and sustainable upward growth. Higher highs and higher lows indicate strong buyer control on the macro scale.
3H Candlestick Analysis: Features powerful reversal patterns like the Bullish Engulfing Candle, signaling aggressive buyer takeover and ideal entry opportunities.
🔴 2. Bearish Trend (Downtrend)
1D Market Structure: Characterized by persistent selling pressure and continuous downside price action. Lower highs and lower lows confirm a structural downturn.
3H Candlestick Analysis: Highlights strong seller dominance with patterns like the Bearish Engulfing Candle, signaling potential distribution or short setups.
💡 Key Takeaway for Traders: Always align your trades with higher timeframe momentum! Use the 1D chart to establish your overall directional bias and the 3H chart for precise entry execution using key candlestick confirmations.
#anlysetrendingchart #CelestiaRises16%To2026High #StrategySharesFall9%OnFriday $BTC
40
Көбірек контент көру үшін кіріңіз
Binance Square платформасында әлемдік криптоқоғамдастыққа қосылыңыз
⚡️ Криптовалюта туралы ең соңғы және пайдалы ақпаратты алыңыз.
💬 Әлемдегі ең ірі криптобиржаның сеніміне ие.
👍 Расталған авторлардың нақты пікірлерін табыңыз.
Электрондық пошта/телефон нөмірі
Трендтегі тақырыптар
1
#BinancePick
2.7M рет көрілді
145,157 адам талқылап жатыр
2
#EarningsSeason
5.1M рет көрілді
24,859 адам талқылап жатыр
3
#AnthropicS1ExpectedToday
0 рет көрілді
10 адам талқылап жатыр
4
#SouthKoreaReportedlyWeighsFourthCryptoTaxDelay
6,027 рет көрілді
190 адам талқылап жатыр
5
#FranklinTempletonFilesForTwoDividendToBitcoinETFs
11,961 рет көрілді
304 адам талқылап жатыр
6
#StrategyMSTRSurpassesNasdaqInMarketCap
10,460 рет көрілді
252 адам талқылап жатыр
7
#CanadaProposesStablecoinRedemptionWithin3BusinessDays
420 рет көрілді
27 адам талқылап жатыр
8
#ElectrumWalletBugLetRogueServersStealFunds
15,458 рет көрілді
370 адам талқылап жатыр
9
#ArgentineCourtDismissesLIBRACaseAgainstMilei
25,535 рет көрілді
436 адам талқылап жатыр
10
#SKHynixReportedlyPlansSpecialDividendFromKioxiaStakeSale
3,843 рет көрілді
52 адам талқылап жатыр