
#altcoinupdate
altcoinupdate
1.6M рет көрілді
3,880 адам талқылап жатыр
Қызу саудада
Ең соңғы

Gitcoin (GTC) Gains 6.5% to $0.14179 as Price Pulls Back Below the 7-Period Moving Average
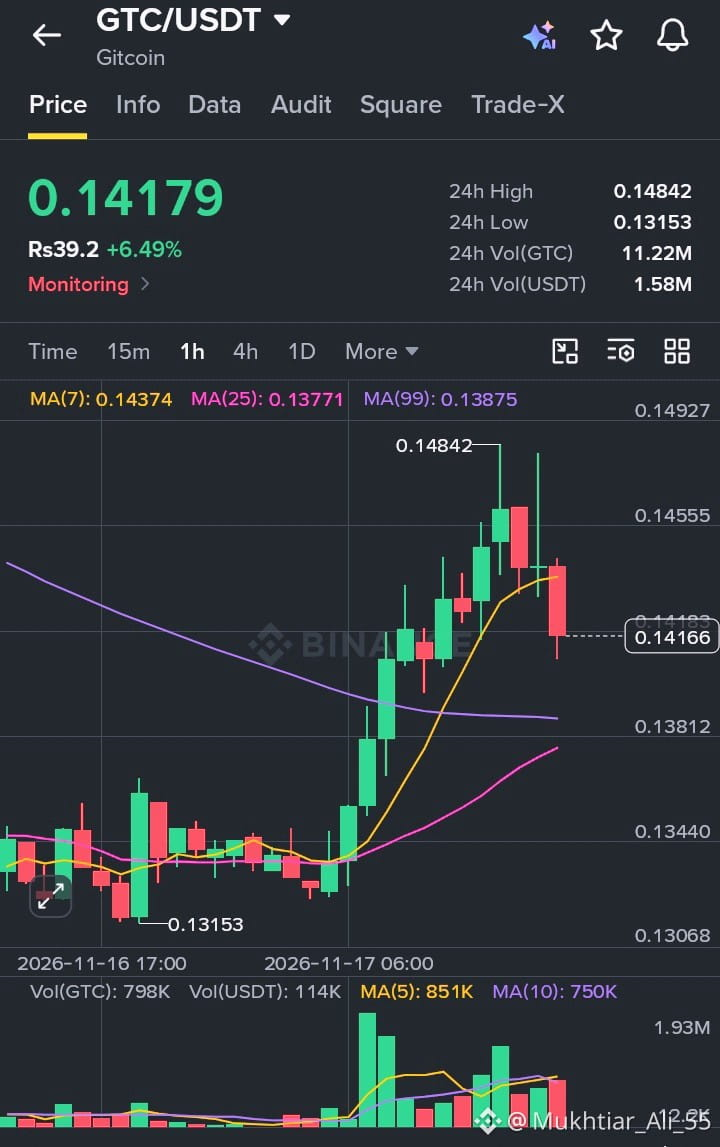
Gitcoin is cooling off after a strong rally. GTC/USDT is trading at 0.14179 USDT, up 6.49% on the day, after bouncing from a 24h low of 0.13153 and reaching a high of 0.14842.
The 1-hour chart shows a sharp climb through the morning of November 17, with a run of strong green candles lifting price from the 0.134 area to just under 0.1484. Since touching that high, price has formed lower highs, and the latest candle is a solid red one that has pushed price below the 7-period moving average (0.14374). The 25-period (0.13771) and 99-period (0.13875) are both sitting well below price, with the 25-period now curling above the flattening 99-period, which keeps the broader structure constructive.
The upper wicks near 0.1484 show sellers stepping in at the top, and the latest red candle suggests short-term momentum has shifted to the downside. This looks more like profit-taking after a fast move than a trend reversal, as long as price holds above the longer-term averages.
Volume is moderate, with around 11.22M GTC, or roughly 1.58M USDT, traded in the last 24 hours. The heaviest volume came during the initial breakout, while the recent pullback has come on steady but unspectacular volume.
What I’m watching next:
Resistance: the 0.14374 area near the MA(7), followed by the 0.14842 high. Price needs to reclaim the MA(7) to restore bullish momentum.
Support: the 0.13875 zone at the MA(99), followed by the 0.13771 level at the MA(25). A close below both would put the 0.134 area, where the rally began, back in play.
For now, I’d treat this as a pullback within a short-term uptrend. A bounce from the 0.139 area would keep the structure intact, while a break below the 99 MA could signal a deeper retracement.
#Gitcoin #GTC #CryptoTrading #TechnicalAnalysis #AltcoinUpdate
$GTC
{spot}(GTCUSDT)
Gitcoin (GTC) Gains 6.5% to $0.14179 as Price Pulls Back Below the 7-Period Moving Average
Gitcoin is cooling off after a strong rally. GTC/USDT is trading at 0.14179 USDT, up 6.49% on the day, after bouncing from a 24h low of 0.13153 and reaching a high of 0.14842.
The 1-hour chart shows a sharp climb through the morning of November 17, with a run of strong green candles lifting price from the 0.134 area to just under 0.1484. Since touching that high, price has formed lower highs, and the latest candle is a solid red one that has pushed price below the 7-period moving average (0.14374). The 25-period (0.13771) and 99-period (0.13875) are both sitting well below price, with the 25-period now curling above the flattening 99-period, which keeps the broader structure constructive.
The upper wicks near 0.1484 show sellers stepping in at the top, and the latest red candle suggests short-term momentum has shifted to the downside. This looks more like profit-taking after a fast move than a trend reversal, as long as price holds above the longer-term averages.
Volume is moderate, with around 11.22M GTC, or roughly 1.58M USDT, traded in the last 24 hours. The heaviest volume came during the initial breakout, while the recent pullback has come on steady but unspectacular volume.
What I’m watching next:
Resistance: the 0.14374 area near the MA(7), followed by the 0.14842 high. Price needs to reclaim the MA(7) to restore bullish momentum.
Support: the 0.13875 zone at the MA(99), followed by the 0.13771 level at the MA(25). A close below both would put the 0.134 area, where the rally began, back in play.
For now, I’d treat this as a pullback within a short-term uptrend. A bounce from the 0.139 area would keep the structure intact, while a break below the 99 MA could signal a deeper retracement.
#Gitcoin #GTC #CryptoTrading #TechnicalAnalysis #AltcoinUpdate
$GTC
Gitcoin is cooling off after a strong rally. GTC/USDT is trading at 0.14179 USDT, up 6.49% on the day, after bouncing from a 24h low of 0.13153 and reaching a high of 0.14842.
The 1-hour chart shows a sharp climb through the morning of November 17, with a run of strong green candles lifting price from the 0.134 area to just under 0.1484. Since touching that high, price has formed lower highs, and the latest candle is a solid red one that has pushed price below the 7-period moving average (0.14374). The 25-period (0.13771) and 99-period (0.13875) are both sitting well below price, with the 25-period now curling above the flattening 99-period, which keeps the broader structure constructive.
The upper wicks near 0.1484 show sellers stepping in at the top, and the latest red candle suggests short-term momentum has shifted to the downside. This looks more like profit-taking after a fast move than a trend reversal, as long as price holds above the longer-term averages.
Volume is moderate, with around 11.22M GTC, or roughly 1.58M USDT, traded in the last 24 hours. The heaviest volume came during the initial breakout, while the recent pullback has come on steady but unspectacular volume.
What I’m watching next:
Resistance: the 0.14374 area near the MA(7), followed by the 0.14842 high. Price needs to reclaim the MA(7) to restore bullish momentum.
Support: the 0.13875 zone at the MA(99), followed by the 0.13771 level at the MA(25). A close below both would put the 0.134 area, where the rally began, back in play.
For now, I’d treat this as a pullback within a short-term uptrend. A bounce from the 0.139 area would keep the structure intact, while a break below the 99 MA could signal a deeper retracement.
#Gitcoin #GTC #CryptoTrading #TechnicalAnalysis #AltcoinUpdate
$GTC
4
Momentum (MMT) Jumps 18.6% to $0.1201 as a Volatile Spike to 0.1426 Gets Largely Retraced
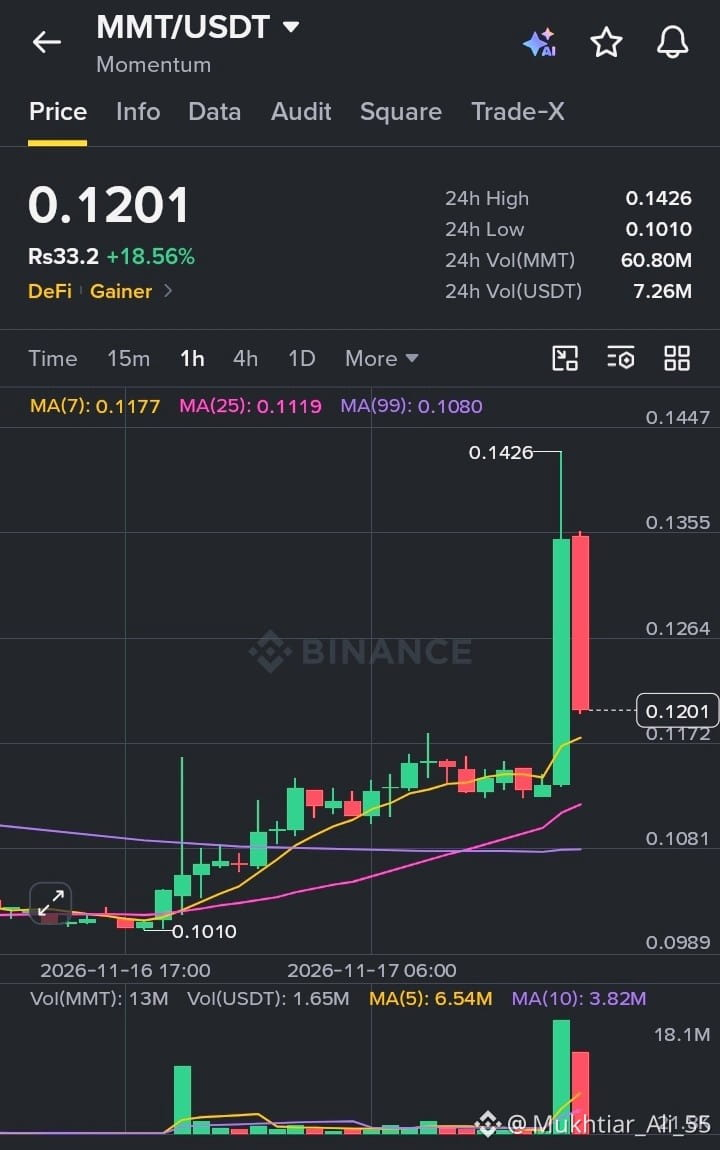
Momentum is one of the biggest gainers today, but the move has been anything but smooth. MMT/USDT is trading at 0.1201 USDT, up 18.56% on the day, after bouncing from a 24h low of 0.1010 and spiking to a high of 0.1426.
The 1-hour chart shows a slow, steady climb through the morning of November 17, with price building higher lows above the 99-period moving average (0.1080). Then came a sudden vertical candle that sent price up to 0.1426, followed immediately by a large red candle that gave back most of the move. Price is now at 0.1201, which is well off the high but still above the 7-period (0.1177), 25-period (0.1119) and 99-period averages, all of which are sloping upward or flattening beneath it.
That long upper wick and the heavy red candle that followed show aggressive selling into the spike. It looks like a classic blow-off move where early buyers took profits quickly, so caution makes sense here until price stabilizes.
Volume tells the story. Around 60.80M MMT, or roughly 7.26M USDT, has traded in the last 24 hours, with the two largest volume bars on the chart coming from the spike candle and the reversal candle. Volume was very low before that, so the move came out of nowhere and could just as quickly fade.
What I’m watching next:
Resistance: the 0.1264 to 0.1355 zone where the sharp reversal began, followed by the 0.1426 high. Reclaiming 0.1264 would be the first sign of buyers regaining control.
Support: the 0.1177 level near the MA(7), followed by the 0.1119 area at the MA(25). A close below those would put the 0.1080 level at the MA(99) back in play.
For now, I’d treat this as a high-volatility phase. Holding above 0.1177 keeps the breakout structure alive, while a slip below it could erase most of the day’s gain.
#Momentum #MMT #CryptoTrading #TechnicalAnalysis #AltcoinUpdate
$MMT
{spot}(MMTUSDT)
Momentum (MMT) Jumps 18.6% to $0.1201 as a Volatile Spike to 0.1426 Gets Largely Retraced
Momentum is one of the biggest gainers today, but the move has been anything but smooth. MMT/USDT is trading at 0.1201 USDT, up 18.56% on the day, after bouncing from a 24h low of 0.1010 and spiking to a high of 0.1426.
The 1-hour chart shows a slow, steady climb through the morning of November 17, with price building higher lows above the 99-period moving average (0.1080). Then came a sudden vertical candle that sent price up to 0.1426, followed immediately by a large red candle that gave back most of the move. Price is now at 0.1201, which is well off the high but still above the 7-period (0.1177), 25-period (0.1119) and 99-period averages, all of which are sloping upward or flattening beneath it.
That long upper wick and the heavy red candle that followed show aggressive selling into the spike. It looks like a classic blow-off move where early buyers took profits quickly, so caution makes sense here until price stabilizes.
Volume tells the story. Around 60.80M MMT, or roughly 7.26M USDT, has traded in the last 24 hours, with the two largest volume bars on the chart coming from the spike candle and the reversal candle. Volume was very low before that, so the move came out of nowhere and could just as quickly fade.
What I’m watching next:
Resistance: the 0.1264 to 0.1355 zone where the sharp reversal began, followed by the 0.1426 high. Reclaiming 0.1264 would be the first sign of buyers regaining control.
Support: the 0.1177 level near the MA(7), followed by the 0.1119 area at the MA(25). A close below those would put the 0.1080 level at the MA(99) back in play.
For now, I’d treat this as a high-volatility phase. Holding above 0.1177 keeps the breakout structure alive, while a slip below it could erase most of the day’s gain.
#Momentum #MMT #CryptoTrading #TechnicalAnalysis #AltcoinUpdate
$MMT
Momentum is one of the biggest gainers today, but the move has been anything but smooth. MMT/USDT is trading at 0.1201 USDT, up 18.56% on the day, after bouncing from a 24h low of 0.1010 and spiking to a high of 0.1426.
The 1-hour chart shows a slow, steady climb through the morning of November 17, with price building higher lows above the 99-period moving average (0.1080). Then came a sudden vertical candle that sent price up to 0.1426, followed immediately by a large red candle that gave back most of the move. Price is now at 0.1201, which is well off the high but still above the 7-period (0.1177), 25-period (0.1119) and 99-period averages, all of which are sloping upward or flattening beneath it.
That long upper wick and the heavy red candle that followed show aggressive selling into the spike. It looks like a classic blow-off move where early buyers took profits quickly, so caution makes sense here until price stabilizes.
Volume tells the story. Around 60.80M MMT, or roughly 7.26M USDT, has traded in the last 24 hours, with the two largest volume bars on the chart coming from the spike candle and the reversal candle. Volume was very low before that, so the move came out of nowhere and could just as quickly fade.
What I’m watching next:
Resistance: the 0.1264 to 0.1355 zone where the sharp reversal began, followed by the 0.1426 high. Reclaiming 0.1264 would be the first sign of buyers regaining control.
Support: the 0.1177 level near the MA(7), followed by the 0.1119 area at the MA(25). A close below those would put the 0.1080 level at the MA(99) back in play.
For now, I’d treat this as a high-volatility phase. Holding above 0.1177 keeps the breakout structure alive, while a slip below it could erase most of the day’s gain.
#Momentum #MMT #CryptoTrading #TechnicalAnalysis #AltcoinUpdate
$MMT
5
Bittensor (TAO) Gains 4% to $194.4 as Price Presses Toward the Falling 99-Period Moving Average
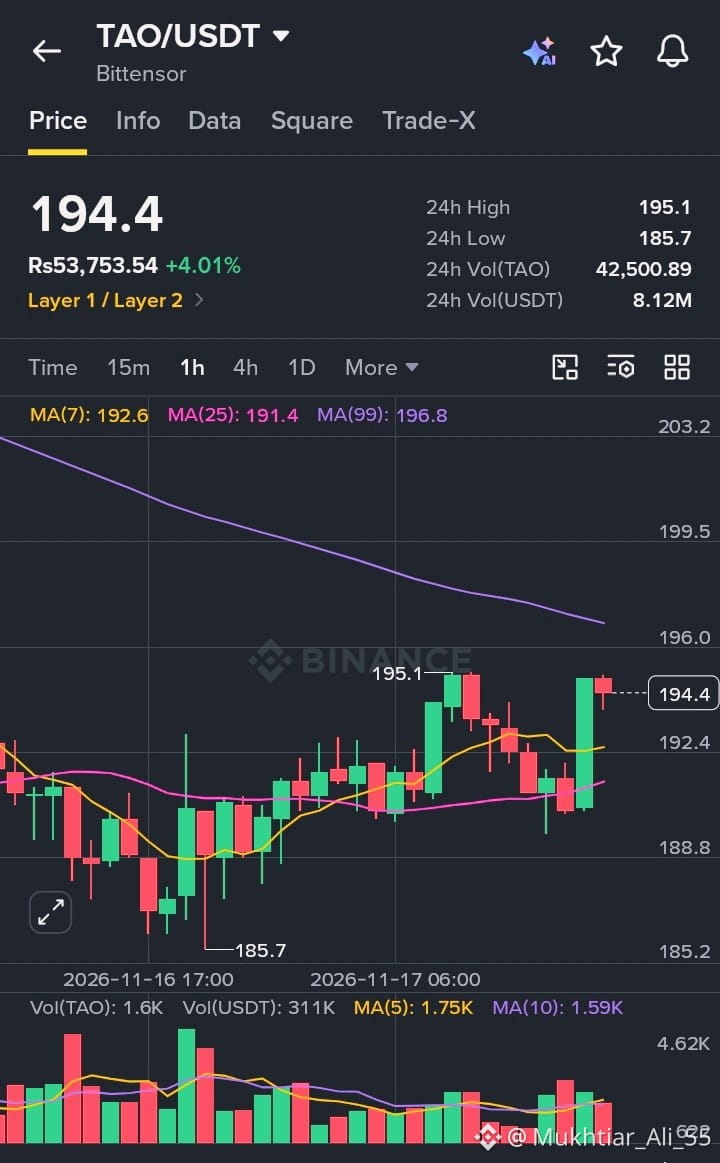
Bittensor is building a steady recovery. TAO/USDT is trading at 194.4 USDT, up 4.01% on the day, after bouncing from a 24h low of 185.7 and reaching a high of 195.1.
The 1-hour chart shows a gradual climb from the November 16 low, with price forming higher lows through the morning of the 17th. A strong green candle in the latest session lifted price back above the 7-period (192.6) and 25-period (191.4) moving averages, both of which are now flattening or turning up beneath it. The 99-period moving average (196.8) is still sloping steadily downward and sits above price, so it remains the main overhead hurdle.
Price is now sitting just under the 24h high of 195.1, and the latest candle shows a small red body, suggesting some hesitation at this level. Buyers have the short-term edge, but the broader structure is not confirmed until the 99 MA is reclaimed.
Volume is moderate, with around 42,500 TAO, or roughly 8.12M USDT, traded in the last 24 hours. Recent candles show participation holding steady rather than surging, so a breakout would look more convincing with a pickup in volume.
What I’m watching next:
Resistance: the 195.1 area, the 24h high, followed by the 196.8 level at the MA(99). A clean hourly close above both could open the way toward 199 to 200.
Support: the 192.6 zone near the MA(7), followed by the 191.4 level where the MA(25) sits. A close below 191 would weaken the short-term recovery.
For now, I’d treat this as a constructive but unconfirmed move. Holding above the short-term averages keeps the bulls in control, while a rejection from the 99 MA could send price back toward the 190 area.
#Bittensor #TAO #CryptoTrading #TechnicalAnalysis #AltcoinUpdate
$TAO
{spot}(TAOUSDT)
Bittensor (TAO) Gains 4% to $194.4 as Price Presses Toward the Falling 99-Period Moving Average
Bittensor is building a steady recovery. TAO/USDT is trading at 194.4 USDT, up 4.01% on the day, after bouncing from a 24h low of 185.7 and reaching a high of 195.1.
The 1-hour chart shows a gradual climb from the November 16 low, with price forming higher lows through the morning of the 17th. A strong green candle in the latest session lifted price back above the 7-period (192.6) and 25-period (191.4) moving averages, both of which are now flattening or turning up beneath it. The 99-period moving average (196.8) is still sloping steadily downward and sits above price, so it remains the main overhead hurdle.
Price is now sitting just under the 24h high of 195.1, and the latest candle shows a small red body, suggesting some hesitation at this level. Buyers have the short-term edge, but the broader structure is not confirmed until the 99 MA is reclaimed.
Volume is moderate, with around 42,500 TAO, or roughly 8.12M USDT, traded in the last 24 hours. Recent candles show participation holding steady rather than surging, so a breakout would look more convincing with a pickup in volume.
What I’m watching next:
Resistance: the 195.1 area, the 24h high, followed by the 196.8 level at the MA(99). A clean hourly close above both could open the way toward 199 to 200.
Support: the 192.6 zone near the MA(7), followed by the 191.4 level where the MA(25) sits. A close below 191 would weaken the short-term recovery.
For now, I’d treat this as a constructive but unconfirmed move. Holding above the short-term averages keeps the bulls in control, while a rejection from the 99 MA could send price back toward the 190 area.
#Bittensor #TAO #CryptoTrading #TechnicalAnalysis #AltcoinUpdate
$TAO
Bittensor is building a steady recovery. TAO/USDT is trading at 194.4 USDT, up 4.01% on the day, after bouncing from a 24h low of 185.7 and reaching a high of 195.1.
The 1-hour chart shows a gradual climb from the November 16 low, with price forming higher lows through the morning of the 17th. A strong green candle in the latest session lifted price back above the 7-period (192.6) and 25-period (191.4) moving averages, both of which are now flattening or turning up beneath it. The 99-period moving average (196.8) is still sloping steadily downward and sits above price, so it remains the main overhead hurdle.
Price is now sitting just under the 24h high of 195.1, and the latest candle shows a small red body, suggesting some hesitation at this level. Buyers have the short-term edge, but the broader structure is not confirmed until the 99 MA is reclaimed.
Volume is moderate, with around 42,500 TAO, or roughly 8.12M USDT, traded in the last 24 hours. Recent candles show participation holding steady rather than surging, so a breakout would look more convincing with a pickup in volume.
What I’m watching next:
Resistance: the 195.1 area, the 24h high, followed by the 196.8 level at the MA(99). A clean hourly close above both could open the way toward 199 to 200.
Support: the 192.6 zone near the MA(7), followed by the 191.4 level where the MA(25) sits. A close below 191 would weaken the short-term recovery.
For now, I’d treat this as a constructive but unconfirmed move. Holding above the short-term averages keeps the bulls in control, while a rejection from the 99 MA could send price back toward the 190 area.
#Bittensor #TAO #CryptoTrading #TechnicalAnalysis #AltcoinUpdate
$TAO
5
Injective (INJ) Surges 14.7% to $7.609 as Price Breaks Out Above the Moving Averages on Rising Volume
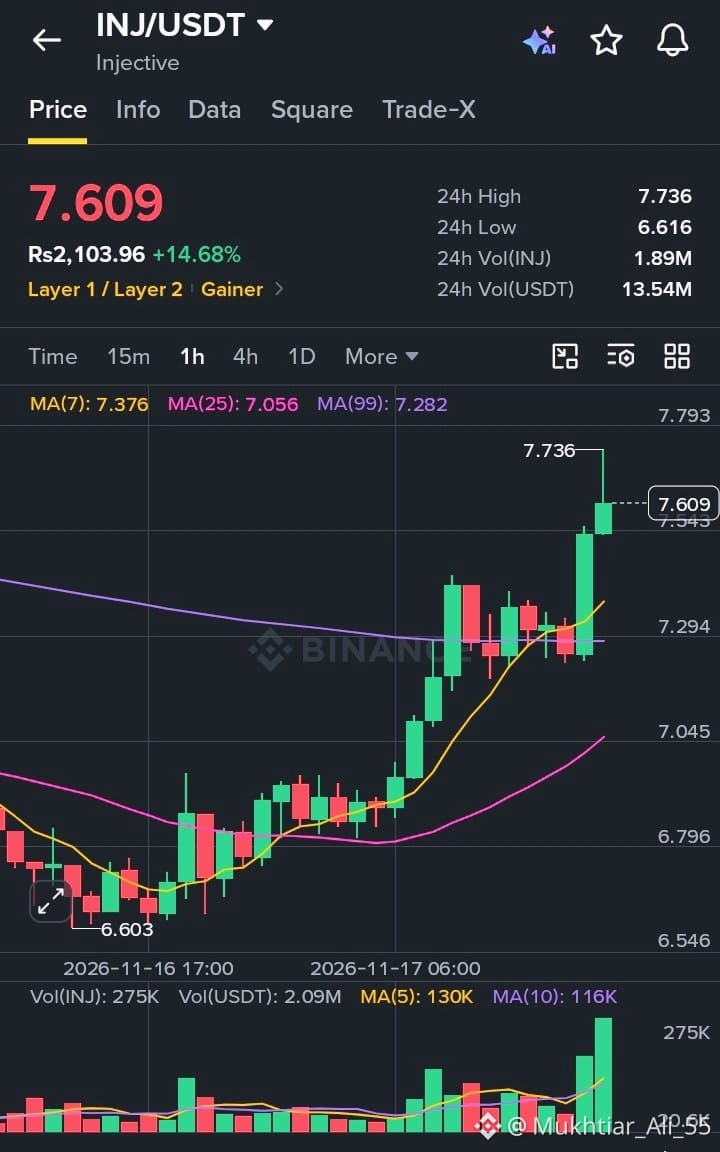
Injective is one of the stronger movers today. INJ/USDT is trading at 7.609 USDT, up 14.68% on the day, after bouncing from a 24h low of 6.616 and reaching a high of 7.736.
The 1-hour chart shows a clean recovery from the November 16 low, with price building higher lows through the morning of the 17th. After a brief consolidation around the 7.28 to 7.40 zone, buyers pushed through with a strong green candle and sent price up to 7.736 before easing back slightly. The 7-period moving average (7.376) is sloping sharply upward and sits well above the 99-period (7.282), while the 25-period (7.056) is also turning higher. Price is now trading above all three, which is a constructive setup.
The long upper wick on the latest candle shows some profit-taking near 7.736, so a short pause would not be unusual after such a fast move.
Volume supports the breakout. Around 1.89M INJ, or roughly 13.54M USDT, has traded in the last 24 hours, and the most recent candles show the highest volume on the chart. Rising participation on the push higher adds credibility to the move.
What I’m watching next:
Resistance: the 7.736 area, the 24h high, followed by the 7.79 level. A clean hourly close above it could open the way toward 8.00.
Support: the 7.376 zone near the MA(7), followed by the 7.28 area where the MA(99) sits. A hold above 7.28 keeps the breakout structure intact.
For now, momentum favors the bulls, but after a near 15% daily gain, a retest of the breakout zone would be healthy before any continuation.
#Injective #INJ #CryptoTrading #TechnicalAnalysis #AltcoinUpdate
$INJ
{spot}(INJUSDT)
Injective (INJ) Surges 14.7% to $7.609 as Price Breaks Out Above the Moving Averages on Rising Volume
Injective is one of the stronger movers today. INJ/USDT is trading at 7.609 USDT, up 14.68% on the day, after bouncing from a 24h low of 6.616 and reaching a high of 7.736.
The 1-hour chart shows a clean recovery from the November 16 low, with price building higher lows through the morning of the 17th. After a brief consolidation around the 7.28 to 7.40 zone, buyers pushed through with a strong green candle and sent price up to 7.736 before easing back slightly. The 7-period moving average (7.376) is sloping sharply upward and sits well above the 99-period (7.282), while the 25-period (7.056) is also turning higher. Price is now trading above all three, which is a constructive setup.
The long upper wick on the latest candle shows some profit-taking near 7.736, so a short pause would not be unusual after such a fast move.
Volume supports the breakout. Around 1.89M INJ, or roughly 13.54M USDT, has traded in the last 24 hours, and the most recent candles show the highest volume on the chart. Rising participation on the push higher adds credibility to the move.
What I’m watching next:
Resistance: the 7.736 area, the 24h high, followed by the 7.79 level. A clean hourly close above it could open the way toward 8.00.
Support: the 7.376 zone near the MA(7), followed by the 7.28 area where the MA(99) sits. A hold above 7.28 keeps the breakout structure intact.
For now, momentum favors the bulls, but after a near 15% daily gain, a retest of the breakout zone would be healthy before any continuation.
#Injective #INJ #CryptoTrading #TechnicalAnalysis #AltcoinUpdate
$INJ
Injective is one of the stronger movers today. INJ/USDT is trading at 7.609 USDT, up 14.68% on the day, after bouncing from a 24h low of 6.616 and reaching a high of 7.736.
The 1-hour chart shows a clean recovery from the November 16 low, with price building higher lows through the morning of the 17th. After a brief consolidation around the 7.28 to 7.40 zone, buyers pushed through with a strong green candle and sent price up to 7.736 before easing back slightly. The 7-period moving average (7.376) is sloping sharply upward and sits well above the 99-period (7.282), while the 25-period (7.056) is also turning higher. Price is now trading above all three, which is a constructive setup.
The long upper wick on the latest candle shows some profit-taking near 7.736, so a short pause would not be unusual after such a fast move.
Volume supports the breakout. Around 1.89M INJ, or roughly 13.54M USDT, has traded in the last 24 hours, and the most recent candles show the highest volume on the chart. Rising participation on the push higher adds credibility to the move.
What I’m watching next:
Resistance: the 7.736 area, the 24h high, followed by the 7.79 level. A clean hourly close above it could open the way toward 8.00.
Support: the 7.376 zone near the MA(7), followed by the 7.28 area where the MA(99) sits. A hold above 7.28 keeps the breakout structure intact.
For now, momentum favors the bulls, but after a near 15% daily gain, a retest of the breakout zone would be healthy before any continuation.
#Injective #INJ #CryptoTrading #TechnicalAnalysis #AltcoinUpdate
$INJ
4
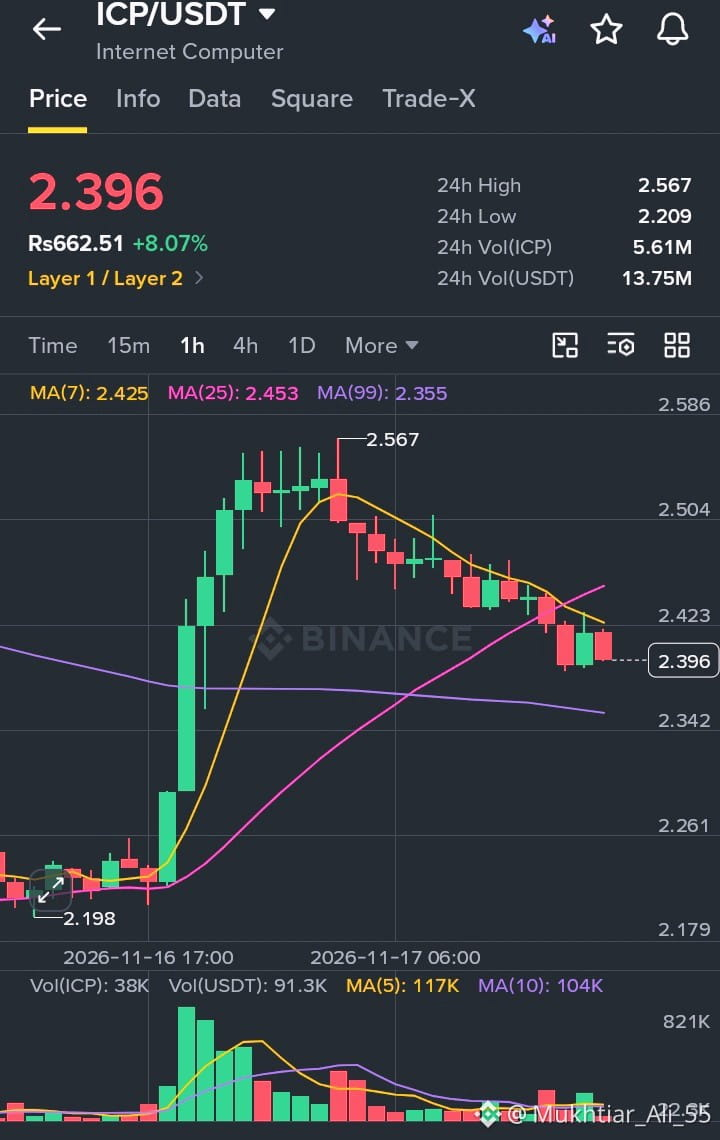
Internet Computer (ICP) Gains 8.1% to $2.396 as Price Cools Off Toward the 99-Period Moving Average
Internet Computer is giving back part of a sharp rally. ICP/USDT is trading at 2.396 USDT, up 8.07% on the day, after bouncing from a 24h low of 2.209 and reaching a high of 2.567.
The 1-hour chart shows an explosive move on the morning of November 17, with a run of strong green candles taking price from the 2.20 area up to 2.567. Since that peak, price has rolled over and produced a steady series of lower highs and red candles. The 7-period moving average (2.425) has turned down and the 25-period (2.453) has now been lost, with price trading below both. The 99-period moving average (2.355) is the next level below and sits just under the current price.
The pullback is orderly rather than panicked, but momentum has clearly shifted to the sellers in the short term. The latest candles are small and overlapping, which suggests the market is hesitating near this zone.
Volume is moderate, with around 5.61M ICP, or roughly 13.75M USDT, traded in the last 24 hours. The heaviest volume came during the initial surge, while the recent decline has happened on lighter volume, which points to profit-taking more than aggressive selling.
What I’m watching next:
Resistance: the 2.425 to 2.453 zone where the MA(7) and MA(25) now sit, followed by the 2.567 high. Price needs to reclaim this area to restore bullish momentum.
Support: the 2.355 level at the MA(99), followed by the 2.26 area where the rally began. A close below the 99 MA would put that lower zone back in play.
For now, I’d treat this as a corrective phase after a big move. A bounce from the 99 MA would keep the broader recovery alive, while a break below it could signal a deeper retracement.
#InternetComputer #ICP #CryptoTrading #TechnicalAnalysis #AltcoinUpdate
$ICP
{spot}(ICPUSDT)
Internet Computer (ICP) Gains 8.1% to $2.396 as Price Cools Off Toward the 99-Period Moving Average
Internet Computer is giving back part of a sharp rally. ICP/USDT is trading at 2.396 USDT, up 8.07% on the day, after bouncing from a 24h low of 2.209 and reaching a high of 2.567.
The 1-hour chart shows an explosive move on the morning of November 17, with a run of strong green candles taking price from the 2.20 area up to 2.567. Since that peak, price has rolled over and produced a steady series of lower highs and red candles. The 7-period moving average (2.425) has turned down and the 25-period (2.453) has now been lost, with price trading below both. The 99-period moving average (2.355) is the next level below and sits just under the current price.
The pullback is orderly rather than panicked, but momentum has clearly shifted to the sellers in the short term. The latest candles are small and overlapping, which suggests the market is hesitating near this zone.
Volume is moderate, with around 5.61M ICP, or roughly 13.75M USDT, traded in the last 24 hours. The heaviest volume came during the initial surge, while the recent decline has happened on lighter volume, which points to profit-taking more than aggressive selling.
What I’m watching next:
Resistance: the 2.425 to 2.453 zone where the MA(7) and MA(25) now sit, followed by the 2.567 high. Price needs to reclaim this area to restore bullish momentum.
Support: the 2.355 level at the MA(99), followed by the 2.26 area where the rally began. A close below the 99 MA would put that lower zone back in play.
For now, I’d treat this as a corrective phase after a big move. A bounce from the 99 MA would keep the broader recovery alive, while a break below it could signal a deeper retracement.
#InternetComputer #ICP #CryptoTrading #TechnicalAnalysis #AltcoinUpdate
$ICP
Internet Computer is giving back part of a sharp rally. ICP/USDT is trading at 2.396 USDT, up 8.07% on the day, after bouncing from a 24h low of 2.209 and reaching a high of 2.567.
The 1-hour chart shows an explosive move on the morning of November 17, with a run of strong green candles taking price from the 2.20 area up to 2.567. Since that peak, price has rolled over and produced a steady series of lower highs and red candles. The 7-period moving average (2.425) has turned down and the 25-period (2.453) has now been lost, with price trading below both. The 99-period moving average (2.355) is the next level below and sits just under the current price.
The pullback is orderly rather than panicked, but momentum has clearly shifted to the sellers in the short term. The latest candles are small and overlapping, which suggests the market is hesitating near this zone.
Volume is moderate, with around 5.61M ICP, or roughly 13.75M USDT, traded in the last 24 hours. The heaviest volume came during the initial surge, while the recent decline has happened on lighter volume, which points to profit-taking more than aggressive selling.
What I’m watching next:
Resistance: the 2.425 to 2.453 zone where the MA(7) and MA(25) now sit, followed by the 2.567 high. Price needs to reclaim this area to restore bullish momentum.
Support: the 2.355 level at the MA(99), followed by the 2.26 area where the rally began. A close below the 99 MA would put that lower zone back in play.
For now, I’d treat this as a corrective phase after a big move. A bounce from the 99 MA would keep the broader recovery alive, while a break below it could signal a deeper retracement.
#InternetComputer #ICP #CryptoTrading #TechnicalAnalysis #AltcoinUpdate
$ICP
2
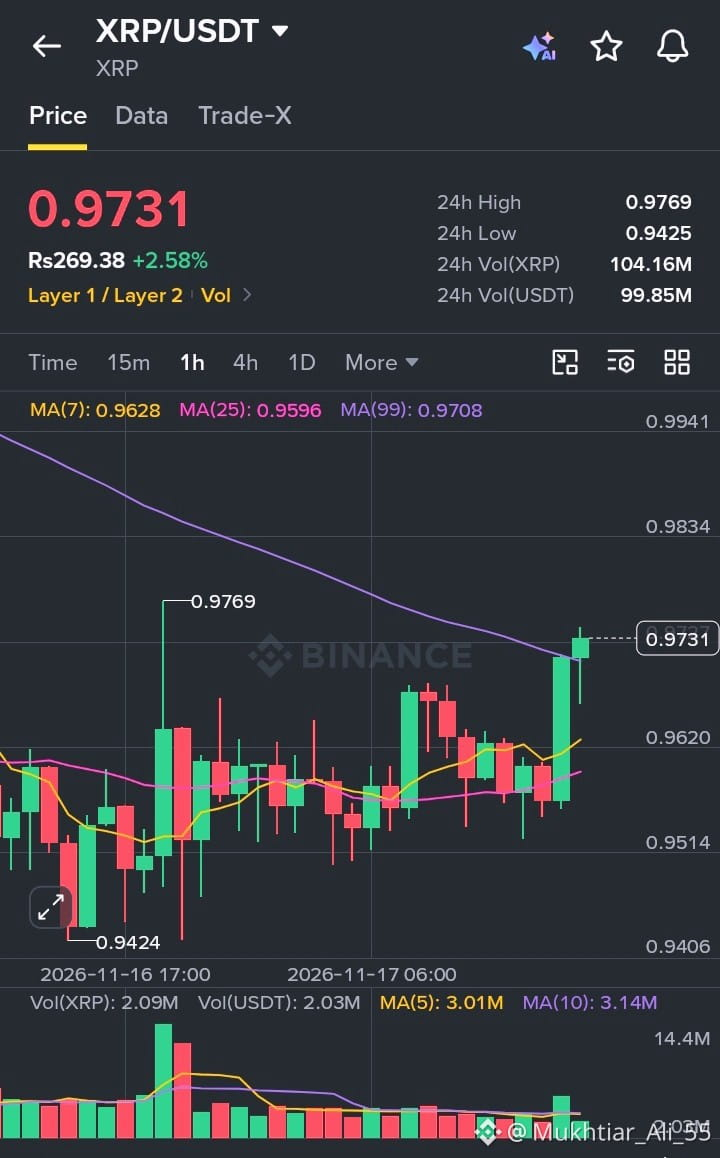
XRP Rises 2.6% to $0.9731 as Price Breaks Above the 99-Period Moving Average
XRP is showing quiet but constructive strength. XRP/USDT is trading at 0.9731 USDT (about Rs 269.38), up 2.58% on the day, after bouncing from a 24h low of 0.9425 and reaching a high of 0.9769.
The 1-hour chart shows a long stretch of sideways consolidation between 0.95 and 0.97, followed by a sharp push higher in the latest candles. That move has lifted price above the 99-period moving average (0.9708), which had been sloping down for most of this chart and acting as overhead resistance. The 7-period (0.9628) and 25-period (0.9596) averages are also curling up beneath price, which supports the short-term bullish picture.
Volume is worth keeping an eye on. Around 104.16M XRP, or roughly 99.85M USDT, has traded in the last 24 hours, but the most recent candles show lighter volume than the earlier spike near the 0.9769 high. A breakout with stronger participation would add more confidence to this move.
What I’m watching next:
Resistance: the 0.9769 area, the 24h high, followed by the 0.98 round number. A clean hourly close above it could open the way toward 0.99.
Support: the 0.9708 zone where the 99 MA now sits, followed by the 0.9620 area near the MA(7).
The latest candle is sitting just above the 99 MA, so a quick retest of that level would be normal before any continuation. Holding above it would be a good sign for buyers.
#XRP #Ripple #CryptoTrading #TechnicalAnalysis #AltcoinUpdate
$XRP
{spot}(XRPUSDT)
XRP Rises 2.6% to $0.9731 as Price Breaks Above the 99-Period Moving Average
XRP is showing quiet but constructive strength. XRP/USDT is trading at 0.9731 USDT (about Rs 269.38), up 2.58% on the day, after bouncing from a 24h low of 0.9425 and reaching a high of 0.9769.
The 1-hour chart shows a long stretch of sideways consolidation between 0.95 and 0.97, followed by a sharp push higher in the latest candles. That move has lifted price above the 99-period moving average (0.9708), which had been sloping down for most of this chart and acting as overhead resistance. The 7-period (0.9628) and 25-period (0.9596) averages are also curling up beneath price, which supports the short-term bullish picture.
Volume is worth keeping an eye on. Around 104.16M XRP, or roughly 99.85M USDT, has traded in the last 24 hours, but the most recent candles show lighter volume than the earlier spike near the 0.9769 high. A breakout with stronger participation would add more confidence to this move.
What I’m watching next:
Resistance: the 0.9769 area, the 24h high, followed by the 0.98 round number. A clean hourly close above it could open the way toward 0.99.
Support: the 0.9708 zone where the 99 MA now sits, followed by the 0.9620 area near the MA(7).
The latest candle is sitting just above the 99 MA, so a quick retest of that level would be normal before any continuation. Holding above it would be a good sign for buyers.
#XRP #Ripple #CryptoTrading #TechnicalAnalysis #AltcoinUpdate
$XRP
XRP is showing quiet but constructive strength. XRP/USDT is trading at 0.9731 USDT (about Rs 269.38), up 2.58% on the day, after bouncing from a 24h low of 0.9425 and reaching a high of 0.9769.
The 1-hour chart shows a long stretch of sideways consolidation between 0.95 and 0.97, followed by a sharp push higher in the latest candles. That move has lifted price above the 99-period moving average (0.9708), which had been sloping down for most of this chart and acting as overhead resistance. The 7-period (0.9628) and 25-period (0.9596) averages are also curling up beneath price, which supports the short-term bullish picture.
Volume is worth keeping an eye on. Around 104.16M XRP, or roughly 99.85M USDT, has traded in the last 24 hours, but the most recent candles show lighter volume than the earlier spike near the 0.9769 high. A breakout with stronger participation would add more confidence to this move.
What I’m watching next:
Resistance: the 0.9769 area, the 24h high, followed by the 0.98 round number. A clean hourly close above it could open the way toward 0.99.
Support: the 0.9708 zone where the 99 MA now sits, followed by the 0.9620 area near the MA(7).
The latest candle is sitting just above the 99 MA, so a quick retest of that level would be normal before any continuation. Holding above it would be a good sign for buyers.
#XRP #Ripple #CryptoTrading #TechnicalAnalysis #AltcoinUpdate
$XRP
1
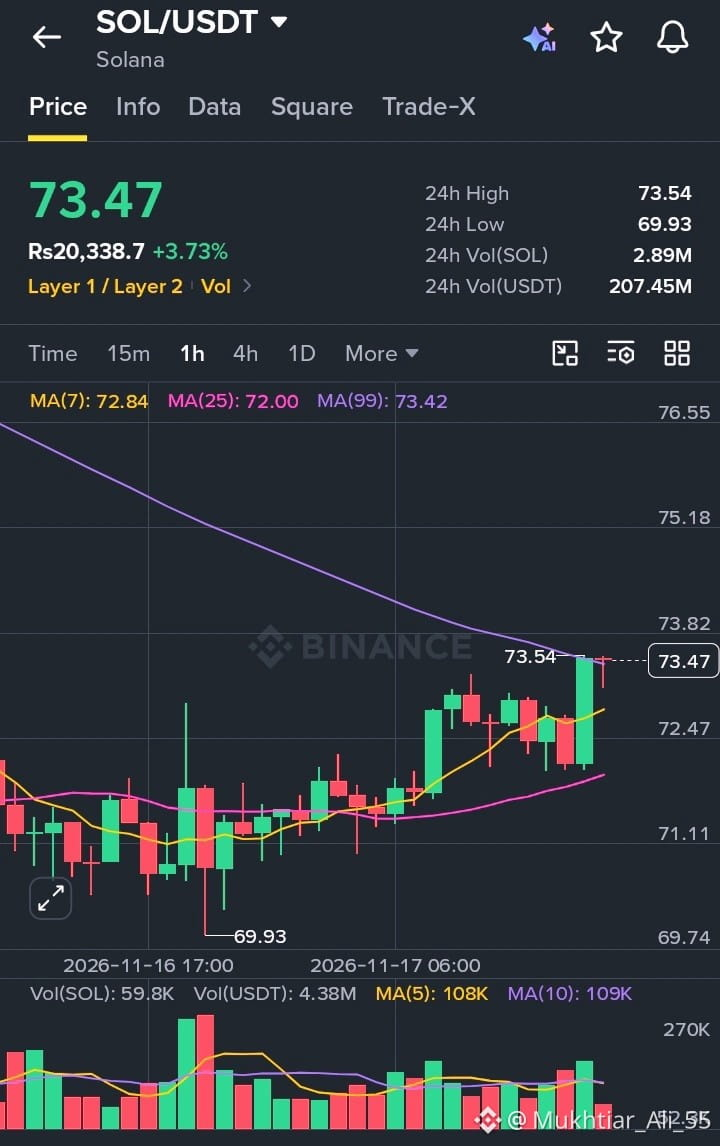
Solana (SOL) Gains 3.7% to $73.47 as Price Tests Key Resistance Near the 99-Period MA
Solana is having a steady session. SOL/USDT is trading at 73.47 USDT (about Rs 20,338), up 3.73% on the day, after bouncing from a 24h low of 69.93 and touching a high of 73.54.
The 1-hour chart shows a gradual recovery. After the dip on November 16, price built a base around the 71-72 zone and then pushed higher through the morning of the 17th. The 7-period moving average (72.84) has crossed above the 25-period (72.00), a short-term bullish signal, and price is now trading above both.
The key level is right overhead. The 99-period moving average (73.42) has been sloping downward for most of this chart, and price is now sitting right on it, with the 24h high at 73.54 just above. This is the first real test of whether buyers can flip that longer-term average into support.
Volume is solid, with around 2.89M SOL traded, or roughly 207.45M USDT, in the last 24 hours. That said, the latest candles show slightly lower volume than the earlier spikes, so I’d like to see participation pick up on any breakout.
What I’m watching next:
Resistance: the 73.50-73.54 area, where the 99 MA and 24h high meet. A clean hourly close above it could open the way toward 75.
Support: the 72.80 zone near the MA(7), followed by the 72.00 level where the MA(25) sits.
The latest candle has a small upper wick, showing some selling pressure at resistance, so a brief pause or pullback would not be a surprise before the next move.
#Solana #SOL #CryptoTrading #TechnicalAnalysis #AltcoinUpdate
$SOL
{spot}(SOLUSDT)
Solana (SOL) Gains 3.7% to $73.47 as Price Tests Key Resistance Near the 99-Period MA
Solana is having a steady session. SOL/USDT is trading at 73.47 USDT (about Rs 20,338), up 3.73% on the day, after bouncing from a 24h low of 69.93 and touching a high of 73.54.
The 1-hour chart shows a gradual recovery. After the dip on November 16, price built a base around the 71-72 zone and then pushed higher through the morning of the 17th. The 7-period moving average (72.84) has crossed above the 25-period (72.00), a short-term bullish signal, and price is now trading above both.
The key level is right overhead. The 99-period moving average (73.42) has been sloping downward for most of this chart, and price is now sitting right on it, with the 24h high at 73.54 just above. This is the first real test of whether buyers can flip that longer-term average into support.
Volume is solid, with around 2.89M SOL traded, or roughly 207.45M USDT, in the last 24 hours. That said, the latest candles show slightly lower volume than the earlier spikes, so I’d like to see participation pick up on any breakout.
What I’m watching next:
Resistance: the 73.50-73.54 area, where the 99 MA and 24h high meet. A clean hourly close above it could open the way toward 75.
Support: the 72.80 zone near the MA(7), followed by the 72.00 level where the MA(25) sits.
The latest candle has a small upper wick, showing some selling pressure at resistance, so a brief pause or pullback would not be a surprise before the next move.
#Solana #SOL #CryptoTrading #TechnicalAnalysis #AltcoinUpdate
$SOL
Solana is having a steady session. SOL/USDT is trading at 73.47 USDT (about Rs 20,338), up 3.73% on the day, after bouncing from a 24h low of 69.93 and touching a high of 73.54.
The 1-hour chart shows a gradual recovery. After the dip on November 16, price built a base around the 71-72 zone and then pushed higher through the morning of the 17th. The 7-period moving average (72.84) has crossed above the 25-period (72.00), a short-term bullish signal, and price is now trading above both.
The key level is right overhead. The 99-period moving average (73.42) has been sloping downward for most of this chart, and price is now sitting right on it, with the 24h high at 73.54 just above. This is the first real test of whether buyers can flip that longer-term average into support.
Volume is solid, with around 2.89M SOL traded, or roughly 207.45M USDT, in the last 24 hours. That said, the latest candles show slightly lower volume than the earlier spikes, so I’d like to see participation pick up on any breakout.
What I’m watching next:
Resistance: the 73.50-73.54 area, where the 99 MA and 24h high meet. A clean hourly close above it could open the way toward 75.
Support: the 72.80 zone near the MA(7), followed by the 72.00 level where the MA(25) sits.
The latest candle has a small upper wick, showing some selling pressure at resistance, so a brief pause or pullback would not be a surprise before the next move.
#Solana #SOL #CryptoTrading #TechnicalAnalysis #AltcoinUpdate
$SOL
2
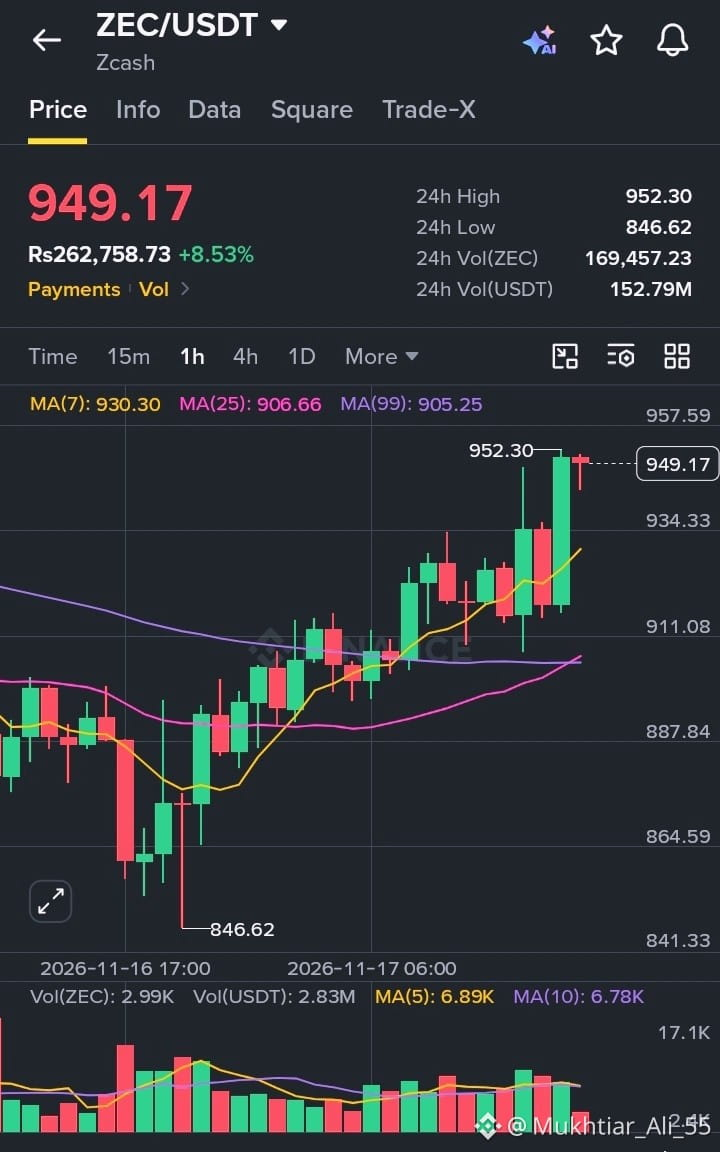
Zcash (ZEC) Climbs 8.5% to $949 as Bulls Hold the Short-Term Trend
Zcash has had a strong 24 hours. ZEC/USDT is trading at 949.17 USDT (about Rs 262,758), up 8.53% on the day, after bouncing from a 24h low of 846.62 and pushing up to a high of 952.30.
The 1-hour chart shows a clear shift in momentum. After a sharp dip on November 16, buyers stepped in and price climbed steadily through the morning of the 17th, forming a run of higher highs and higher lows. The 7-period moving average (930.30) has turned up and sits well above the 25-period (906.66) and 99-period (905.25) averages. Price is now trading above all three, which is typically a sign of strength.
Trading activity backs up the move too. 24h volume is around 169,457 ZEC, or roughly 152.79M USDT, showing real participation behind the rally and not just a thin-volume spike.
What I’m watching next:
Resistance: the 952 area, the 24h high. A clean break and hold above it could open the door to further upside.
Support: the 930 zone near the MA(7), followed by the 905-911 cluster where the longer averages sit.
The latest candle is showing a small pause just under the high, so a short consolidation or minor pullback wouldn’t be surprising after such a quick run.
#Zcash #ZEC #CryptoTrading #TechnicalAnalysis #AltcoinUpdate
Trade here 👇 👇 👇
$ZEC
{spot}(ZECUSDT)
Zcash (ZEC) Climbs 8.5% to $949 as Bulls Hold the Short-Term Trend
Zcash has had a strong 24 hours. ZEC/USDT is trading at 949.17 USDT (about Rs 262,758), up 8.53% on the day, after bouncing from a 24h low of 846.62 and pushing up to a high of 952.30.
The 1-hour chart shows a clear shift in momentum. After a sharp dip on November 16, buyers stepped in and price climbed steadily through the morning of the 17th, forming a run of higher highs and higher lows. The 7-period moving average (930.30) has turned up and sits well above the 25-period (906.66) and 99-period (905.25) averages. Price is now trading above all three, which is typically a sign of strength.
Trading activity backs up the move too. 24h volume is around 169,457 ZEC, or roughly 152.79M USDT, showing real participation behind the rally and not just a thin-volume spike.
What I’m watching next:
Resistance: the 952 area, the 24h high. A clean break and hold above it could open the door to further upside.
Support: the 930 zone near the MA(7), followed by the 905-911 cluster where the longer averages sit.
The latest candle is showing a small pause just under the high, so a short consolidation or minor pullback wouldn’t be surprising after such a quick run.
#Zcash #ZEC #CryptoTrading #TechnicalAnalysis #AltcoinUpdate
Trade here 👇 👇 👇
$ZEC
Zcash has had a strong 24 hours. ZEC/USDT is trading at 949.17 USDT (about Rs 262,758), up 8.53% on the day, after bouncing from a 24h low of 846.62 and pushing up to a high of 952.30.
The 1-hour chart shows a clear shift in momentum. After a sharp dip on November 16, buyers stepped in and price climbed steadily through the morning of the 17th, forming a run of higher highs and higher lows. The 7-period moving average (930.30) has turned up and sits well above the 25-period (906.66) and 99-period (905.25) averages. Price is now trading above all three, which is typically a sign of strength.
Trading activity backs up the move too. 24h volume is around 169,457 ZEC, or roughly 152.79M USDT, showing real participation behind the rally and not just a thin-volume spike.
What I’m watching next:
Resistance: the 952 area, the 24h high. A clean break and hold above it could open the door to further upside.
Support: the 930 zone near the MA(7), followed by the 905-911 cluster where the longer averages sit.
The latest candle is showing a small pause just under the high, so a short consolidation or minor pullback wouldn’t be surprising after such a quick run.
#Zcash #ZEC #CryptoTrading #TechnicalAnalysis #AltcoinUpdate
Trade here 👇 👇 👇
$ZEC
6
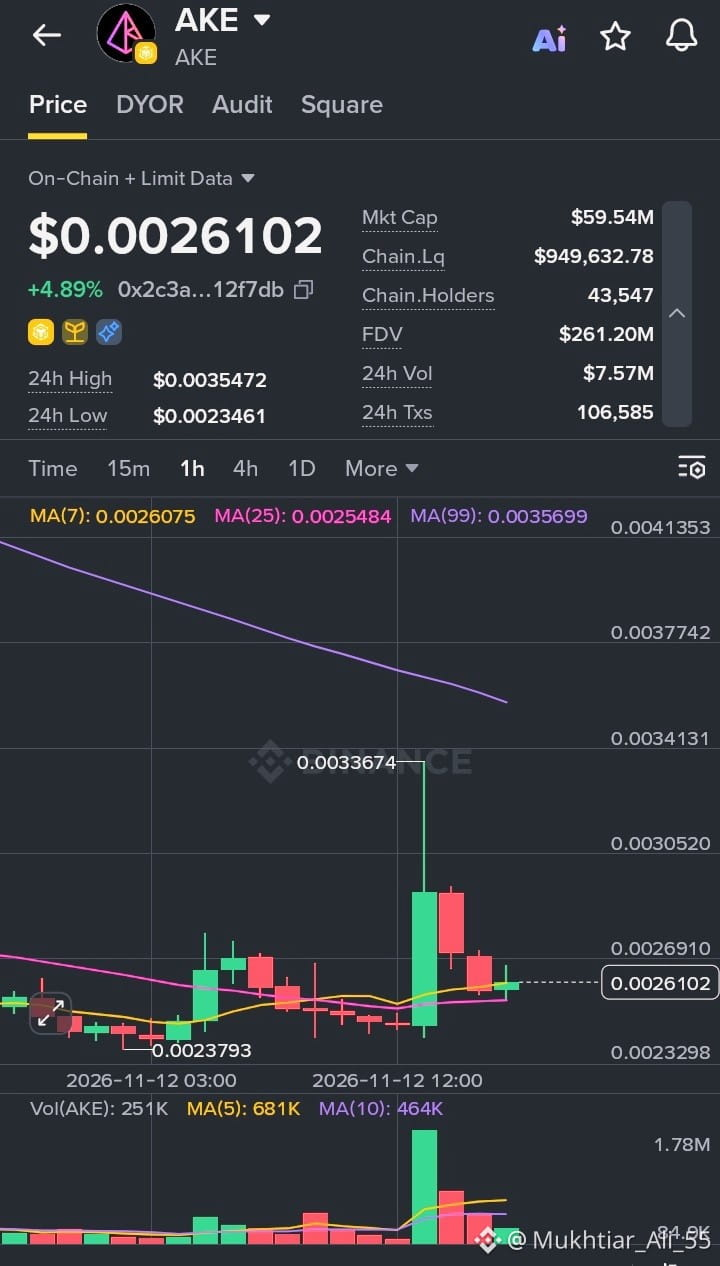
$AKE Cools Off After a Sharp Spike, Now Consolidating Near the Moving Averages
$AKE is trading at $0.0026102, up 4.89% on the day, after a volatile session that saw price reach a 24h high of $0.0035472 against a low of $0.0023461. The 1h chart shows a sudden spike to around $0.0033674, which was quickly sold off, and price has since settled back into a tighter range.
Right now, price is sitting almost on top of the short-term averages. The MA(7) is at 0.0026075 and the MA(25) at 0.0025484, so AKE is holding just above both. The MA(99) at 0.0035699 is still well overhead and trending down, which tells us the larger trend remains bearish until price can make a serious recovery toward that area.
Fundamentals on the data side: market cap is $59.54M with an FDV of $261.20M. 24h volume is $7.57M across 106,585 transactions, with 43,547 holders and on-chain liquidity of roughly $949.6K. Volume has faded considerably since the spike, which suggests the initial excitement has cooled.
I’m watching the 0.0025 to 0.0026 zone as near-term support. Holding above it keeps the bounce structure intact, while a drop toward the 0.00238 low would put sellers back in control. On the upside, 0.0027 to 0.0029 is the first area to reclaim. Not financial advice, just my read of the chart. Always do your own research.
#AKE #CryptoAnalysis #BinanceAlpha #TechnicalAnalysis #AltcoinUpdate
$AKE
{future}(AKEUSDT)
$AKE Cools Off After a Sharp Spike, Now Consolidating Near the Moving Averages
$AKE is trading at $0.0026102, up 4.89% on the day, after a volatile session that saw price reach a 24h high of $0.0035472 against a low of $0.0023461. The 1h chart shows a sudden spike to around $0.0033674, which was quickly sold off, and price has since settled back into a tighter range.
Right now, price is sitting almost on top of the short-term averages. The MA(7) is at 0.0026075 and the MA(25) at 0.0025484, so AKE is holding just above both. The MA(99) at 0.0035699 is still well overhead and trending down, which tells us the larger trend remains bearish until price can make a serious recovery toward that area.
Fundamentals on the data side: market cap is $59.54M with an FDV of $261.20M. 24h volume is $7.57M across 106,585 transactions, with 43,547 holders and on-chain liquidity of roughly $949.6K. Volume has faded considerably since the spike, which suggests the initial excitement has cooled.
I’m watching the 0.0025 to 0.0026 zone as near-term support. Holding above it keeps the bounce structure intact, while a drop toward the 0.00238 low would put sellers back in control. On the upside, 0.0027 to 0.0029 is the first area to reclaim. Not financial advice, just my read of the chart. Always do your own research.
#AKE #CryptoAnalysis #BinanceAlpha #TechnicalAnalysis #AltcoinUpdate
$AKE
$AKE is trading at $0.0026102, up 4.89% on the day, after a volatile session that saw price reach a 24h high of $0.0035472 against a low of $0.0023461. The 1h chart shows a sudden spike to around $0.0033674, which was quickly sold off, and price has since settled back into a tighter range.
Right now, price is sitting almost on top of the short-term averages. The MA(7) is at 0.0026075 and the MA(25) at 0.0025484, so AKE is holding just above both. The MA(99) at 0.0035699 is still well overhead and trending down, which tells us the larger trend remains bearish until price can make a serious recovery toward that area.
Fundamentals on the data side: market cap is $59.54M with an FDV of $261.20M. 24h volume is $7.57M across 106,585 transactions, with 43,547 holders and on-chain liquidity of roughly $949.6K. Volume has faded considerably since the spike, which suggests the initial excitement has cooled.
I’m watching the 0.0025 to 0.0026 zone as near-term support. Holding above it keeps the bounce structure intact, while a drop toward the 0.00238 low would put sellers back in control. On the upside, 0.0027 to 0.0029 is the first area to reclaim. Not financial advice, just my read of the chart. Always do your own research.
#AKE #CryptoAnalysis #BinanceAlpha #TechnicalAnalysis #AltcoinUpdate
$AKE
2
18

·
--
Midweek Momentum: $UAI Holds Tight in a 34% Surge 🚀
Price action: $UAI is trading at $0.1329 on Binance Spot, up 34.11% over the past 24 hours. 24‑hour volume surged to $397.9 M, reflecting heightened interest despite a broadly neutral market tone.
Key levels: Immediate support sits near $0.1200, where buying has previously anchored. A mid‑range pivot is around $0.1320, acting as a psychological barrier. Above that, resistance looms at $0.1480, a level that capped earlier rallies. A decisive break above $0.1480 could launch the next leg, while a slip back to $0.1200 would likely re‑establish the current consolidation zone.
Outlook: With sentiment neutral and no fresh catalysts, $UAI is expected to consolidate within this range. Traders should watch for a clear breakout or breakdown before committing to directional bias. 📈🔧
#UAI #AltcoinUpdate #BinanceSquare
Midweek Momentum: $UAI Holds Tight in a 34% Surge 🚀
Price action: $UAI is trading at $0.1329 on Binance Spot, up 34.11% over the past 24 hours. 24‑hour volume surged to $397.9 M, reflecting heightened interest despite a broadly neutral market tone.
Key levels: Immediate support sits near $0.1200, where buying has previously anchored. A mid‑range pivot is around $0.1320, acting as a psychological barrier. Above that, resistance looms at $0.1480, a level that capped earlier rallies. A decisive break above $0.1480 could launch the next leg, while a slip back to $0.1200 would likely re‑establish the current consolidation zone.
Outlook: With sentiment neutral and no fresh catalysts, $UAI is expected to consolidate within this range. Traders should watch for a clear breakout or breakdown before committing to directional bias. 📈🔧
#UAI #AltcoinUpdate #BinanceSquare
Price action: $UAI is trading at $0.1329 on Binance Spot, up 34.11% over the past 24 hours. 24‑hour volume surged to $397.9 M, reflecting heightened interest despite a broadly neutral market tone.
Key levels: Immediate support sits near $0.1200, where buying has previously anchored. A mid‑range pivot is around $0.1320, acting as a psychological barrier. Above that, resistance looms at $0.1480, a level that capped earlier rallies. A decisive break above $0.1480 could launch the next leg, while a slip back to $0.1200 would likely re‑establish the current consolidation zone.
Outlook: With sentiment neutral and no fresh catalysts, $UAI is expected to consolidate within this range. Traders should watch for a clear breakout or breakdown before committing to directional bias. 📈🔧
#UAI #AltcoinUpdate #BinanceSquare
1
·
--
GWEI Rally: Neutral Sentiment Meets Sharp 27% Surge 🌐
Price action: $GWEI is trading at $0.022830 on Binance Spot, up 26.90% over the past 24 hours. 24‑hour volume sits near $27.7 M, indicating healthy participation despite a neutral sentiment backdrop.
Key levels: Immediate support anchors around $0.0205, while the ceiling of the current up‑trend sits near $0.0250. The mid‑range pivot is roughly $0.0235, acting as a magnet for intraday swings.
Outlook: With buyers defending the $0.0205 floor, the next leg could test $0.0250 resistance. A breach below support would likely open the path to deeper downside, so holding the floor is critical for a sustained rally. 🛡️
#GWEI #AltcoinUpdate #CryptoAnalysis
GWEI Rally: Neutral Sentiment Meets Sharp 27% Surge 🌐
Price action: $GWEI is trading at $0.022830 on Binance Spot, up 26.90% over the past 24 hours. 24‑hour volume sits near $27.7 M, indicating healthy participation despite a neutral sentiment backdrop.
Key levels: Immediate support anchors around $0.0205, while the ceiling of the current up‑trend sits near $0.0250. The mid‑range pivot is roughly $0.0235, acting as a magnet for intraday swings.
Outlook: With buyers defending the $0.0205 floor, the next leg could test $0.0250 resistance. A breach below support would likely open the path to deeper downside, so holding the floor is critical for a sustained rally. 🛡️
#GWEI #AltcoinUpdate #CryptoAnalysis
Price action: $GWEI is trading at $0.022830 on Binance Spot, up 26.90% over the past 24 hours. 24‑hour volume sits near $27.7 M, indicating healthy participation despite a neutral sentiment backdrop.
Key levels: Immediate support anchors around $0.0205, while the ceiling of the current up‑trend sits near $0.0250. The mid‑range pivot is roughly $0.0235, acting as a magnet for intraday swings.
Outlook: With buyers defending the $0.0205 floor, the next leg could test $0.0250 resistance. A breach below support would likely open the path to deeper downside, so holding the floor is critical for a sustained rally. 🛡️
#GWEI #AltcoinUpdate #CryptoAnalysis
3

·
--
💰 $PUNDIX IS KEEPING THE BULLS BUSY!
Pundi X is showing positive market activity as $PUNDIX advances to $0.1115.
The token has recorded an 11.06% gain over the last 24 hours.
📊 Today's Price Action:
• Current Price: $0.1115
• 24H Performance: +11.06%
• Market Direction: Positive
🚀 Why Keep Watching $PUNDIX ?
Pundi X focuses on blockchain-based payment solutions, making it an interesting name in the crypto payments sector.
The current rally is encouraging, but traders should look for confirmation before expecting further upside.
Patience and proper risk management can make a big difference.
#PUNDIX #PundiX #CryptoPayments #AltcoinUpdate
💰 $PUNDIX IS KEEPING THE BULLS BUSY!
Pundi X is showing positive market activity as $PUNDIX advances to $0.1115.
The token has recorded an 11.06% gain over the last 24 hours.
📊 Today's Price Action:
• Current Price: $0.1115
• 24H Performance: +11.06%
• Market Direction: Positive
🚀 Why Keep Watching $PUNDIX ?
Pundi X focuses on blockchain-based payment solutions, making it an interesting name in the crypto payments sector.
The current rally is encouraging, but traders should look for confirmation before expecting further upside.
Patience and proper risk management can make a big difference.
#PUNDIX #PundiX #CryptoPayments #AltcoinUpdate
Pundi X is showing positive market activity as $PUNDIX advances to $0.1115.
The token has recorded an 11.06% gain over the last 24 hours.
📊 Today's Price Action:
• Current Price: $0.1115
• 24H Performance: +11.06%
• Market Direction: Positive
🚀 Why Keep Watching $PUNDIX ?
Pundi X focuses on blockchain-based payment solutions, making it an interesting name in the crypto payments sector.
The current rally is encouraging, but traders should look for confirmation before expecting further upside.
Patience and proper risk management can make a big difference.
#PUNDIX #PundiX #CryptoPayments #AltcoinUpdate
62
·
--
📊 $T THRESHOLD IS GREEN — T TOKEN GAINS MOMENTUM!
Current Price: $0.00498
24H Change: +6.18%
$T hreshold is moving higher, recording a gain of more than 6% in the supplied market data.
• Watch whether buyers can maintain upward pressure.
• A break above a nearby resistance level could strengthen the setup, if confirmed.
• Losing support could weaken the current momentum.
My approach: Focus on price action, volume, and confirmation. Do not assume that one green day means a new uptrend has started.
#TerraLabs #ThresholdCrypto #CryptoTrading #AltcoinUpdate
📊 $T THRESHOLD IS GREEN — T TOKEN GAINS MOMENTUM!
Current Price: $0.00498
24H Change: +6.18%
$T hreshold is moving higher, recording a gain of more than 6% in the supplied market data.
• Watch whether buyers can maintain upward pressure.
• A break above a nearby resistance level could strengthen the setup, if confirmed.
• Losing support could weaken the current momentum.
My approach: Focus on price action, volume, and confirmation. Do not assume that one green day means a new uptrend has started.
#TerraLabs #ThresholdCrypto #CryptoTrading #AltcoinUpdate
Current Price: $0.00498
24H Change: +6.18%
$T hreshold is moving higher, recording a gain of more than 6% in the supplied market data.
• Watch whether buyers can maintain upward pressure.
• A break above a nearby resistance level could strengthen the setup, if confirmed.
• Losing support could weaken the current momentum.
My approach: Focus on price action, volume, and confirmation. Do not assume that one green day means a new uptrend has started.
#TerraLabs #ThresholdCrypto #CryptoTrading #AltcoinUpdate
2
561

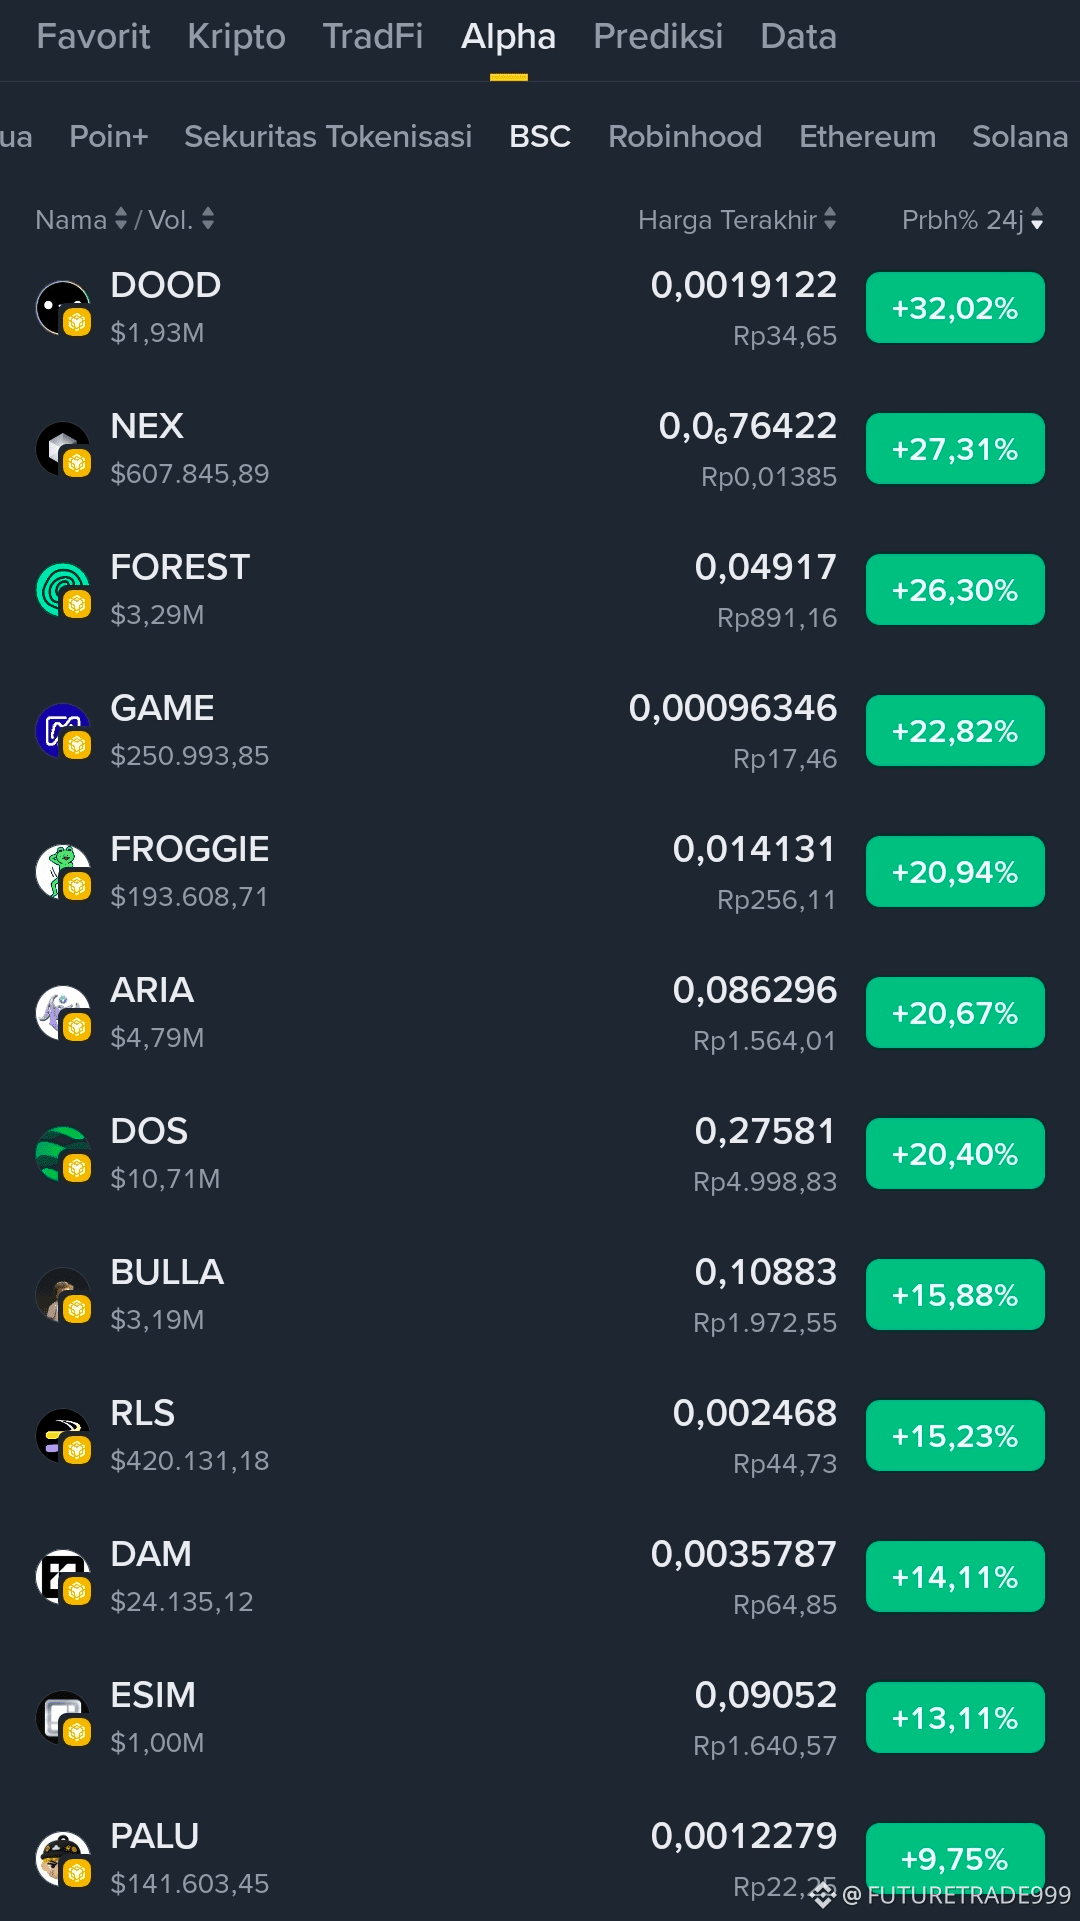
🚀 UPDATE PASAR ALPHA — Hijau Pekat Semua! 🟢
📊 Gambaran Pasar
Sektor Alpha sedang menunjukkan kekuatan yang luar biasa hari ini — hampir seluruh daftar berwarna hijau pekat. Likuiditas mulai bergerak ke altcoin berkapitalisasi kecil & menengah. Namun ingat: kenaikan cepat selalu membawa risiko koreksi yang sama cepatnya — kelola risiko dengan bijak! ⚠️
🏆 Top Performer Hari Ini
Peringkat Koin Harga Kenaikan 24j Volume
👑 $DOOD D $0,0019122 +32,02% $1,93M
🥈 $NEX $0,676422 +27,31% $607rb
🥉 $FOREST $0,04917 +26,30% $3,29M ⭐
4️⃣ $GAME $0,00096346 +22,82% $250rb
5️⃣ $FROGGIE $0,014131 +20,94% $193rb
6️⃣ $DOS $0,27581 +20,40% $10,71M ⭐
🔍 Analisis Singkat
🔥 DOOD** memimpin dengan kenaikan +32% — momentum terkuat hari ini, tapi perhatikan volumenya yang relatif kecil = berisiko tinggi
🔥 **NEX naik +27% — harga sudah lebih tinggi, perhatikan apakah bisa bertahan di level ini
🔥 DOS — kenaikan kuat disertai volume besar = minat beli nyata, lebih stabil dibanding yang lain
✅ Koin di urutan bawah seperti $BULLA, $RLS, $DAM — kenaikan lebih wajar, belum terlalu panas, bisa masuk daftar pantauan
💡 Strategi Bijak Hari Ini
✅ Lakukan:
- Fokus ke yang kenaikannya disertai volume naik → $FOREST & $DOS terlihat paling menjanjikan
- Tunggu pullback sebelum masuk — harga tidak akan lurus naik selamanya
- Ambil profit bertahap — jangan serakah
- Pasang Stop-Loss wajib
❌ Hindari:
- FOMO masuk hanya karena hijau besar
- All-in ke satu koin dengan volume kecil
- Membiarkan posisi tanpa rencana keluar
⚠️ Peringatan Risiko
Kategori Alpha = volatilitas tinggi. Kenaikan 30% hari ini bisa berbalik koreksi 20% besok. Gunakan hanya modal yang siap Anda tanggung kerugiannya. DYOR — Bukan nasihat keuangan!
#ALPHACOINS #AltcoinUpdate #PasarKripto #KriptoIndonesia #TradingIdeas
🚀 UPDATE PASAR ALPHA — Hijau Pekat Semua! 🟢
📊 Gambaran Pasar
Sektor Alpha sedang menunjukkan kekuatan yang luar biasa hari ini — hampir seluruh daftar berwarna hijau pekat. Likuiditas mulai bergerak ke altcoin berkapitalisasi kecil & menengah. Namun ingat: kenaikan cepat selalu membawa risiko koreksi yang sama cepatnya — kelola risiko dengan bijak! ⚠️
🏆 Top Performer Hari Ini
Peringkat Koin Harga Kenaikan 24j Volume
👑 $DOOD D $0,0019122 +32,02% $1,93M
🥈 $NEX $0,676422 +27,31% $607rb
🥉 $FOREST $0,04917 +26,30% $3,29M ⭐
4️⃣ $GAME $0,00096346 +22,82% $250rb
5️⃣ $FROGGIE $0,014131 +20,94% $193rb
6️⃣ $DOS $0,27581 +20,40% $10,71M ⭐
🔍 Analisis Singkat
🔥 DOOD** memimpin dengan kenaikan +32% — momentum terkuat hari ini, tapi perhatikan volumenya yang relatif kecil = berisiko tinggi
🔥 **NEX naik +27% — harga sudah lebih tinggi, perhatikan apakah bisa bertahan di level ini
🔥 DOS — kenaikan kuat disertai volume besar = minat beli nyata, lebih stabil dibanding yang lain
✅ Koin di urutan bawah seperti $BULLA, $RLS, $DAM — kenaikan lebih wajar, belum terlalu panas, bisa masuk daftar pantauan
💡 Strategi Bijak Hari Ini
✅ Lakukan:
- Fokus ke yang kenaikannya disertai volume naik → $FOREST & $DOS terlihat paling menjanjikan
- Tunggu pullback sebelum masuk — harga tidak akan lurus naik selamanya
- Ambil profit bertahap — jangan serakah
- Pasang Stop-Loss wajib
❌ Hindari:
- FOMO masuk hanya karena hijau besar
- All-in ke satu koin dengan volume kecil
- Membiarkan posisi tanpa rencana keluar
⚠️ Peringatan Risiko
Kategori Alpha = volatilitas tinggi. Kenaikan 30% hari ini bisa berbalik koreksi 20% besok. Gunakan hanya modal yang siap Anda tanggung kerugiannya. DYOR — Bukan nasihat keuangan!
#ALPHACOINS #AltcoinUpdate #PasarKripto #KriptoIndonesia #TradingIdeas
📊 Gambaran Pasar
Sektor Alpha sedang menunjukkan kekuatan yang luar biasa hari ini — hampir seluruh daftar berwarna hijau pekat. Likuiditas mulai bergerak ke altcoin berkapitalisasi kecil & menengah. Namun ingat: kenaikan cepat selalu membawa risiko koreksi yang sama cepatnya — kelola risiko dengan bijak! ⚠️
🏆 Top Performer Hari Ini
Peringkat Koin Harga Kenaikan 24j Volume
👑 $DOOD D $0,0019122 +32,02% $1,93M
🥈 $NEX $0,676422 +27,31% $607rb
🥉 $FOREST $0,04917 +26,30% $3,29M ⭐
4️⃣ $GAME $0,00096346 +22,82% $250rb
5️⃣ $FROGGIE $0,014131 +20,94% $193rb
6️⃣ $DOS $0,27581 +20,40% $10,71M ⭐
🔍 Analisis Singkat
🔥 DOOD** memimpin dengan kenaikan +32% — momentum terkuat hari ini, tapi perhatikan volumenya yang relatif kecil = berisiko tinggi
🔥 **NEX naik +27% — harga sudah lebih tinggi, perhatikan apakah bisa bertahan di level ini
🔥 DOS — kenaikan kuat disertai volume besar = minat beli nyata, lebih stabil dibanding yang lain
✅ Koin di urutan bawah seperti $BULLA, $RLS, $DAM — kenaikan lebih wajar, belum terlalu panas, bisa masuk daftar pantauan
💡 Strategi Bijak Hari Ini
✅ Lakukan:
- Fokus ke yang kenaikannya disertai volume naik → $FOREST & $DOS terlihat paling menjanjikan
- Tunggu pullback sebelum masuk — harga tidak akan lurus naik selamanya
- Ambil profit bertahap — jangan serakah
- Pasang Stop-Loss wajib
❌ Hindari:
- FOMO masuk hanya karena hijau besar
- All-in ke satu koin dengan volume kecil
- Membiarkan posisi tanpa rencana keluar
⚠️ Peringatan Risiko
Kategori Alpha = volatilitas tinggi. Kenaikan 30% hari ini bisa berbalik koreksi 20% besok. Gunakan hanya modal yang siap Anda tanggung kerugiannya. DYOR — Bukan nasihat keuangan!
#ALPHACOINS #AltcoinUpdate #PasarKripto #KriptoIndonesia #TradingIdeas
1
131

$WLD exhibits strong institutional interest today, currently holding market rank 50 with a solid market capitalization of 2068118070 USDT. Momentum is decidedly positive over the last 24 hours, showing a 13.70 percent upside push driven by a substantial 269475974 USDT in trading volume. Price action has pressed past previous boundaries, establishing a 24h range between 0.463936 USDT on the lower end and a peak of 0.510969 USDT, currently trading slightly above at 0.542191 USDT. Technical assessment suggests watching how the asset behaves around the former high acting as immediate support. If volume confirmation holds during pullbacks, bulls may test higher liquidity zones. Conversely, a failure to sustain acceptance above the breakout level increases downside risk toward the mid-range demand area. Risk management remains critical as volatility expands following this volume spike.
#Worldcoin #WLDAnalysis #AltcoinUpdate #MarketStructure
$WLD exhibits strong institutional interest today, currently holding market rank 50 with a solid market capitalization of 2068118070 USDT. Momentum is decidedly positive over the last 24 hours, showing a 13.70 percent upside push driven by a substantial 269475974 USDT in trading volume. Price action has pressed past previous boundaries, establishing a 24h range between 0.463936 USDT on the lower end and a peak of 0.510969 USDT, currently trading slightly above at 0.542191 USDT. Technical assessment suggests watching how the asset behaves around the former high acting as immediate support. If volume confirmation holds during pullbacks, bulls may test higher liquidity zones. Conversely, a failure to sustain acceptance above the breakout level increases downside risk toward the mid-range demand area. Risk management remains critical as volatility expands following this volume spike.
#Worldcoin #WLDAnalysis #AltcoinUpdate #MarketStructure
#Worldcoin #WLDAnalysis #AltcoinUpdate #MarketStructure
1
122

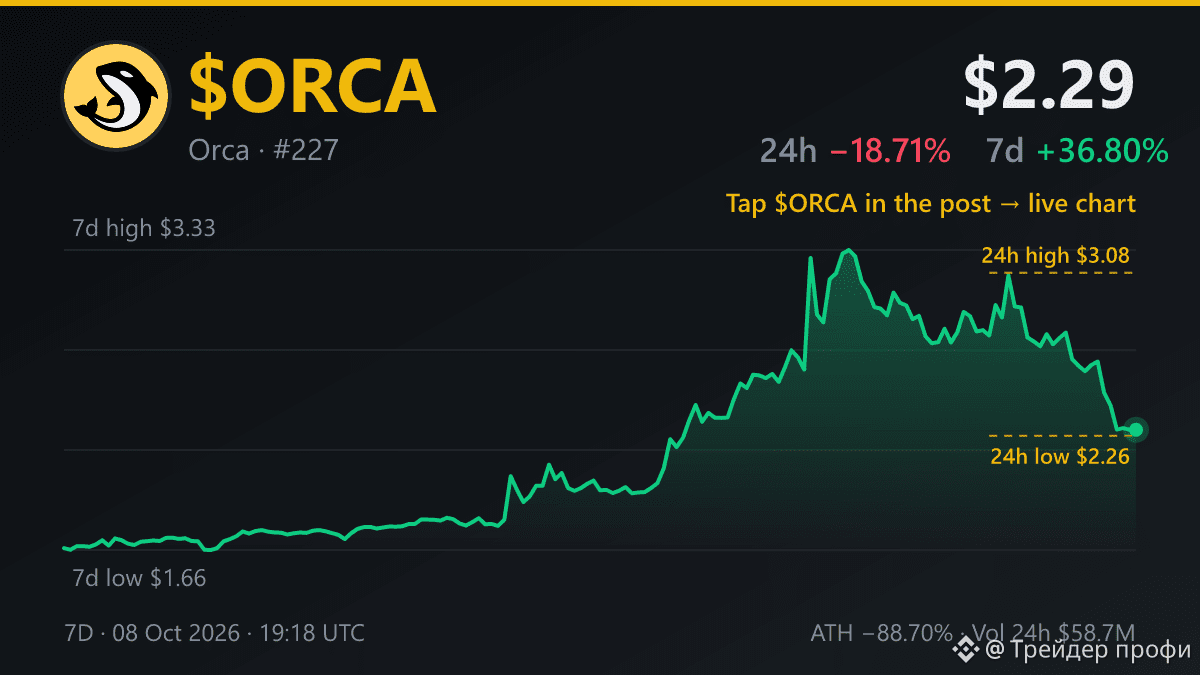
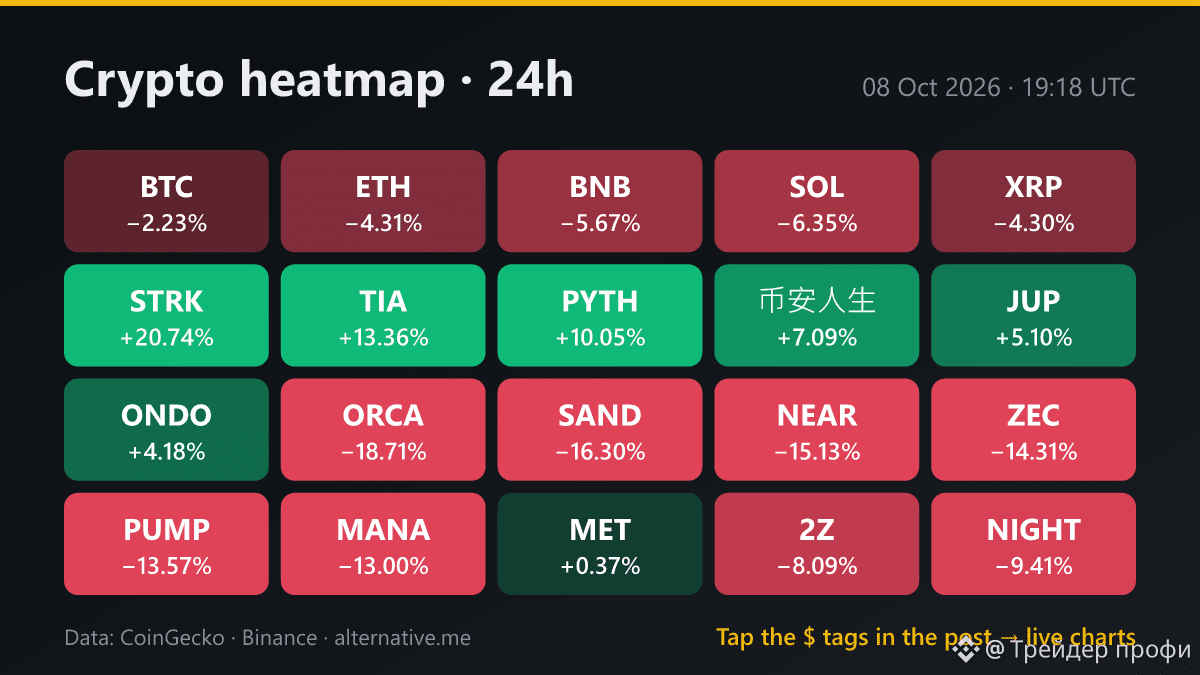
When the wider market drops 5.5%, volatile altcoins like $ORCA test every bit of previous conviction. Yesterday my focus was on how a 75.51% 7-day jump hid the risk packed into those low ranges while price hovered at $2.84. Now, the chart shows a pullback to $2.29, which is a 19.37% shift downward. ⚡
Today's range moves between a 24-hour high of $3.08 and a low of $2.26. Looking at the wider 7-day window, prices have stretched from $3.33 down to $1.66 with $58M in total volume.
Open $ORCA right now to inspect these price levels. 🔍
Did you expect such a sharp correction after the recent rally?
NFA. Always do your own research.
#ORCA #AltcoinUpdate #BinanceSquare
When the wider market drops 5.5%, volatile altcoins like $ORCA test every bit of previous conviction. Yesterday my focus was on how a 75.51% 7-day jump hid the risk packed into those low ranges while price hovered at $2.84. Now, the chart shows a pullback to $2.29, which is a 19.37% shift downward. ⚡
Today's range moves between a 24-hour high of $3.08 and a low of $2.26. Looking at the wider 7-day window, prices have stretched from $3.33 down to $1.66 with $58M in total volume.
Open $ORCA right now to inspect these price levels. 🔍
Did you expect such a sharp correction after the recent rally?
NFA. Always do your own research.
#ORCA #AltcoinUpdate #BinanceSquare
Today's range moves between a 24-hour high of $3.08 and a low of $2.26. Looking at the wider 7-day window, prices have stretched from $3.33 down to $1.66 with $58M in total volume.
Open $ORCA right now to inspect these price levels. 🔍
Did you expect such a sharp correction after the recent rally?
NFA. Always do your own research.
#ORCA #AltcoinUpdate #BinanceSquare
151

·
--
Жоғары (өспелі)
$SOL
{spot}(SOLUSDT)
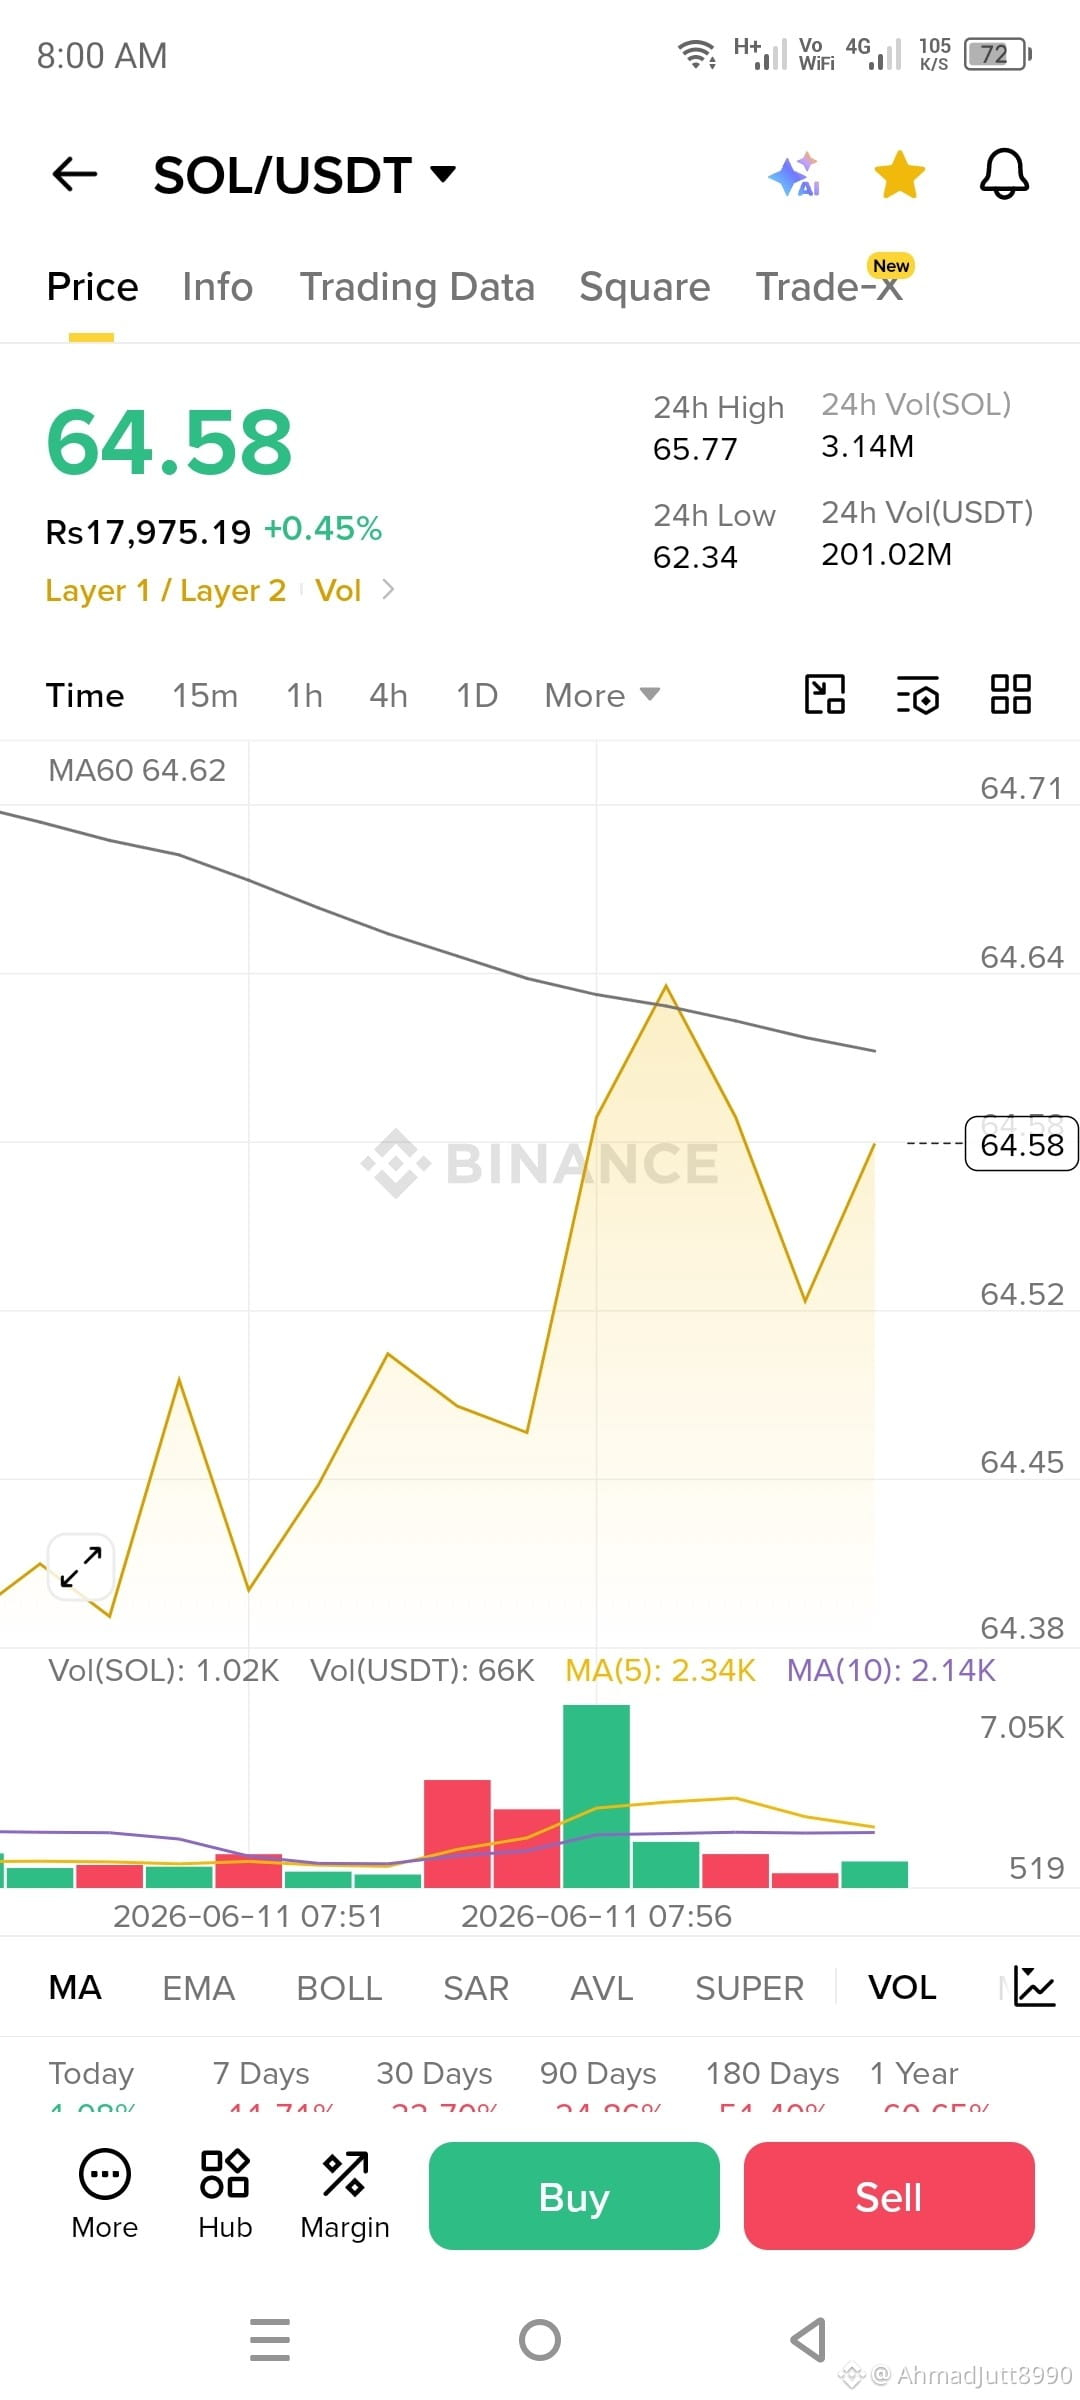
(SOL) Watch: Bullish Move or Just Noise? 🚀📉Solana has been the talk of the town lately! It’s moving up and down so fast that it's hard to tell what’s next.
🔹 Current Status: The price is showing high volatility. It pumps quickly, but then faces resistance and drops again.
🔹 My Analysis: We are seeing a lot of buying pressure, but the sellers are also very active. It’s a classic tug-of-war between bulls and bears.
🔹 Strategy: I’m keeping a close eye on the support levels. If it holds, we might see another leg up. If it breaks, a retest of lower levels is likely.
What’s your plan with SOL? Are you holding through the ups and downs, or taking profits? Tell me in the comments! 👇
#Solana #SOL #CryptoAnalysis #BinanceSquare #TradingTopics #ALTCOINUPDATE
$SOL
(SOL) Watch: Bullish Move or Just Noise? 🚀📉Solana has been the talk of the town lately! It’s moving up and down so fast that it's hard to tell what’s next.
🔹 Current Status: The price is showing high volatility. It pumps quickly, but then faces resistance and drops again.
🔹 My Analysis: We are seeing a lot of buying pressure, but the sellers are also very active. It’s a classic tug-of-war between bulls and bears.
🔹 Strategy: I’m keeping a close eye on the support levels. If it holds, we might see another leg up. If it breaks, a retest of lower levels is likely.
What’s your plan with SOL? Are you holding through the ups and downs, or taking profits? Tell me in the comments! 👇
#Solana #SOL #CryptoAnalysis #BinanceSquare #TradingTopics #ALTCOINUPDATE
(SOL) Watch: Bullish Move or Just Noise? 🚀📉Solana has been the talk of the town lately! It’s moving up and down so fast that it's hard to tell what’s next.
🔹 Current Status: The price is showing high volatility. It pumps quickly, but then faces resistance and drops again.
🔹 My Analysis: We are seeing a lot of buying pressure, but the sellers are also very active. It’s a classic tug-of-war between bulls and bears.
🔹 Strategy: I’m keeping a close eye on the support levels. If it holds, we might see another leg up. If it breaks, a retest of lower levels is likely.
What’s your plan with SOL? Are you holding through the ups and downs, or taking profits? Tell me in the comments! 👇
#Solana #SOL #CryptoAnalysis #BinanceSquare #TradingTopics #ALTCOINUPDATE
1
132
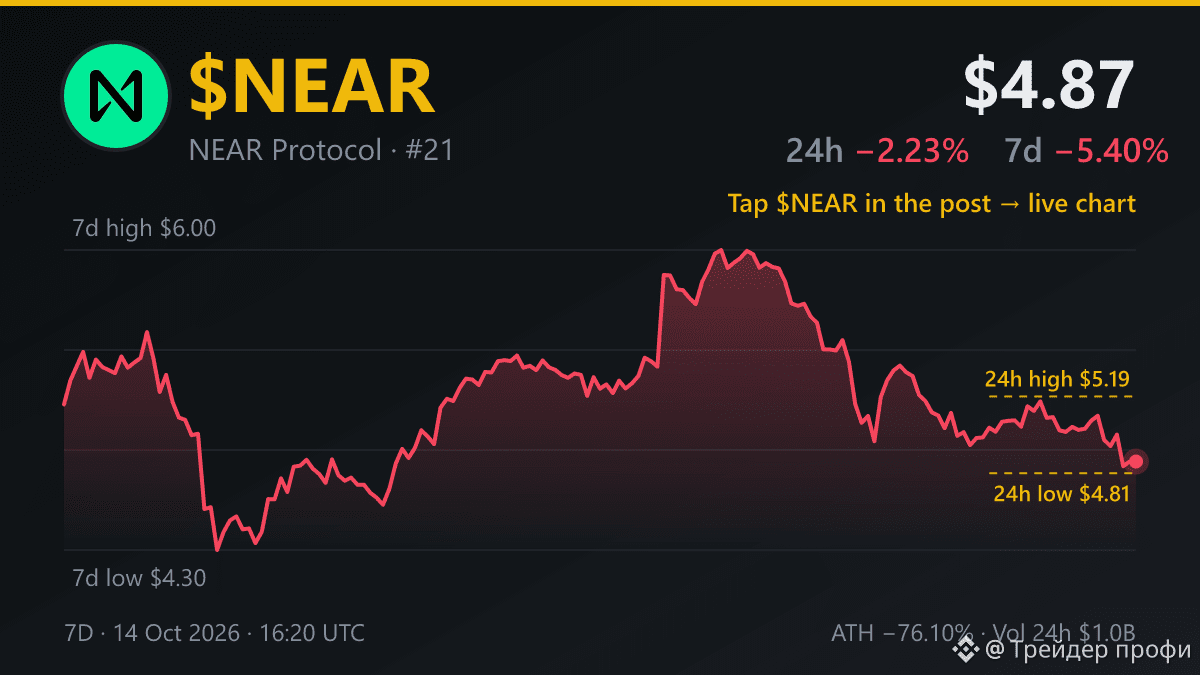
Apakah $NEAR mampu bertahan setelah koreksi tajam minggu ini? Pada ulasan sebelumnya di harga $5.8, saya menyoroti pentingnya memahami fundamental dasarnya. Hari ini data mencatat harganya merosot ke $4.87, menyusut -16.03% dari titik tersebut.
Kini pergerakan harganya bergerak di dalam kisaran 24 jam antara $4.81 sampai $5.19. Angka-angka ini memperlihatkan tekanan jual yang belum mereda secara signifikan di market.
Cek $NEAR langsung di chart untuk melihat level krusial ini.
Level berapa yang jadi batas aman Anda?
Bukan nasihat keuangan. DYOR.
#NEAR #TradingKripto #AltcoinUpdate
Apakah $NEAR mampu bertahan setelah koreksi tajam minggu ini? Pada ulasan sebelumnya di harga $5.8, saya menyoroti pentingnya memahami fundamental dasarnya. Hari ini data mencatat harganya merosot ke $4.87, menyusut -16.03% dari titik tersebut.
Kini pergerakan harganya bergerak di dalam kisaran 24 jam antara $4.81 sampai $5.19. Angka-angka ini memperlihatkan tekanan jual yang belum mereda secara signifikan di market.
Cek $NEAR langsung di chart untuk melihat level krusial ini.
Level berapa yang jadi batas aman Anda?
Bukan nasihat keuangan. DYOR.
#NEAR #TradingKripto #AltcoinUpdate
Kini pergerakan harganya bergerak di dalam kisaran 24 jam antara $4.81 sampai $5.19. Angka-angka ini memperlihatkan tekanan jual yang belum mereda secara signifikan di market.
Cek $NEAR langsung di chart untuk melihat level krusial ini.
Level berapa yang jadi batas aman Anda?
Bukan nasihat keuangan. DYOR.
#NEAR #TradingKripto #AltcoinUpdate
36

MYX Finance: Is This a Bullish Breakout?🪴
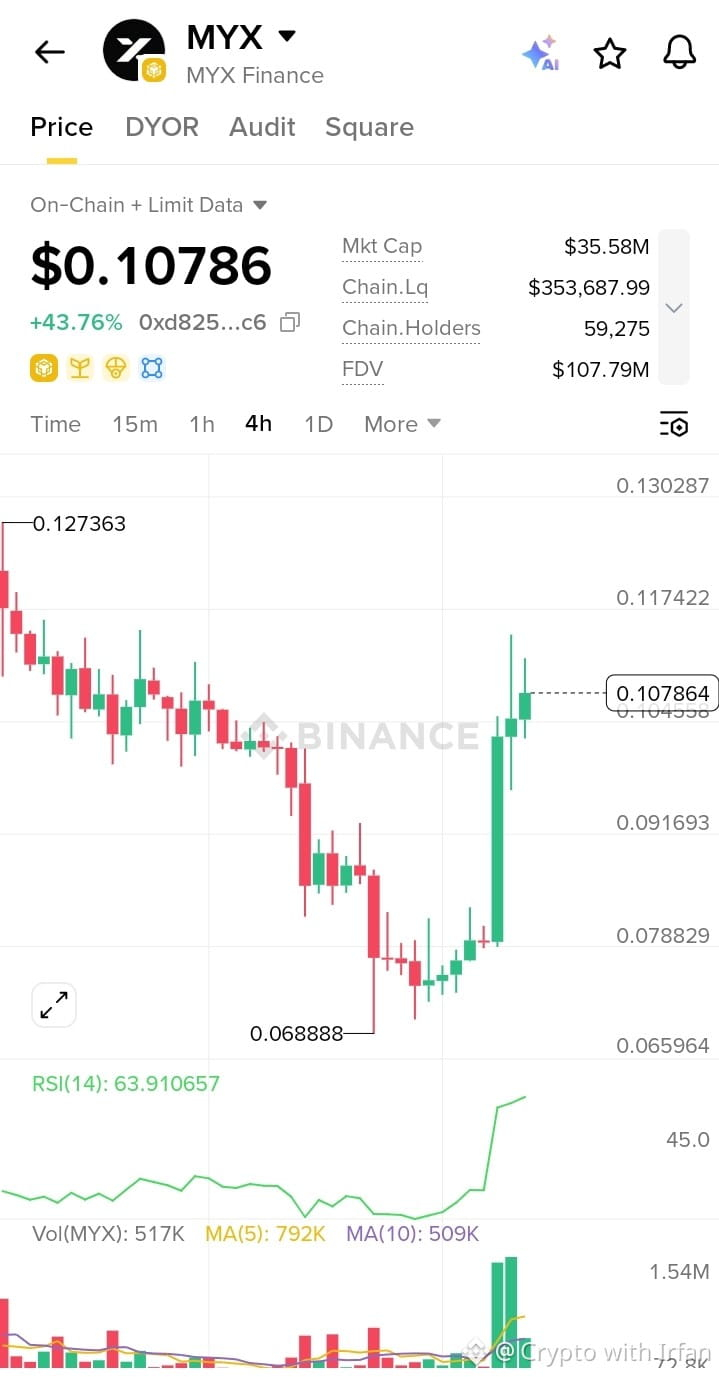
$MYX is showing incredible momentum! The price is currently trading at 0.10786, reflecting a significant increase of 43.76%.
Entry: 0.10000 – 0.10500
Stop-Loss : 0.09000
Take-Profit : 0.12000 and 0.12700
The RSI is at 63.91, signaling strong buying pressure. However, remember to wait for a market retest before entering your trade and always maintain a 1:2 risk-to-reward ratio. Avoid rushing into trades!
Do you think MYX will go higher or pull back? Let me know in the comments! 👇
#MYX #CryptoSignals #TechnicalAnalysis #AltcoinUpdate
{alpha}(560xd82544bf0dfe8385ef8fa34d67e6e4940cc63e16)
MYX Finance: Is This a Bullish Breakout?🪴
$MYX is showing incredible momentum! The price is currently trading at 0.10786, reflecting a significant increase of 43.76%.
Entry: 0.10000 – 0.10500
Stop-Loss : 0.09000
Take-Profit : 0.12000 and 0.12700
The RSI is at 63.91, signaling strong buying pressure. However, remember to wait for a market retest before entering your trade and always maintain a 1:2 risk-to-reward ratio. Avoid rushing into trades!
Do you think MYX will go higher or pull back? Let me know in the comments! 👇
#MYX #CryptoSignals #TechnicalAnalysis #AltcoinUpdate
$MYX is showing incredible momentum! The price is currently trading at 0.10786, reflecting a significant increase of 43.76%.
Entry: 0.10000 – 0.10500
Stop-Loss : 0.09000
Take-Profit : 0.12000 and 0.12700
The RSI is at 63.91, signaling strong buying pressure. However, remember to wait for a market retest before entering your trade and always maintain a 1:2 risk-to-reward ratio. Avoid rushing into trades!
Do you think MYX will go higher or pull back? Let me know in the comments! 👇
#MYX #CryptoSignals #TechnicalAnalysis #AltcoinUpdate
1
251

·
--
$ZEC JUST ACTIVATED A NEW PRIVACY ENGINE — ZAKURA IS HERE 🔥
Zcash's new Zakura client is now live, designed to push shielded transaction throughput from ~1 TPS to a target of 50,000 TPS — a scale comparable to traditional payment networks like Visa. No hard fork required, just a client upgrade for node operators.
$ZEC has been among the stronger altcoins recently, and this privacy + scalability narrative adds a fresh catalyst. But real-world performance under load and regulatory pushback remain open questions. Are you betting on privacy coins regaining traction or staying on the sidelines?
Not financial advice. Always manage your risk.
#ZEC #PrivacyBlockchain #AltcoinUpdate #Scalability
🔥
$ZEC JUST ACTIVATED A NEW PRIVACY ENGINE — ZAKURA IS HERE 🔥
Zcash's new Zakura client is now live, designed to push shielded transaction throughput from ~1 TPS to a target of 50,000 TPS — a scale comparable to traditional payment networks like Visa. No hard fork required, just a client upgrade for node operators.
$ZEC has been among the stronger altcoins recently, and this privacy + scalability narrative adds a fresh catalyst. But real-world performance under load and regulatory pushback remain open questions. Are you betting on privacy coins regaining traction or staying on the sidelines?
Not financial advice. Always manage your risk.
#ZEC #PrivacyBlockchain #AltcoinUpdate #Scalability
🔥
Zcash's new Zakura client is now live, designed to push shielded transaction throughput from ~1 TPS to a target of 50,000 TPS — a scale comparable to traditional payment networks like Visa. No hard fork required, just a client upgrade for node operators.
$ZEC has been among the stronger altcoins recently, and this privacy + scalability narrative adds a fresh catalyst. But real-world performance under load and regulatory pushback remain open questions. Are you betting on privacy coins regaining traction or staying on the sidelines?
Not financial advice. Always manage your risk.
#ZEC #PrivacyBlockchain #AltcoinUpdate #Scalability
🔥

121
Көбірек контент көру үшін кіріңіз
Binance Square платформасында әлемдік криптоқоғамдастыққа қосылыңыз
⚡️ Криптовалюта туралы ең соңғы және пайдалы ақпаратты алыңыз.
💬 Әлемдегі ең ірі криптобиржаның сеніміне ие.
👍 Расталған авторлардың нақты пікірлерін табыңыз.
Электрондық пошта/телефон нөмірі
Трендтегі тақырыптар
1
#CanBTCReboundAfterFallingBelow60K?
439,213 рет көрілді
1,867 адам талқылап жатыр
2
#GlobalStocksFaceLongestLosingStreakSince2023
148,467 рет көрілді
1,302 адам талқылап жатыр
3
#BlackRockIBITPostsRecord$541MSingleDayOutflow
4,598 рет көрілді
41 адам талқылап жатыр
4
#AnthropicPlungesTowardIPOPriceonDay2
71,485 рет көрілді
731 адам талқылап жатыр
5
#TwentyOneCapitalAdds172.25BTC
22,355 рет көрілді
264 адам талқылап жатыр
6
#HKBillWouldExcludeTokenizedDepositsFromVirtualAssets
2,539 рет көрілді
26 адам талқылап жатыр
7
#BNBDropsBelow540USDTWith8.46%DailyDecline
41,732 рет көрілді
362 адам талқылап жатыр
8
#HKBillProposesHK$100KFineForUnauthorizedCryptoTitles
1,455 рет көрілді
19 адам талқылап жатыр
9
#BitMineFaces$10.1BUnrealizedETHLoss
2,623 рет көрілді
25 адам талқылап жатыр
10
#StrategyReports$35BNetReserves
2,315 рет көрілді
18 адам талқылап жатыр