
#solana
solana
162.3M рет көрілді
275,730 адам талқылап жатыр
Қызу саудада
Ең соңғы

·
--
$SOL
Seguimos acumulando $SOL en estas caídas tan brutales que está teniendo el mercado
Estoy buscando posesionarme aplicando DCA compras periódicas baje o suba el precio de #solana
$SOL
Seguimos acumulando $SOL en estas caídas tan brutales que está teniendo el mercado
Estoy buscando posesionarme aplicando DCA compras periódicas baje o suba el precio de #solana
Seguimos acumulando $SOL en estas caídas tan brutales que está teniendo el mercado
Estoy buscando posesionarme aplicando DCA compras periódicas baje o suba el precio de #solana
470

Everyone has a different $SOL target for 2027. $150, $250 or even $400? 👀
But smart investors are watching more than price predictions. 👇
🔹 No fixed maximum supply
🔹 New SOL issued through staking rewards 🔹 Inflation declines 15% annually
🔹 50% of base transaction fees are burned
The real question: Can Solana's growing demand offset its new token supply?
Because network adoption doesn't automatically translate into token price growth.
💎 Watch the supply. Measure the demand.
What's your realistic $SOL target for 2027 — and what's your biggest reason?
#sol #solana #Crypto
Everyone has a different $SOL target for 2027. $150, $250 or even $400? 👀
But smart investors are watching more than price predictions. 👇
🔹 No fixed maximum supply
🔹 New SOL issued through staking rewards 🔹 Inflation declines 15% annually
🔹 50% of base transaction fees are burned
The real question: Can Solana's growing demand offset its new token supply?
Because network adoption doesn't automatically translate into token price growth.
💎 Watch the supply. Measure the demand.
What's your realistic $SOL target for 2027 — and what's your biggest reason?
#sol #solana #Crypto
But smart investors are watching more than price predictions. 👇
🔹 No fixed maximum supply
🔹 New SOL issued through staking rewards 🔹 Inflation declines 15% annually
🔹 50% of base transaction fees are burned
The real question: Can Solana's growing demand offset its new token supply?
Because network adoption doesn't automatically translate into token price growth.
💎 Watch the supply. Measure the demand.
What's your realistic $SOL target for 2027 — and what's your biggest reason?
#sol #solana #Crypto

2
1.2k

·
--
#Solana если смотреть на месячные свечи то следующая остановка 59$-38$-21$ и 12$ за $SOL
{spot}(SOLUSDT)
а как вы думаете мне нравится цифра 12 и меньше 😁😁😁😉😉😉👍👍👍
#Solana если смотреть на месячные свечи то следующая остановка 59$-38$-21$ и 12$ за $SOL
а как вы думаете мне нравится цифра 12 и меньше 😁😁😁😉😉😉👍👍👍
а как вы думаете мне нравится цифра 12 и меньше 😁😁😁😉😉😉👍👍👍
Feed-Creator-327851e85:
Иди нах михаил петух
1
1
1.8k

·
--
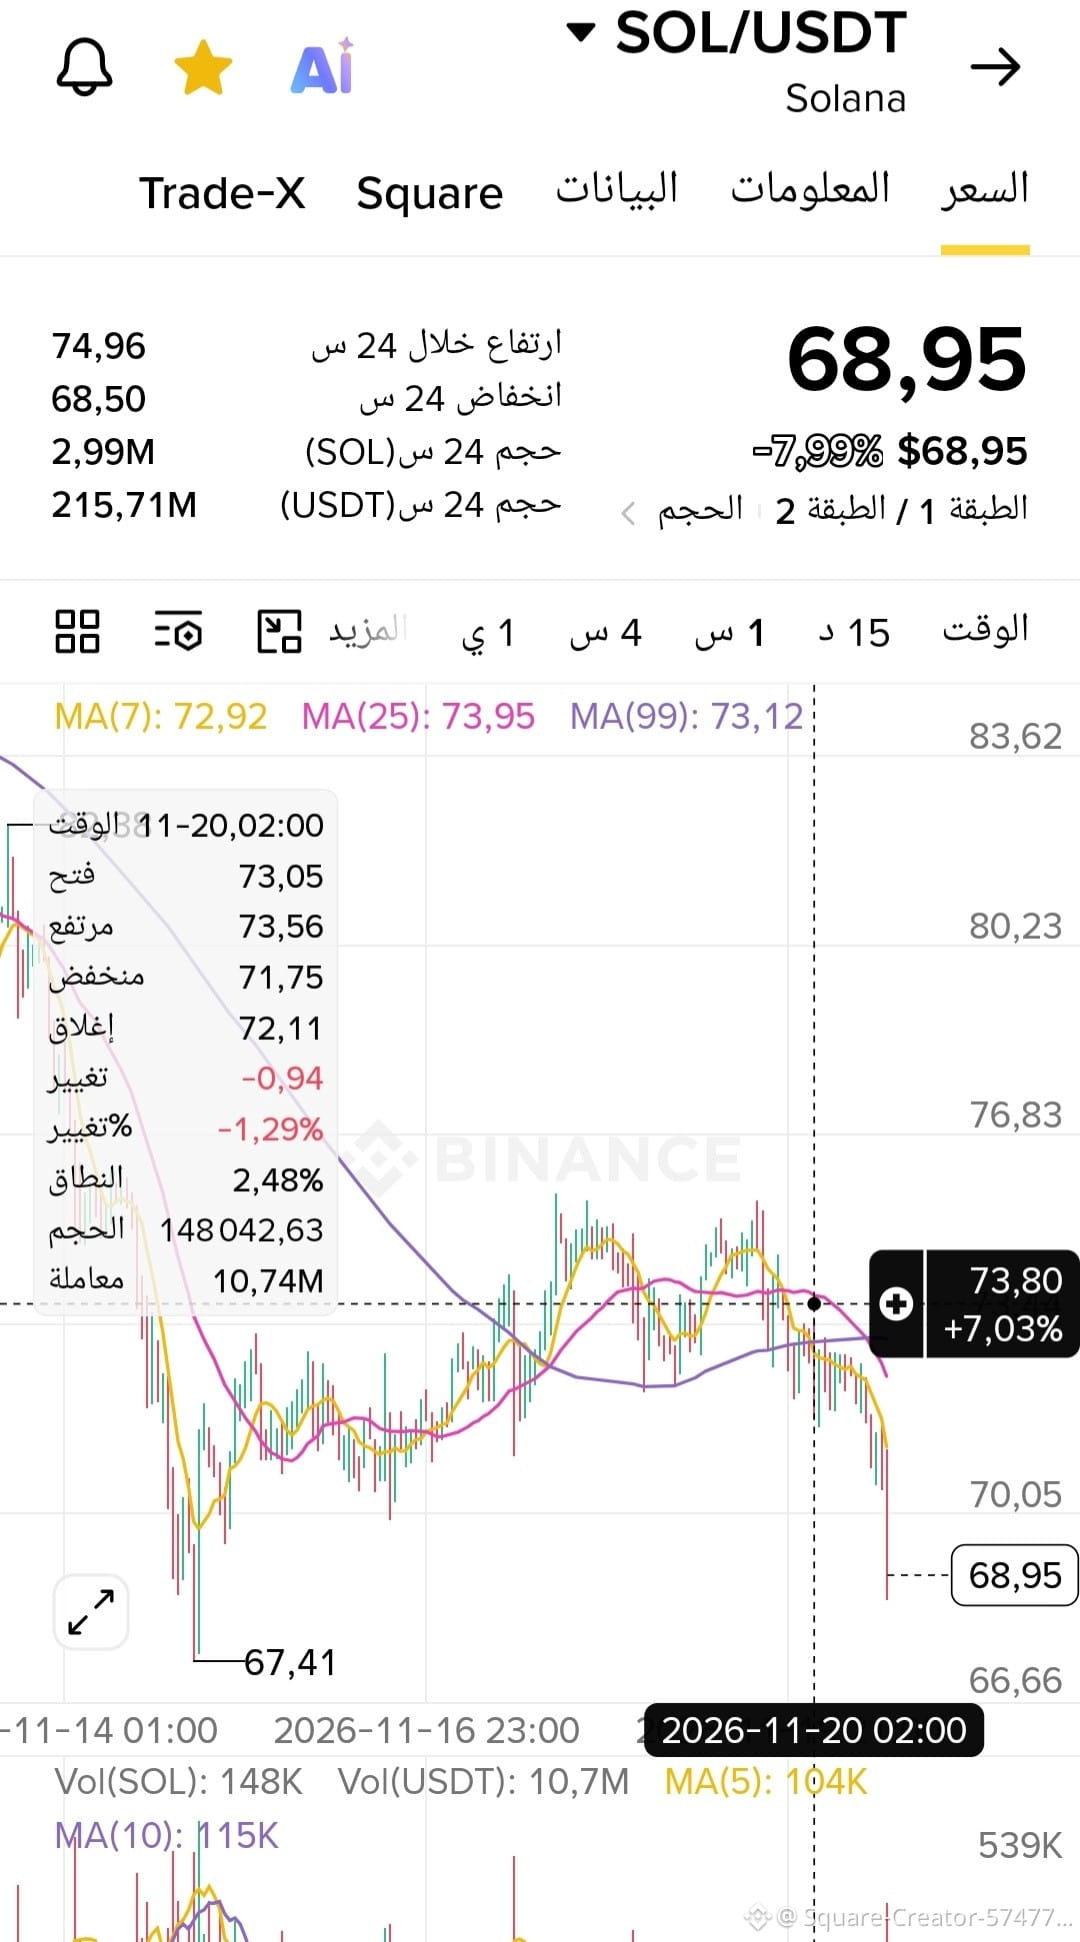
سولانا ($SOL ): تراجع إلى 68.95$ ومراقبة منطقة الارتداد
السعر يتداول حالياً عند 68.95$ (-7.99%) بعد كسر المتوسطات المتحركة والضغط نحو القاع السابق عند 67.41$.
منطقة الشراء / الدعم: 67.40$– 68.50$ (بالقرب من أدنى سعر خلال 24 ساعة عند 68.50$ والقاع الرئيسي عند 67.41$)
هدف البيع المقترح (المقاومة): نطاق 72.90$– 73.95$ (مستويات المتوسطات المتحركة MA7 وMA99 وMA25)
نسبة الربح المتوقعة: تتراوح بين +5.7% (من السعر الحالي إلى 72.90$) و+9.7% (في حال الدخول قرب 67.40$ واستهداف 73.95$)
في التداول الفوري (Spot)، مراقبة ثبات السعر فوق الدعم قبل الدخول وحساب العائد مسبقاً يحكم القرار بعيداً عن التسرع.
#Solana #SOL #Binance inanceSquare #SpotTrading. #تحليل_فني #كريبتو
سولانا ($SOL ): تراجع إلى 68.95$ ومراقبة منطقة الارتداد
السعر يتداول حالياً عند 68.95$ (-7.99%) بعد كسر المتوسطات المتحركة والضغط نحو القاع السابق عند 67.41$.
منطقة الشراء / الدعم: 67.40$– 68.50$ (بالقرب من أدنى سعر خلال 24 ساعة عند 68.50$ والقاع الرئيسي عند 67.41$)
هدف البيع المقترح (المقاومة): نطاق 72.90$– 73.95$ (مستويات المتوسطات المتحركة MA7 وMA99 وMA25)
نسبة الربح المتوقعة: تتراوح بين +5.7% (من السعر الحالي إلى 72.90$) و+9.7% (في حال الدخول قرب 67.40$ واستهداف 73.95$)
في التداول الفوري (Spot)، مراقبة ثبات السعر فوق الدعم قبل الدخول وحساب العائد مسبقاً يحكم القرار بعيداً عن التسرع.
#Solana #SOL #Binance inanceSquare #SpotTrading. #تحليل_فني #كريبتو
السعر يتداول حالياً عند 68.95$ (-7.99%) بعد كسر المتوسطات المتحركة والضغط نحو القاع السابق عند 67.41$.
منطقة الشراء / الدعم: 67.40$– 68.50$ (بالقرب من أدنى سعر خلال 24 ساعة عند 68.50$ والقاع الرئيسي عند 67.41$)
هدف البيع المقترح (المقاومة): نطاق 72.90$– 73.95$ (مستويات المتوسطات المتحركة MA7 وMA99 وMA25)
نسبة الربح المتوقعة: تتراوح بين +5.7% (من السعر الحالي إلى 72.90$) و+9.7% (في حال الدخول قرب 67.40$ واستهداف 73.95$)
في التداول الفوري (Spot)، مراقبة ثبات السعر فوق الدعم قبل الدخول وحساب العائد مسبقاً يحكم القرار بعيداً عن التسرع.
#Solana #SOL #Binance inanceSquare #SpotTrading. #تحليل_فني #كريبتو
2
1.5k
·
--
#Solana друзья помните я две недели назад писала что $SOL
{future}(SOLUSDT)
упадёт до 70$, мне многое писали что я ничего не понимаю и вот я сейчас снова пишу что монета упадёт ниже 60$, да конечно будут прыжки 2-3$$ в верх и 3-5$$ вниз примерно. и так почти до конца 2026 года, а дальше буду смотреть ну а те кто в шорт зашол это сейчас самый лучший вариант. 🤝🤝🤝👍👍👍💯💯💯🛩🛩🛩🔥🔥🔥
#Solana друзья помните я две недели назад писала что $SOL
упадёт до 70$, мне многое писали что я ничего не понимаю и вот я сейчас снова пишу что монета упадёт ниже 60$, да конечно будут прыжки 2-3$$ в верх и 3-5$$ вниз примерно. и так почти до конца 2026 года, а дальше буду смотреть ну а те кто в шорт зашол это сейчас самый лучший вариант. 🤝🤝🤝👍👍👍💯💯💯🛩🛩🛩🔥🔥🔥
упадёт до 70$, мне многое писали что я ничего не понимаю и вот я сейчас снова пишу что монета упадёт ниже 60$, да конечно будут прыжки 2-3$$ в верх и 3-5$$ вниз примерно. и так почти до конца 2026 года, а дальше буду смотреть ну а те кто в шорт зашол это сейчас самый лучший вариант. 🤝🤝🤝👍👍👍💯💯💯🛩🛩🛩🔥🔥🔥
1
2k

·
--
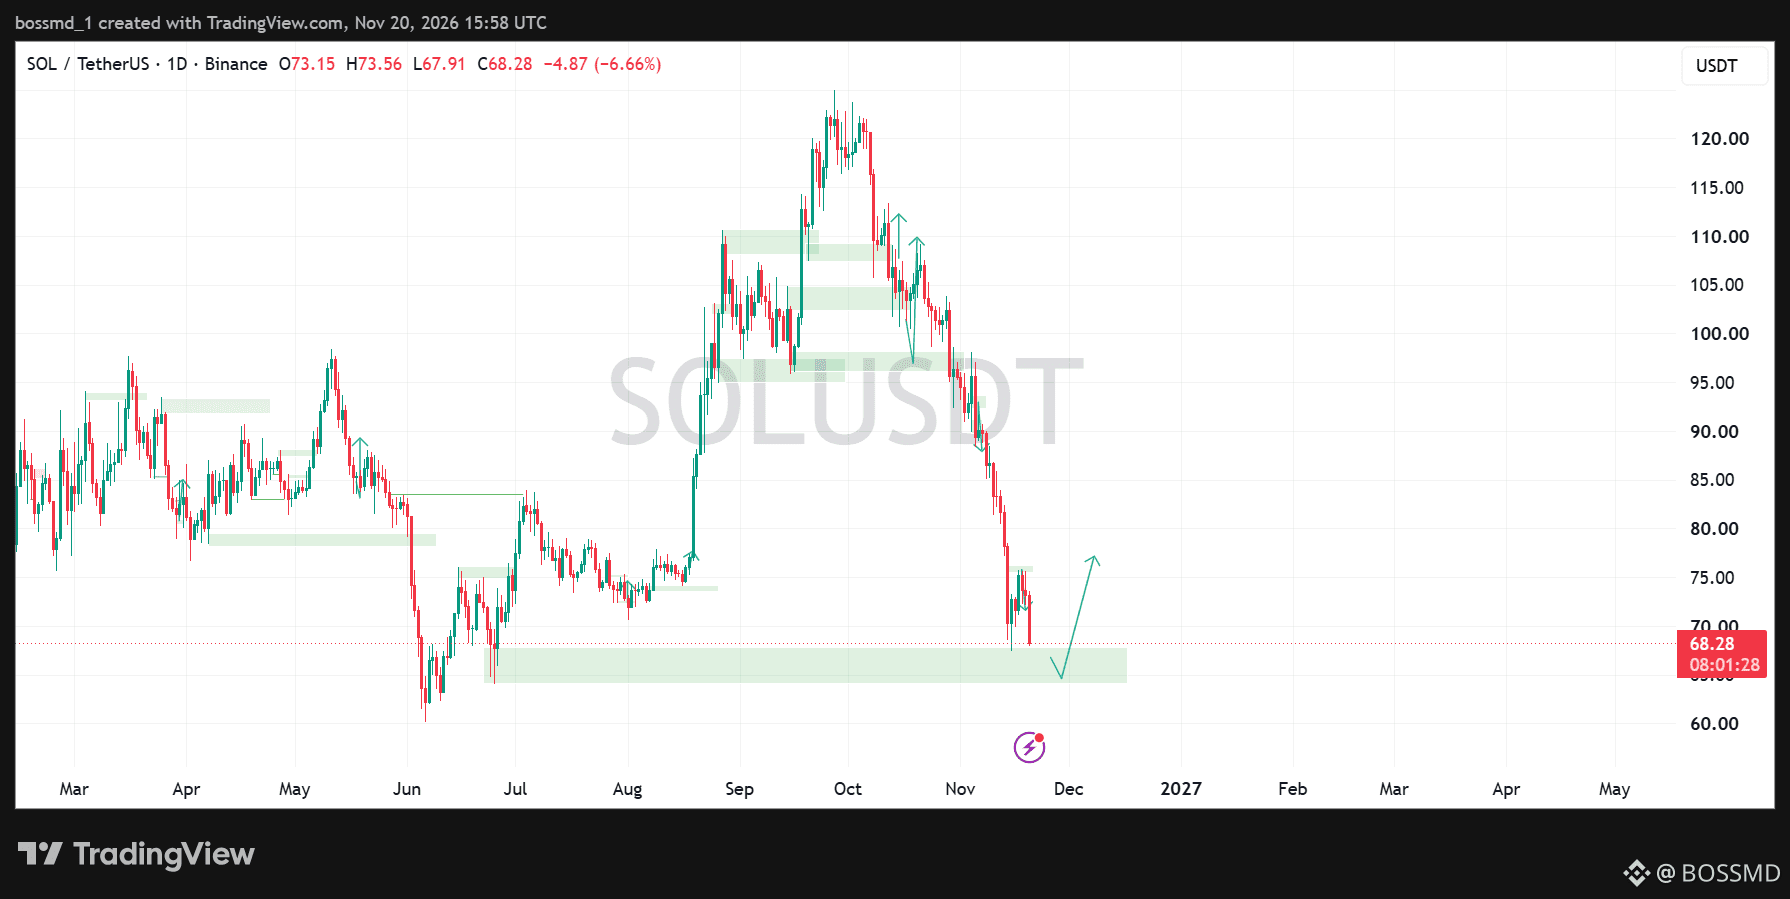
#solana is facing strong selling pressure after dropping sharply from its recent highs above $120.
Price is now approaching a major support zone around $64–$67.
This is an important area to watch. If buyers defend this zone, we could see a relief bounce toward $75–$77. However, a breakdown below support could bring further downside.
For now, I’m watching how $SOL reacts at this demand zone. Bulls need to step in if a recovery is going to happen.
#solana is facing strong selling pressure after dropping sharply from its recent highs above $120.
Price is now approaching a major support zone around $64–$67.
This is an important area to watch. If buyers defend this zone, we could see a relief bounce toward $75–$77. However, a breakdown below support could bring further downside.
For now, I’m watching how $SOL reacts at this demand zone. Bulls need to step in if a recovery is going to happen.
Price is now approaching a major support zone around $64–$67.
This is an important area to watch. If buyers defend this zone, we could see a relief bounce toward $75–$77. However, a breakdown below support could bring further downside.
For now, I’m watching how $SOL reacts at this demand zone. Bulls need to step in if a recovery is going to happen.
2
3.2k


Мақала
🔥 SOLANA تحت الحصار! هل تستعد الحيتان لانهيار جديد أم لعملية تجميع كبرى🚨 سولانا عند مفترق طرق... هل الحيتان تستعد للشراء أم أن الهبوط لم ينتهِ بعد؟
سعر SOL يقترب من منطقة حساسة، وبعد موجة تراجع واضحة أصبح السؤال: هل نحن أمام فرصة تجميع جديدة أم أن السوق يستعد لاختبار أسعار أقل؟
تابعت حركة السعر والتدفقات المالية، وهناك إشارات متضاربة تستحق الانتباه.
📉 ماذا يحدث في السوق؟
حسب بيانات 20 نوفمبر، تراجع SOL جاء بالتزامن مع ضعف سوق العملات الرقمية عموماً، وليس بسبب عامل خاص بسولانا وحدها.
هناك أيضاً تحركات كبيرة لافتة: تم نقل نحو 2.31 مليون SOL، بقيمة تقارب 169 مليون دولار، إلى Coinbase Prime. هذا التحرك أثار مخاوف المتداولين، لكن لا يمكن اعتباره دليلاً مؤكداً على البيع، فقد يكون متعلقاً بالحفظ أو التداول المؤسسي.
في المقابل، شهدت صناديق Solana الاستثمارية عودة تدفقات إيجابية في 17 نوفمبر، وهو تطور يستحق المتابعة، لكنه لا يكفي وحده لإعلان انتهاء الهبوط.
📊 ماذا يقول شارت الساعة؟
السعر في الصورة: 72.11 دولار.
المتوسطات المتحركة:
- EMA7: 72.50 دولار.
- EMA25: 73.07 دولار.
- EMA99: 73.65 دولار.
مؤشر RSI14 عند 41.02، بينما MACD ما زال سلبياً.
بمعنى آخر، المشترون يحاولون الدفاع عن السعر، لكنهم لم يستعيدوا السيطرة حتى الآن. السعر ما زال تحت المتوسطات الثلاثة، وهذا يجعلني حذراً من اعتبار أي ارتداد قصير بداية صعود جديد.
🐋 ماذا تكشف حركة التدفقات المالية؟
هنا توجد نقطة مثيرة للاهتمام.
حسب بيانات التدفق المالي الظاهرة في الصورة:
- إجمالي الشراء: 505180 SOL.
- إجمالي البيع: 456722 SOL.
- صافي التدفق: +48458 SOL تقريباً.
حتى الطلبات الكبيرة سجلت صافي شراء إيجابياً خلال الفترة المعروضة.
لكن في المقابل، يظهر تدفق الحيتان خلال خمسة أيام بصافي سلبي قدره 15946 SOL.
هذا يعني أن هناك اختلافاً بين التدفق اليومي والتدفق الأكبر خلال عدة أيام. لذلك لا أعتبر الأرقام وحدها إشارة مؤكدة للتجميع أو لانعكاس الاتجاه.
🎯 أهم مناطق المراقبة
الدعم:
- 71.53 دولار: أهم دعم قريب ظاهر على الشارت.
- 70.00 دولار: منطقة نفسية مهمة.
- 67.55 دولار: منطقة دعم أوسع في حال استمرار الضغط.
المقاومة:
- 72.50 دولار: أول حاجز أمام المشترين.
- 73.10 دولار: مقاومة مهمة.
- 73.65 دولار: مستوى تأكيد أولي لتحسن الاتجاه.
- 75.57 دولار: قمة الحركة الأخيرة.
⚡ سيناريوهات التداول القادمة
🟢 السيناريو الصاعد:
إذا حافظت SOL على منطقة 71.53 دولار، واستعادت 73.65 دولار بإغلاق ساعة واضح مع تحسن حجم التداول، فقد نرى محاولة للوصول إلى 75.57 دولار، ثم اختبار منطقة 76.40 دولار.
🔴 السيناريو الهابط:
إذا فشل السعر في استعادة 73.10 إلى 73.65 دولار، ثم أغلق أسفل 71.53 دولار، فقد نشاهد امتداد الهبوط نحو 70 دولاراً، وبعدها 67.55 دولار.
💡 كيف أتعامل مع SOL حالياً؟
بالنسبة للتداول الفوري Spot، لا أرى أن مطاردة السعر في هذه المنطقة قرار مناسب.
أفضل مراقبة منطقة 71.50 دولار وانتظار ظهور ارتداد حقيقي، أو انتظار اختراق 73.65 دولار وإعادة اختبارها بنجاح قبل التفكير في الدخول.
أما الاستثمار طويل الأجل، فمن الأفضل تقسيم رأس المال إلى دفعات وعدم وضع كامل السيولة في عملية شراء واحدة. انخفاض السعر لا يعني بالضرورة أن القاع قد تحقق.
🔥 خلاصة قراءتي للسوق:
أنا أميل للحذر في SOL خلال 24 إلى 72 ساعة القادمة. الاتجاه على الساعة ما زال ضعيفاً، لكن التدفقات الشرائية الظاهرة تمنعني من تجاهل احتمال حدوث ارتداد.
بالنسبة لي، مستوى 71.53 دولار هو الاختبار الأول للمشترين، و73.65 دولار هو المستوى الذي أريد رؤية السعر يستعيده حتى تتغير الصورة الفنية.
السوق لا يكافئ من يتسرع، بل من يعرف متى ينتظر ومتى يتحرك.
والآن أريد رأيكم: هل تعتقدون أن سولانا ستعود فوق 75 دولاراً، أم أن زيارة 70 وحتى 67 دولاراً أصبحت أقرب؟
#solana #sol $SOL #bitcoin #crypto #BinanceSquare
🔥 SOLANA تحت الحصار! هل تستعد الحيتان لانهيار جديد أم لعملية تجميع كبرى
🚨 سولانا عند مفترق طرق... هل الحيتان تستعد للشراء أم أن الهبوط لم ينتهِ بعد؟
سعر SOL يقترب من منطقة حساسة، وبعد موجة تراجع واضحة أصبح السؤال: هل نحن أمام فرصة تجميع جديدة أم أن السوق يستعد لاختبار أسعار أقل؟
تابعت حركة السعر والتدفقات المالية، وهناك إشارات متضاربة تستحق الانتباه.
📉 ماذا يحدث في السوق؟
حسب بيانات 20 نوفمبر، تراجع SOL جاء بالتزامن مع ضعف سوق العملات الرقمية عموماً، وليس بسبب عامل خاص بسولانا وحدها.
هناك أيضاً تحركات كبيرة لافتة: تم نقل نحو 2.31 مليون SOL، بقيمة تقارب 169 مليون دولار، إلى Coinbase Prime. هذا التحرك أثار مخاوف المتداولين، لكن لا يمكن اعتباره دليلاً مؤكداً على البيع، فقد يكون متعلقاً بالحفظ أو التداول المؤسسي.
في المقابل، شهدت صناديق Solana الاستثمارية عودة تدفقات إيجابية في 17 نوفمبر، وهو تطور يستحق المتابعة، لكنه لا يكفي وحده لإعلان انتهاء الهبوط.
📊 ماذا يقول شارت الساعة؟
السعر في الصورة: 72.11 دولار.
المتوسطات المتحركة:
- EMA7: 72.50 دولار.
- EMA25: 73.07 دولار.
- EMA99: 73.65 دولار.
مؤشر RSI14 عند 41.02، بينما MACD ما زال سلبياً.
بمعنى آخر، المشترون يحاولون الدفاع عن السعر، لكنهم لم يستعيدوا السيطرة حتى الآن. السعر ما زال تحت المتوسطات الثلاثة، وهذا يجعلني حذراً من اعتبار أي ارتداد قصير بداية صعود جديد.
🐋 ماذا تكشف حركة التدفقات المالية؟
هنا توجد نقطة مثيرة للاهتمام.
حسب بيانات التدفق المالي الظاهرة في الصورة:
- إجمالي الشراء: 505180 SOL.
- إجمالي البيع: 456722 SOL.
- صافي التدفق: +48458 SOL تقريباً.
حتى الطلبات الكبيرة سجلت صافي شراء إيجابياً خلال الفترة المعروضة.
لكن في المقابل، يظهر تدفق الحيتان خلال خمسة أيام بصافي سلبي قدره 15946 SOL.
هذا يعني أن هناك اختلافاً بين التدفق اليومي والتدفق الأكبر خلال عدة أيام. لذلك لا أعتبر الأرقام وحدها إشارة مؤكدة للتجميع أو لانعكاس الاتجاه.
🎯 أهم مناطق المراقبة
الدعم:
- 71.53 دولار: أهم دعم قريب ظاهر على الشارت.
- 70.00 دولار: منطقة نفسية مهمة.
- 67.55 دولار: منطقة دعم أوسع في حال استمرار الضغط.
المقاومة:
- 72.50 دولار: أول حاجز أمام المشترين.
- 73.10 دولار: مقاومة مهمة.
- 73.65 دولار: مستوى تأكيد أولي لتحسن الاتجاه.
- 75.57 دولار: قمة الحركة الأخيرة.
⚡ سيناريوهات التداول القادمة
🟢 السيناريو الصاعد:
إذا حافظت SOL على منطقة 71.53 دولار، واستعادت 73.65 دولار بإغلاق ساعة واضح مع تحسن حجم التداول، فقد نرى محاولة للوصول إلى 75.57 دولار، ثم اختبار منطقة 76.40 دولار.
🔴 السيناريو الهابط:
إذا فشل السعر في استعادة 73.10 إلى 73.65 دولار، ثم أغلق أسفل 71.53 دولار، فقد نشاهد امتداد الهبوط نحو 70 دولاراً، وبعدها 67.55 دولار.
💡 كيف أتعامل مع SOL حالياً؟
بالنسبة للتداول الفوري Spot، لا أرى أن مطاردة السعر في هذه المنطقة قرار مناسب.
أفضل مراقبة منطقة 71.50 دولار وانتظار ظهور ارتداد حقيقي، أو انتظار اختراق 73.65 دولار وإعادة اختبارها بنجاح قبل التفكير في الدخول.
أما الاستثمار طويل الأجل، فمن الأفضل تقسيم رأس المال إلى دفعات وعدم وضع كامل السيولة في عملية شراء واحدة. انخفاض السعر لا يعني بالضرورة أن القاع قد تحقق.
🔥 خلاصة قراءتي للسوق:
أنا أميل للحذر في SOL خلال 24 إلى 72 ساعة القادمة. الاتجاه على الساعة ما زال ضعيفاً، لكن التدفقات الشرائية الظاهرة تمنعني من تجاهل احتمال حدوث ارتداد.
بالنسبة لي، مستوى 71.53 دولار هو الاختبار الأول للمشترين، و73.65 دولار هو المستوى الذي أريد رؤية السعر يستعيده حتى تتغير الصورة الفنية.
السوق لا يكافئ من يتسرع، بل من يعرف متى ينتظر ومتى يتحرك.
والآن أريد رأيكم: هل تعتقدون أن سولانا ستعود فوق 75 دولاراً، أم أن زيارة 70 وحتى 67 دولاراً أصبحت أقرب؟
#solana #sol $SOL #bitcoin #crypto #BinanceSquare
سعر SOL يقترب من منطقة حساسة، وبعد موجة تراجع واضحة أصبح السؤال: هل نحن أمام فرصة تجميع جديدة أم أن السوق يستعد لاختبار أسعار أقل؟
تابعت حركة السعر والتدفقات المالية، وهناك إشارات متضاربة تستحق الانتباه.
📉 ماذا يحدث في السوق؟
حسب بيانات 20 نوفمبر، تراجع SOL جاء بالتزامن مع ضعف سوق العملات الرقمية عموماً، وليس بسبب عامل خاص بسولانا وحدها.
هناك أيضاً تحركات كبيرة لافتة: تم نقل نحو 2.31 مليون SOL، بقيمة تقارب 169 مليون دولار، إلى Coinbase Prime. هذا التحرك أثار مخاوف المتداولين، لكن لا يمكن اعتباره دليلاً مؤكداً على البيع، فقد يكون متعلقاً بالحفظ أو التداول المؤسسي.
في المقابل، شهدت صناديق Solana الاستثمارية عودة تدفقات إيجابية في 17 نوفمبر، وهو تطور يستحق المتابعة، لكنه لا يكفي وحده لإعلان انتهاء الهبوط.
📊 ماذا يقول شارت الساعة؟
السعر في الصورة: 72.11 دولار.
المتوسطات المتحركة:
- EMA7: 72.50 دولار.
- EMA25: 73.07 دولار.
- EMA99: 73.65 دولار.
مؤشر RSI14 عند 41.02، بينما MACD ما زال سلبياً.
بمعنى آخر، المشترون يحاولون الدفاع عن السعر، لكنهم لم يستعيدوا السيطرة حتى الآن. السعر ما زال تحت المتوسطات الثلاثة، وهذا يجعلني حذراً من اعتبار أي ارتداد قصير بداية صعود جديد.
🐋 ماذا تكشف حركة التدفقات المالية؟
هنا توجد نقطة مثيرة للاهتمام.
حسب بيانات التدفق المالي الظاهرة في الصورة:
- إجمالي الشراء: 505180 SOL.
- إجمالي البيع: 456722 SOL.
- صافي التدفق: +48458 SOL تقريباً.
حتى الطلبات الكبيرة سجلت صافي شراء إيجابياً خلال الفترة المعروضة.
لكن في المقابل، يظهر تدفق الحيتان خلال خمسة أيام بصافي سلبي قدره 15946 SOL.
هذا يعني أن هناك اختلافاً بين التدفق اليومي والتدفق الأكبر خلال عدة أيام. لذلك لا أعتبر الأرقام وحدها إشارة مؤكدة للتجميع أو لانعكاس الاتجاه.
🎯 أهم مناطق المراقبة
الدعم:
- 71.53 دولار: أهم دعم قريب ظاهر على الشارت.
- 70.00 دولار: منطقة نفسية مهمة.
- 67.55 دولار: منطقة دعم أوسع في حال استمرار الضغط.
المقاومة:
- 72.50 دولار: أول حاجز أمام المشترين.
- 73.10 دولار: مقاومة مهمة.
- 73.65 دولار: مستوى تأكيد أولي لتحسن الاتجاه.
- 75.57 دولار: قمة الحركة الأخيرة.
⚡ سيناريوهات التداول القادمة
🟢 السيناريو الصاعد:
إذا حافظت SOL على منطقة 71.53 دولار، واستعادت 73.65 دولار بإغلاق ساعة واضح مع تحسن حجم التداول، فقد نرى محاولة للوصول إلى 75.57 دولار، ثم اختبار منطقة 76.40 دولار.
🔴 السيناريو الهابط:
إذا فشل السعر في استعادة 73.10 إلى 73.65 دولار، ثم أغلق أسفل 71.53 دولار، فقد نشاهد امتداد الهبوط نحو 70 دولاراً، وبعدها 67.55 دولار.
💡 كيف أتعامل مع SOL حالياً؟
بالنسبة للتداول الفوري Spot، لا أرى أن مطاردة السعر في هذه المنطقة قرار مناسب.
أفضل مراقبة منطقة 71.50 دولار وانتظار ظهور ارتداد حقيقي، أو انتظار اختراق 73.65 دولار وإعادة اختبارها بنجاح قبل التفكير في الدخول.
أما الاستثمار طويل الأجل، فمن الأفضل تقسيم رأس المال إلى دفعات وعدم وضع كامل السيولة في عملية شراء واحدة. انخفاض السعر لا يعني بالضرورة أن القاع قد تحقق.
🔥 خلاصة قراءتي للسوق:
أنا أميل للحذر في SOL خلال 24 إلى 72 ساعة القادمة. الاتجاه على الساعة ما زال ضعيفاً، لكن التدفقات الشرائية الظاهرة تمنعني من تجاهل احتمال حدوث ارتداد.
بالنسبة لي، مستوى 71.53 دولار هو الاختبار الأول للمشترين، و73.65 دولار هو المستوى الذي أريد رؤية السعر يستعيده حتى تتغير الصورة الفنية.
السوق لا يكافئ من يتسرع، بل من يعرف متى ينتظر ومتى يتحرك.
والآن أريد رأيكم: هل تعتقدون أن سولانا ستعود فوق 75 دولاراً، أم أن زيارة 70 وحتى 67 دولاراً أصبحت أقرب؟
#solana #sol $SOL #bitcoin #crypto #BinanceSquare
1
209

·
--
$SOL IS AT A CRITICAL TURNING POINT!
Solana is under heavy selling pressure, but deeply oversold conditions could trigger a sharp bounce.
🟢 Support: $67
🔴 Breakdown: $63 → $58
⚡ Resistance: $74 → $76
Bulls need to reclaim $74 to regain momentum. Until then, the risk remains high.
Is this a golden buying opportunity or another trap for bulls? 👀
#solana #TradingSignals
{spot}(SOLUSDT)
$SOL IS AT A CRITICAL TURNING POINT!
Solana is under heavy selling pressure, but deeply oversold conditions could trigger a sharp bounce.
🟢 Support: $67
🔴 Breakdown: $63 → $58
⚡ Resistance: $74 → $76
Bulls need to reclaim $74 to regain momentum. Until then, the risk remains high.
Is this a golden buying opportunity or another trap for bulls? 👀
#solana #TradingSignals
Solana is under heavy selling pressure, but deeply oversold conditions could trigger a sharp bounce.
🟢 Support: $67
🔴 Breakdown: $63 → $58
⚡ Resistance: $74 → $76
Bulls need to reclaim $74 to regain momentum. Until then, the risk remains high.
Is this a golden buying opportunity or another trap for bulls? 👀
#solana #TradingSignals
1
344

·
--
🚨 SOLANA ($SOL): IS A RECOVERY COMING?
Solana is facing selling pressure, with its price testing the $68–$70 support zone.
📈 Bullish scenario: If buyers defend this level, SOL could recover toward $75 and potentially $80.
📉 Bearish scenario: If support breaks, we could see $64 or even $60.
🔥 My Take: Solana still has long-term potential, but a strong recovery needs buying volume and a Bitcoin rebound.
What do you think? Will SOL bounce back or fall to $60 first
$SOL
#solana #sol #SolanaUSTD #solanAnalysis
🚨 SOLANA ($SOL ): IS A RECOVERY COMING?
Solana is facing selling pressure, with its price testing the $68–$70 support zone.
📈 Bullish scenario: If buyers defend this level, SOL could recover toward $75 and potentially $80.
📉 Bearish scenario: If support breaks, we could see $64 or even $60.
🔥 My Take: Solana still has long-term potential, but a strong recovery needs buying volume and a Bitcoin rebound.
What do you think? Will SOL bounce back or fall to $60 first
$SOL
#solana #sol #SolanaUSTD #solanAnalysis
Solana is facing selling pressure, with its price testing the $68–$70 support zone.
📈 Bullish scenario: If buyers defend this level, SOL could recover toward $75 and potentially $80.
📉 Bearish scenario: If support breaks, we could see $64 or even $60.
🔥 My Take: Solana still has long-term potential, but a strong recovery needs buying volume and a Bitcoin rebound.
What do you think? Will SOL bounce back or fall to $60 first
$SOL
#solana #sol #SolanaUSTD #solanAnalysis
1
426

Мақала
BITCOIN | 2026-11-20 15:14 UTC$SOL #solana
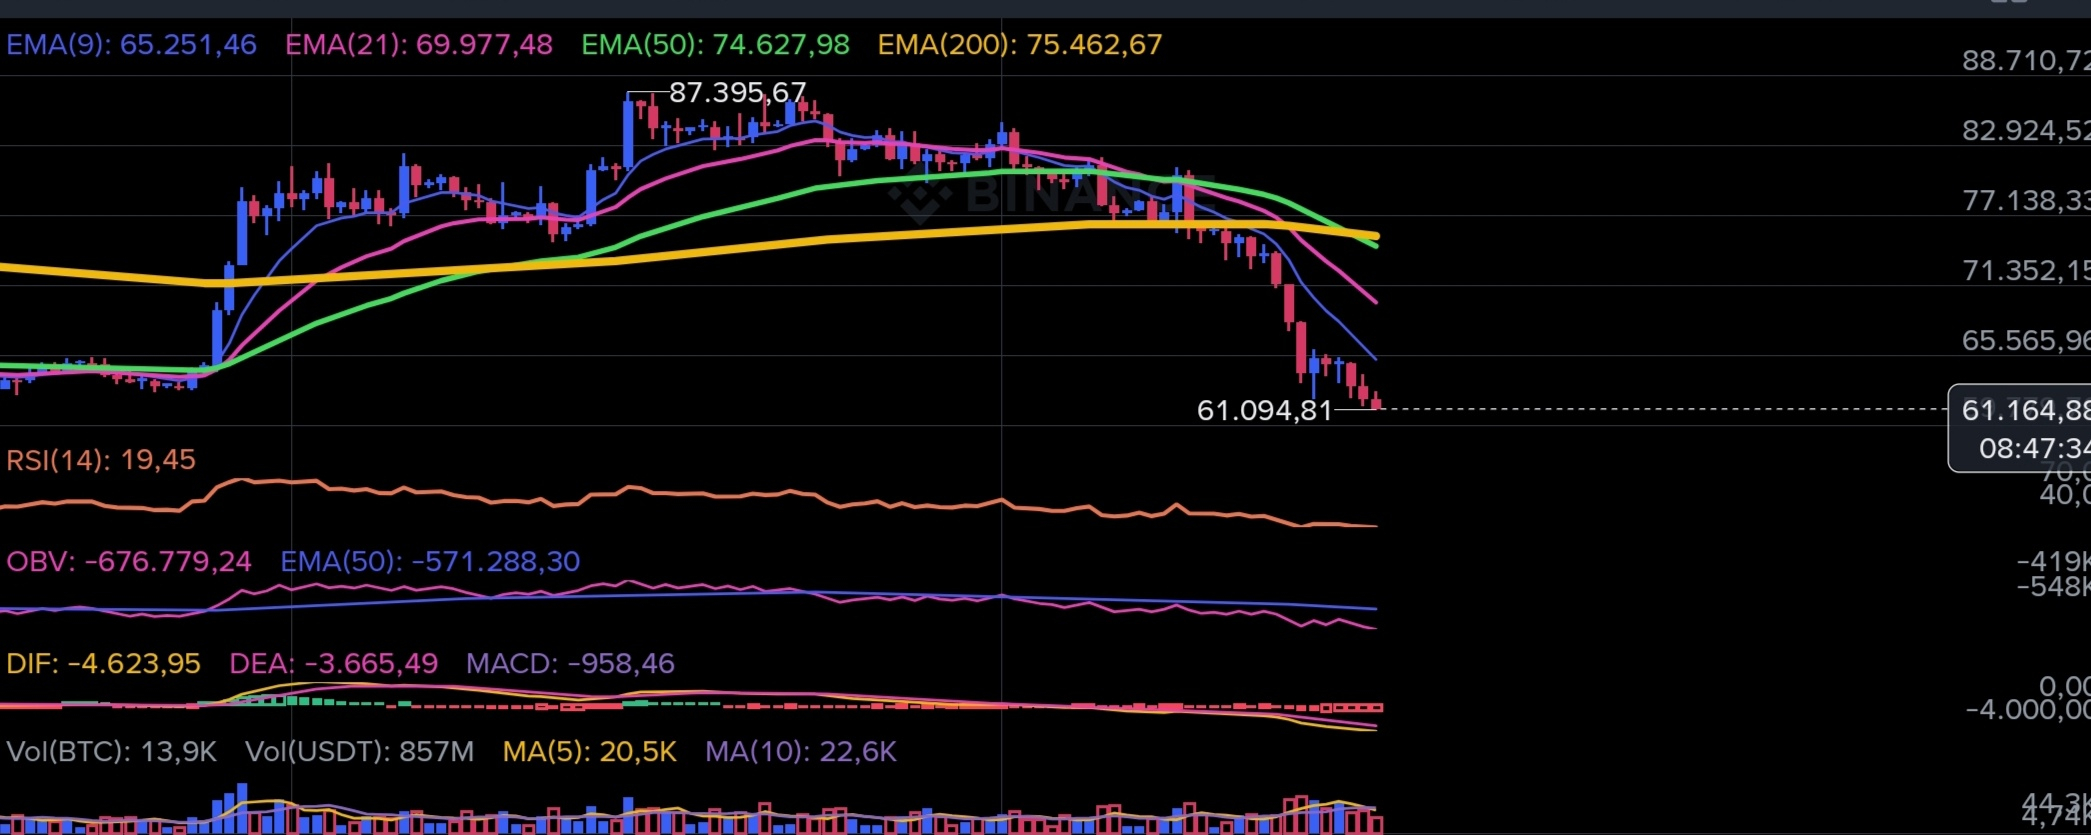
Preço abaixo de todas as EMAs (9, 21, 50 e 200) em todos os timeframes (15m a 1w), confirmando estrutura baixista.
Candle de 1h operando na mínima após abertura em $61.744,10, estendendo perdas após o candle diário anterior cair de $63.036,90 para $61.959,30.
CVD (100m) em -1.527,69 mostra agressão vendedora dominante nos futuros, enquanto o spot apresenta maior volume de Asks ($1.007.796,92) vs Bids ($417.805,21).
Momentum descendente com RSI em 19.2 no diário e 27.9 no 4h, sinalizando sobrevenda acentuada com risco de repique técnico.
Top traders fortemente posicionados em Long (65.1%) contra fluxo vendedor e queda de preço, criando risco de pressão sobre posições compradas sem gatilho de squeeze imediato.
Projeção Macro: Queda (Probabilidade: 72%)
Suporte imediato: $60.917,90 Melhor Bid do book no topo e mínima recente do candle de 1h.
Suporte estrutural: $58.500,00 Zona psicológica e de extensão de queda abaixo da mínima diária anterior com RSI diário em 19.2
Resistência imediata: $61.628,10 EMA 9 de 1h próxima à abertura do candle horário atual.
Resistência macro: $65.478,15 EMA 200 de 1h e região de confluência com EMA 50 de 4h ($65.674,90).
AVISO: Análise educacional baseada em modelagem matemática e probabilística. Criptoativos envolvem risco elevado.
{spot}(SOLUSDT)
BITCOIN | 2026-11-20 15:14 UTC
$SOL #solana
Preço abaixo de todas as EMAs (9, 21, 50 e 200) em todos os timeframes (15m a 1w), confirmando estrutura baixista.
Candle de 1h operando na mínima após abertura em $61.744,10, estendendo perdas após o candle diário anterior cair de $63.036,90 para $61.959,30.
CVD (100m) em -1.527,69 mostra agressão vendedora dominante nos futuros, enquanto o spot apresenta maior volume de Asks ($1.007.796,92) vs Bids ($417.805,21).
Momentum descendente com RSI em 19.2 no diário e 27.9 no 4h, sinalizando sobrevenda acentuada com risco de repique técnico.
Top traders fortemente posicionados em Long (65.1%) contra fluxo vendedor e queda de preço, criando risco de pressão sobre posições compradas sem gatilho de squeeze imediato.
Projeção Macro: Queda (Probabilidade: 72%)
Suporte imediato: $60.917,90 Melhor Bid do book no topo e mínima recente do candle de 1h.
Suporte estrutural: $58.500,00 Zona psicológica e de extensão de queda abaixo da mínima diária anterior com RSI diário em 19.2
Resistência imediata: $61.628,10 EMA 9 de 1h próxima à abertura do candle horário atual.
Resistência macro: $65.478,15 EMA 200 de 1h e região de confluência com EMA 50 de 4h ($65.674,90).
AVISO: Análise educacional baseada em modelagem matemática e probabilística. Criptoativos envolvem risco elevado.
Preço abaixo de todas as EMAs (9, 21, 50 e 200) em todos os timeframes (15m a 1w), confirmando estrutura baixista.
Candle de 1h operando na mínima após abertura em $61.744,10, estendendo perdas após o candle diário anterior cair de $63.036,90 para $61.959,30.
CVD (100m) em -1.527,69 mostra agressão vendedora dominante nos futuros, enquanto o spot apresenta maior volume de Asks ($1.007.796,92) vs Bids ($417.805,21).
Momentum descendente com RSI em 19.2 no diário e 27.9 no 4h, sinalizando sobrevenda acentuada com risco de repique técnico.
Top traders fortemente posicionados em Long (65.1%) contra fluxo vendedor e queda de preço, criando risco de pressão sobre posições compradas sem gatilho de squeeze imediato.
Projeção Macro: Queda (Probabilidade: 72%)
Suporte imediato: $60.917,90 Melhor Bid do book no topo e mínima recente do candle de 1h.
Suporte estrutural: $58.500,00 Zona psicológica e de extensão de queda abaixo da mínima diária anterior com RSI diário em 19.2
Resistência imediata: $61.628,10 EMA 9 de 1h próxima à abertura do candle horário atual.
Resistência macro: $65.478,15 EMA 200 de 1h e região de confluência com EMA 50 de 4h ($65.674,90).
AVISO: Análise educacional baseada em modelagem matemática e probabilística. Criptoativos envolvem risco elevado.
1
1.3k

#solana
My Personal Analysis - $SOL USDT Long
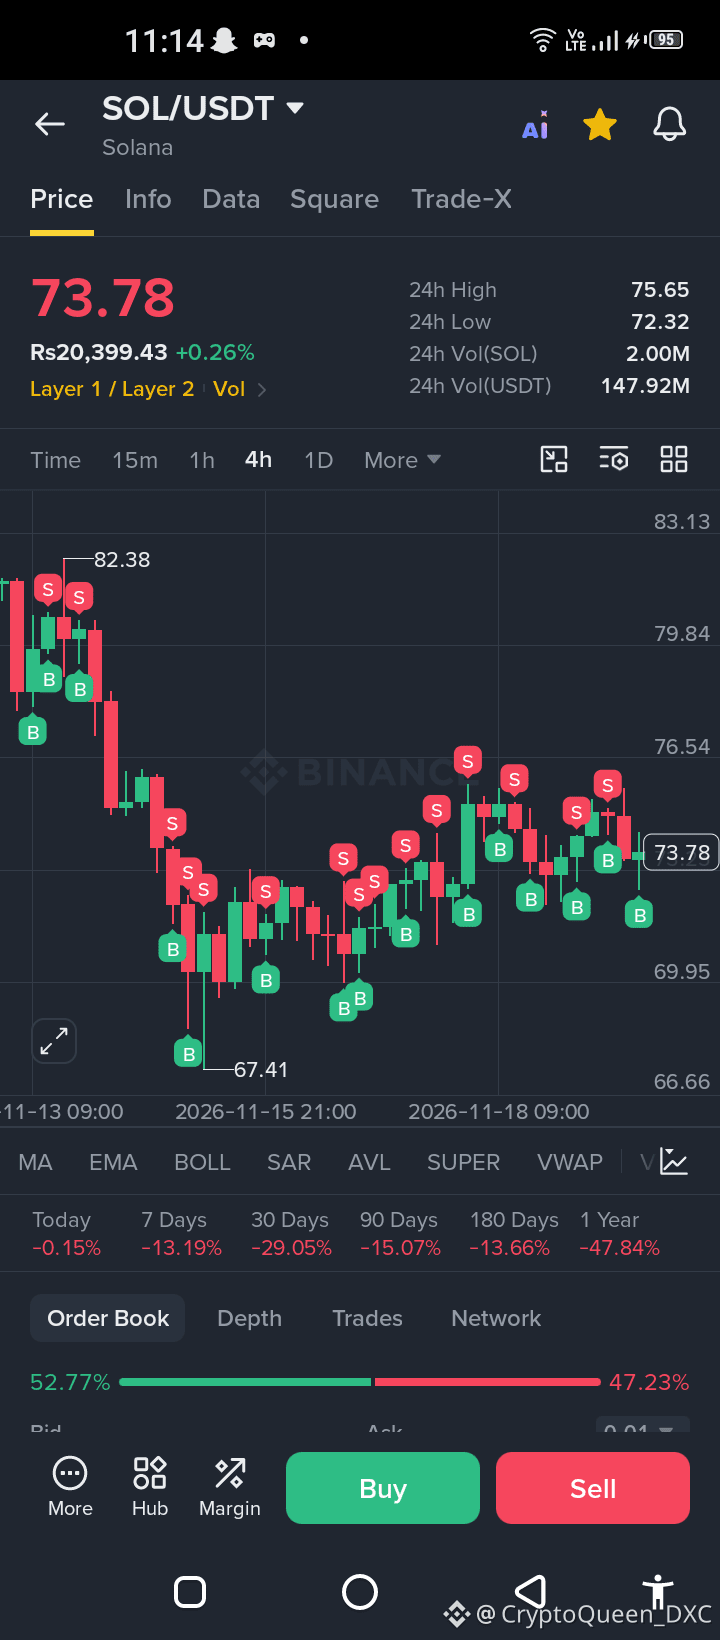
Price right now is around 73.78. My short term view is long, but the bigger trend is still down.
Will it go to 76
Yes, 76 is possible, but not straight away. First price has to break 75.65 and stay above it.
My reason is simple price action, no indicator:
Price made a low near 67.41 and then buyers came in. After that low, price did not go back to 67.41 again. It made a higher low near 69.95, then moved up to 73 to 75 range. That shows sellers are getting weak near the bottom and buyers are slowly taking control for a short term bounce.
On the upside, 75.65 to 76.54 is a strong zone. Price has already been rejected from there two to three times in your chart. That is why 76 is the main test. If price crosses 75.65 and closes above it on the 4H candle, then 76 to 77 becomes very likely.
On the downside, 72.32 is the first support. Below that, 70.50 and then 67.50 are the next supports. As long as price stays above 72.32, buyers are still in control for this bounce.
My Trade Plan
Coin: SOL USDT
Direction: Long
Entry Zone: 73.20 to 74.00
Stop Loss: 71.80
Target 1: 75.65
Target 2: 76.50 to 77.00
Target 3: 79.80, only if price closes above 76.50 on 4H
Leverage: 3x to 5x max, because this is a bounce trade in a downtrend
Risk: Risk only 1 percent to 2 percent of your capital
My personal rule for this trade:
I will take long near 73.50. At 75.65 I will book 50 percent profit. If price rejects from 75.65 and breaks below 72.32, I will exit and wait. I will not hold if 71.80 breaks on 4H close, because then the bounce is over and price can go back to 67.50.
This is my personal analysis only, not financial advice. Always use stop loss.
#writetoearn
#solana
My Personal Analysis - $SOL USDT Long
Price right now is around 73.78. My short term view is long, but the bigger trend is still down.
Will it go to 76
Yes, 76 is possible, but not straight away. First price has to break 75.65 and stay above it.
My reason is simple price action, no indicator:
Price made a low near 67.41 and then buyers came in. After that low, price did not go back to 67.41 again. It made a higher low near 69.95, then moved up to 73 to 75 range. That shows sellers are getting weak near the bottom and buyers are slowly taking control for a short term bounce.
On the upside, 75.65 to 76.54 is a strong zone. Price has already been rejected from there two to three times in your chart. That is why 76 is the main test. If price crosses 75.65 and closes above it on the 4H candle, then 76 to 77 becomes very likely.
On the downside, 72.32 is the first support. Below that, 70.50 and then 67.50 are the next supports. As long as price stays above 72.32, buyers are still in control for this bounce.
My Trade Plan
Coin: SOL USDT
Direction: Long
Entry Zone: 73.20 to 74.00
Stop Loss: 71.80
Target 1: 75.65
Target 2: 76.50 to 77.00
Target 3: 79.80, only if price closes above 76.50 on 4H
Leverage: 3x to 5x max, because this is a bounce trade in a downtrend
Risk: Risk only 1 percent to 2 percent of your capital
My personal rule for this trade:
I will take long near 73.50. At 75.65 I will book 50 percent profit. If price rejects from 75.65 and breaks below 72.32, I will exit and wait. I will not hold if 71.80 breaks on 4H close, because then the bounce is over and price can go back to 67.50.
This is my personal analysis only, not financial advice. Always use stop loss.
#writetoearn
My Personal Analysis - $SOL USDT Long
Price right now is around 73.78. My short term view is long, but the bigger trend is still down.
Will it go to 76
Yes, 76 is possible, but not straight away. First price has to break 75.65 and stay above it.
My reason is simple price action, no indicator:
Price made a low near 67.41 and then buyers came in. After that low, price did not go back to 67.41 again. It made a higher low near 69.95, then moved up to 73 to 75 range. That shows sellers are getting weak near the bottom and buyers are slowly taking control for a short term bounce.
On the upside, 75.65 to 76.54 is a strong zone. Price has already been rejected from there two to three times in your chart. That is why 76 is the main test. If price crosses 75.65 and closes above it on the 4H candle, then 76 to 77 becomes very likely.
On the downside, 72.32 is the first support. Below that, 70.50 and then 67.50 are the next supports. As long as price stays above 72.32, buyers are still in control for this bounce.
My Trade Plan
Coin: SOL USDT
Direction: Long
Entry Zone: 73.20 to 74.00
Stop Loss: 71.80
Target 1: 75.65
Target 2: 76.50 to 77.00
Target 3: 79.80, only if price closes above 76.50 on 4H
Leverage: 3x to 5x max, because this is a bounce trade in a downtrend
Risk: Risk only 1 percent to 2 percent of your capital
My personal rule for this trade:
I will take long near 73.50. At 75.65 I will book 50 percent profit. If price rejects from 75.65 and breaks below 72.32, I will exit and wait. I will not hold if 71.80 breaks on 4H close, because then the bounce is over and price can go back to 67.50.
This is my personal analysis only, not financial advice. Always use stop loss.
#writetoearn
2.2k

SOLANA (SOL) UNDER PRESSURE: A DEEPER CORRECTION OR THE BEGINNING OF A LARGER DOWNTREND?#Solana is facing renewed selling pressure, and the latest price action is sending a message that traders should not ignore. The market has experienced a sharp decline, with SOL trading around $68.32 at the time of this chart, after falling from the $74–$75 region.
The question now is not simply whether Solana will bounce. The real question is whether buyers can regain control of the market structure or whether sellers are preparing for another leg lower.
📉 The Current Market Situation
According to the chart:
• Current price: $68.32
• 24-hour high: $74.69
• 24-hour low: $67.91
• 24-hour change: -7.39%
• 24-hour trading volume: $223.82 million (USDT)
SOL has experienced a substantial decline, while the latest candle shows a strong bearish move toward the $67.91 area. This indicates that selling pressure has intensified and buyers have struggled to defend higher price levels.
However, a sharp decline does not automatically mean that the market must continue falling. After aggressive selling, markets can experience relief rallies, liquidity grabs, short-covering, or temporary recoveries.
The key is to understand what happens next—not to react emotionally to the red candles.
🔍 Technical Structure: Sellers Currently Have the Advantage
On the 1-hour timeframe, Solana is trading below its major moving averages:
• MA(7): $71.16
• MA(25): $72.49
• MA(99): $73.17
Price being below all three moving averages suggests that short-term momentum remains bearish. The moving averages are acting as potential dynamic resistance zones rather than immediate support.
A recovery toward $71–$73 would not necessarily mean a bullish reversal. The market would need to reclaim these levels, establish acceptance above them, and demonstrate stronger buying pressure before a convincing trend reversal could be considered.
Until then, rallies may face selling pressure.
🟢 Key Support Zone: $67.90–$68.00
The recent low near $67.91 is an important short-term level.
If buyers successfully defend this zone and price begins forming higher lows, we could see a relief rally toward:
$69.80 → $71.15 → $72.50
These levels represent potential reaction areas, not guaranteed targets.
A strong recovery accompanied by increasing buying volume could gradually improve the short-term structure. However, a weak bounce followed by another rejection would indicate that sellers remain dominant.
🔴 What If $67.90 Breaks?
If SOL loses the $67.90 support area and fails to reclaim it, the market could enter another bearish expansion phase.
A breakdown accompanied by strong volume and sustained price acceptance below support could expose lower price zones. Traders should avoid assuming the exact bottom because markets can continue declining much longer than expected.
The most important confirmation would be how price behaves after the breakdown:
• Does it immediately reclaim $67.90?
• Does it remain below support?
• Does selling volume continue increasing?
• Does the market form lower highs and lower lows?
These signals may provide a clearer picture of whether the breakdown is genuine or simply a liquidity sweep.
🧠 The Smart Money Perspective
One of the biggest mistakes traders make during sharp market declines is entering a position simply because the price looks cheap.
A falling price is not automatically undervalued.
Professional traders generally focus on liquidity, market structure, volume, key levels, and confirmation. They do not need to predict the exact bottom to find a trade opportunity.
At this stage, SOL could present two different scenarios:
Scenario 1 — Bullish Recovery
Price holds the $67.90 area, selling pressure begins weakening, and buyers reclaim important resistance levels. A recovery toward the moving averages could develop, potentially changing short-term sentiment.
Scenario 2 — Bearish Continuation
Price breaks below $67.90, fails to recover the level, and continues creating lower highs and lower lows. In this situation, downside risk remains elevated, and attempting to catch the bottom could be dangerous.
⚠️ The Biggest Risk Right Now
The biggest risk is trading based on emotion.
When a coin drops 7%, traders often rush to buy because they believe the discount is attractive. Others panic-sell at the bottom because they fear further losses.
Both reactions can lead to poor decisions.
A better approach is to wait for confirmation, define risk in advance, and understand where your trading idea becomes invalid.
The market rewards patience more often than impulsive decisions.
📌 My View
Solana is currently in a weak short-term position. Price is below the 7, 25, and 99 moving averages, selling pressure is strong, and the recent support near $67.91 is now an important level to watch.
I am not treating this decline as an automatic buying opportunity, nor am I assuming that SOL will continue falling without a bounce.
The next move will depend on the reaction around support, the strength of any recovery, volume, and the broader crypto market.
The market is not giving us a reason to rush. It is giving us a reason to observe carefully.
Sometimes the best trade is not the one you enter first—it is the one you enter after the market confirms your idea.
Stay disciplined. Protect your capital. Trade the structure, not your emotions.
This analysis is for educational and informational purposes only and is not financial advice. Cryptocurrency markets are highly volatile. Always conduct your own research and manage your risk.
SOLANA (SOL) UNDER PRESSURE: A DEEPER CORRECTION OR THE BEGINNING OF A LARGER DOWNTREND?
#Solana is facing renewed selling pressure, and the latest price action is sending a message that traders should not ignore. The market has experienced a sharp decline, with SOL trading around $68.32 at the time of this chart, after falling from the $74–$75 region.
The question now is not simply whether Solana will bounce. The real question is whether buyers can regain control of the market structure or whether sellers are preparing for another leg lower.
📉 The Current Market Situation
According to the chart:
• Current price: $68.32
• 24-hour high: $74.69
• 24-hour low: $67.91
• 24-hour change: -7.39%
• 24-hour trading volume: $223.82 million (USDT)
SOL has experienced a substantial decline, while the latest candle shows a strong bearish move toward the $67.91 area. This indicates that selling pressure has intensified and buyers have struggled to defend higher price levels.
However, a sharp decline does not automatically mean that the market must continue falling. After aggressive selling, markets can experience relief rallies, liquidity grabs, short-covering, or temporary recoveries.
The key is to understand what happens next—not to react emotionally to the red candles.
🔍 Technical Structure: Sellers Currently Have the Advantage
On the 1-hour timeframe, Solana is trading below its major moving averages:
• MA(7): $71.16
• MA(25): $72.49
• MA(99): $73.17
Price being below all three moving averages suggests that short-term momentum remains bearish. The moving averages are acting as potential dynamic resistance zones rather than immediate support.
A recovery toward $71–$73 would not necessarily mean a bullish reversal. The market would need to reclaim these levels, establish acceptance above them, and demonstrate stronger buying pressure before a convincing trend reversal could be considered.
Until then, rallies may face selling pressure.
🟢 Key Support Zone: $67.90–$68.00
The recent low near $67.91 is an important short-term level.
If buyers successfully defend this zone and price begins forming higher lows, we could see a relief rally toward:
$69.80 → $71.15 → $72.50
These levels represent potential reaction areas, not guaranteed targets.
A strong recovery accompanied by increasing buying volume could gradually improve the short-term structure. However, a weak bounce followed by another rejection would indicate that sellers remain dominant.
🔴 What If $67.90 Breaks?
If SOL loses the $67.90 support area and fails to reclaim it, the market could enter another bearish expansion phase.
A breakdown accompanied by strong volume and sustained price acceptance below support could expose lower price zones. Traders should avoid assuming the exact bottom because markets can continue declining much longer than expected.
The most important confirmation would be how price behaves after the breakdown:
• Does it immediately reclaim $67.90?
• Does it remain below support?
• Does selling volume continue increasing?
• Does the market form lower highs and lower lows?
These signals may provide a clearer picture of whether the breakdown is genuine or simply a liquidity sweep.
🧠 The Smart Money Perspective
One of the biggest mistakes traders make during sharp market declines is entering a position simply because the price looks cheap.
A falling price is not automatically undervalued.
Professional traders generally focus on liquidity, market structure, volume, key levels, and confirmation. They do not need to predict the exact bottom to find a trade opportunity.
At this stage, SOL could present two different scenarios:
Scenario 1 — Bullish Recovery
Price holds the $67.90 area, selling pressure begins weakening, and buyers reclaim important resistance levels. A recovery toward the moving averages could develop, potentially changing short-term sentiment.
Scenario 2 — Bearish Continuation
Price breaks below $67.90, fails to recover the level, and continues creating lower highs and lower lows. In this situation, downside risk remains elevated, and attempting to catch the bottom could be dangerous.
⚠️ The Biggest Risk Right Now
The biggest risk is trading based on emotion.
When a coin drops 7%, traders often rush to buy because they believe the discount is attractive. Others panic-sell at the bottom because they fear further losses.
Both reactions can lead to poor decisions.
A better approach is to wait for confirmation, define risk in advance, and understand where your trading idea becomes invalid.
The market rewards patience more often than impulsive decisions.
📌 My View
Solana is currently in a weak short-term position. Price is below the 7, 25, and 99 moving averages, selling pressure is strong, and the recent support near $67.91 is now an important level to watch.
I am not treating this decline as an automatic buying opportunity, nor am I assuming that SOL will continue falling without a bounce.
The next move will depend on the reaction around support, the strength of any recovery, volume, and the broader crypto market.
The market is not giving us a reason to rush. It is giving us a reason to observe carefully.
Sometimes the best trade is not the one you enter first—it is the one you enter after the market confirms your idea.
Stay disciplined. Protect your capital. Trade the structure, not your emotions.
This analysis is for educational and informational purposes only and is not financial advice. Cryptocurrency markets are highly volatile. Always conduct your own research and manage your risk.
The question now is not simply whether Solana will bounce. The real question is whether buyers can regain control of the market structure or whether sellers are preparing for another leg lower.
📉 The Current Market Situation
According to the chart:
• Current price: $68.32
• 24-hour high: $74.69
• 24-hour low: $67.91
• 24-hour change: -7.39%
• 24-hour trading volume: $223.82 million (USDT)
SOL has experienced a substantial decline, while the latest candle shows a strong bearish move toward the $67.91 area. This indicates that selling pressure has intensified and buyers have struggled to defend higher price levels.
However, a sharp decline does not automatically mean that the market must continue falling. After aggressive selling, markets can experience relief rallies, liquidity grabs, short-covering, or temporary recoveries.
The key is to understand what happens next—not to react emotionally to the red candles.
🔍 Technical Structure: Sellers Currently Have the Advantage
On the 1-hour timeframe, Solana is trading below its major moving averages:
• MA(7): $71.16
• MA(25): $72.49
• MA(99): $73.17
Price being below all three moving averages suggests that short-term momentum remains bearish. The moving averages are acting as potential dynamic resistance zones rather than immediate support.
A recovery toward $71–$73 would not necessarily mean a bullish reversal. The market would need to reclaim these levels, establish acceptance above them, and demonstrate stronger buying pressure before a convincing trend reversal could be considered.
Until then, rallies may face selling pressure.
🟢 Key Support Zone: $67.90–$68.00
The recent low near $67.91 is an important short-term level.
If buyers successfully defend this zone and price begins forming higher lows, we could see a relief rally toward:
$69.80 → $71.15 → $72.50
These levels represent potential reaction areas, not guaranteed targets.
A strong recovery accompanied by increasing buying volume could gradually improve the short-term structure. However, a weak bounce followed by another rejection would indicate that sellers remain dominant.
🔴 What If $67.90 Breaks?
If SOL loses the $67.90 support area and fails to reclaim it, the market could enter another bearish expansion phase.
A breakdown accompanied by strong volume and sustained price acceptance below support could expose lower price zones. Traders should avoid assuming the exact bottom because markets can continue declining much longer than expected.
The most important confirmation would be how price behaves after the breakdown:
• Does it immediately reclaim $67.90?
• Does it remain below support?
• Does selling volume continue increasing?
• Does the market form lower highs and lower lows?
These signals may provide a clearer picture of whether the breakdown is genuine or simply a liquidity sweep.
🧠 The Smart Money Perspective
One of the biggest mistakes traders make during sharp market declines is entering a position simply because the price looks cheap.
A falling price is not automatically undervalued.
Professional traders generally focus on liquidity, market structure, volume, key levels, and confirmation. They do not need to predict the exact bottom to find a trade opportunity.
At this stage, SOL could present two different scenarios:
Scenario 1 — Bullish Recovery
Price holds the $67.90 area, selling pressure begins weakening, and buyers reclaim important resistance levels. A recovery toward the moving averages could develop, potentially changing short-term sentiment.
Scenario 2 — Bearish Continuation
Price breaks below $67.90, fails to recover the level, and continues creating lower highs and lower lows. In this situation, downside risk remains elevated, and attempting to catch the bottom could be dangerous.
⚠️ The Biggest Risk Right Now
The biggest risk is trading based on emotion.
When a coin drops 7%, traders often rush to buy because they believe the discount is attractive. Others panic-sell at the bottom because they fear further losses.
Both reactions can lead to poor decisions.
A better approach is to wait for confirmation, define risk in advance, and understand where your trading idea becomes invalid.
The market rewards patience more often than impulsive decisions.
📌 My View
Solana is currently in a weak short-term position. Price is below the 7, 25, and 99 moving averages, selling pressure is strong, and the recent support near $67.91 is now an important level to watch.
I am not treating this decline as an automatic buying opportunity, nor am I assuming that SOL will continue falling without a bounce.
The next move will depend on the reaction around support, the strength of any recovery, volume, and the broader crypto market.
The market is not giving us a reason to rush. It is giving us a reason to observe carefully.
Sometimes the best trade is not the one you enter first—it is the one you enter after the market confirms your idea.
Stay disciplined. Protect your capital. Trade the structure, not your emotions.
This analysis is for educational and informational purposes only and is not financial advice. Cryptocurrency markets are highly volatile. Always conduct your own research and manage your risk.
1
227


Мақала
Солана$SOL На графіку SOL/USDT (1h) спостерігається виражений низхідний тренд від максимуму $75.65 із недавнім імпульсним падінням до мінімуму $67.80 та подальшим технічним відскоком до $69.31.
Поточна ситуація та ключові рівні
* Локальна підтримка: $67.80 — рівень, де відбувся різкий відкуп (довга зелена свічка після великого падіння).
* Найближчий опір: $70.86 – $71.00 — зона початку останньої великої червоної імпульсної свічки. Наступний сильний опір розташований вище, в діапазоні $72.50 – $73.00 (зона попередньої консолідації).
* Книга ордерів (Order Book): Співвідношення лімітних заявок становить 64.12% на купівлю проти 35.88% на продаж, що вказує на інтерес покупців біля поточних рівнів, але не гарантує негайного розвороту.
Можливі сценарії руху ціни
* Корекційний відскок (ретест опору)
* Після різкого падіння ціна часто намагається перекрити частину імпульсу. Якщо покупці утримають ціну вище $68.80–$69.00, можливий рух до зони $70.50–$70.86.
* Проте в зоні $70.86 висока ймовірність нової реакції продавців, оскільки глобально на годинному таймфреймі тренд залишається ведмежим.
* Продовження зниження (основний трендовий сценарій)
* Поточне зростання від $67.80 може виявитися лише технічною паузою («ведмежим прапором» або ретестом знизу) перед новою хвилею падіння.
* У разі пробою рівня $67.80 вниз відкриється шлях до наступних психологічних та технічних підтримок в районі $66.00 – $65.00.
* Бокова консолідація (флет)
* Ціна може затиснутися в діапазоні $67.80 – $70.80 на найближчі кілька годин, щоб «охолодити» індикатори після сильного проливу.
Тактика дій (ризик-менеджмент)
* Для покупок (Long): Входити на поточних рівнях ризиковано, оскільки ціна вже відскочила від дна, а тренд низхідний. Безпечніше чекати або підтвердження закріплення вище $71.00, або повторного тесту $67.80–$68.00 із формуванням подвійного дна та обов'язковим стоп-лоссом нижче $67.50.
* Для продажів (Short): Більш вигідні точки входу за трендом можуть з'явитися при підході ціни до зони опору $70.50–$70.86 за умови появи розворотних свічкових патернів (наприклад, довгих верхніх тіней).#solana
Солана
$SOL На графіку SOL/USDT (1h) спостерігається виражений низхідний тренд від максимуму $75.65 із недавнім імпульсним падінням до мінімуму $67.80 та подальшим технічним відскоком до $69.31.
Поточна ситуація та ключові рівні
* Локальна підтримка: $67.80 — рівень, де відбувся різкий відкуп (довга зелена свічка після великого падіння).
* Найближчий опір: $70.86 – $71.00 — зона початку останньої великої червоної імпульсної свічки. Наступний сильний опір розташований вище, в діапазоні $72.50 – $73.00 (зона попередньої консолідації).
* Книга ордерів (Order Book): Співвідношення лімітних заявок становить 64.12% на купівлю проти 35.88% на продаж, що вказує на інтерес покупців біля поточних рівнів, але не гарантує негайного розвороту.
Можливі сценарії руху ціни
* Корекційний відскок (ретест опору)
* Після різкого падіння ціна часто намагається перекрити частину імпульсу. Якщо покупці утримають ціну вище $68.80–$69.00, можливий рух до зони $70.50–$70.86.
* Проте в зоні $70.86 висока ймовірність нової реакції продавців, оскільки глобально на годинному таймфреймі тренд залишається ведмежим.
* Продовження зниження (основний трендовий сценарій)
* Поточне зростання від $67.80 може виявитися лише технічною паузою («ведмежим прапором» або ретестом знизу) перед новою хвилею падіння.
* У разі пробою рівня $67.80 вниз відкриється шлях до наступних психологічних та технічних підтримок в районі $66.00 – $65.00.
* Бокова консолідація (флет)
* Ціна може затиснутися в діапазоні $67.80 – $70.80 на найближчі кілька годин, щоб «охолодити» індикатори після сильного проливу.
Тактика дій (ризик-менеджмент)
* Для покупок (Long): Входити на поточних рівнях ризиковано, оскільки ціна вже відскочила від дна, а тренд низхідний. Безпечніше чекати або підтвердження закріплення вище $71.00, або повторного тесту $67.80–$68.00 із формуванням подвійного дна та обов'язковим стоп-лоссом нижче $67.50.
* Для продажів (Short): Більш вигідні точки входу за трендом можуть з'явитися при підході ціни до зони опору $70.50–$70.86 за умови появи розворотних свічкових патернів (наприклад, довгих верхніх тіней).#solana
Поточна ситуація та ключові рівні
* Локальна підтримка: $67.80 — рівень, де відбувся різкий відкуп (довга зелена свічка після великого падіння).
* Найближчий опір: $70.86 – $71.00 — зона початку останньої великої червоної імпульсної свічки. Наступний сильний опір розташований вище, в діапазоні $72.50 – $73.00 (зона попередньої консолідації).
* Книга ордерів (Order Book): Співвідношення лімітних заявок становить 64.12% на купівлю проти 35.88% на продаж, що вказує на інтерес покупців біля поточних рівнів, але не гарантує негайного розвороту.
Можливі сценарії руху ціни
* Корекційний відскок (ретест опору)
* Після різкого падіння ціна часто намагається перекрити частину імпульсу. Якщо покупці утримають ціну вище $68.80–$69.00, можливий рух до зони $70.50–$70.86.
* Проте в зоні $70.86 висока ймовірність нової реакції продавців, оскільки глобально на годинному таймфреймі тренд залишається ведмежим.
* Продовження зниження (основний трендовий сценарій)
* Поточне зростання від $67.80 може виявитися лише технічною паузою («ведмежим прапором» або ретестом знизу) перед новою хвилею падіння.
* У разі пробою рівня $67.80 вниз відкриється шлях до наступних психологічних та технічних підтримок в районі $66.00 – $65.00.
* Бокова консолідація (флет)
* Ціна може затиснутися в діапазоні $67.80 – $70.80 на найближчі кілька годин, щоб «охолодити» індикатори після сильного проливу.
Тактика дій (ризик-менеджмент)
* Для покупок (Long): Входити на поточних рівнях ризиковано, оскільки ціна вже відскочила від дна, а тренд низхідний. Безпечніше чекати або підтвердження закріплення вище $71.00, або повторного тесту $67.80–$68.00 із формуванням подвійного дна та обов'язковим стоп-лоссом нижче $67.50.
* Для продажів (Short): Більш вигідні точки входу за трендом можуть з'явитися при підході ціни до зони опору $70.50–$70.86 за умови появи розворотних свічкових патернів (наприклад, довгих верхніх тіней).#solana
642

·
--
Мақала
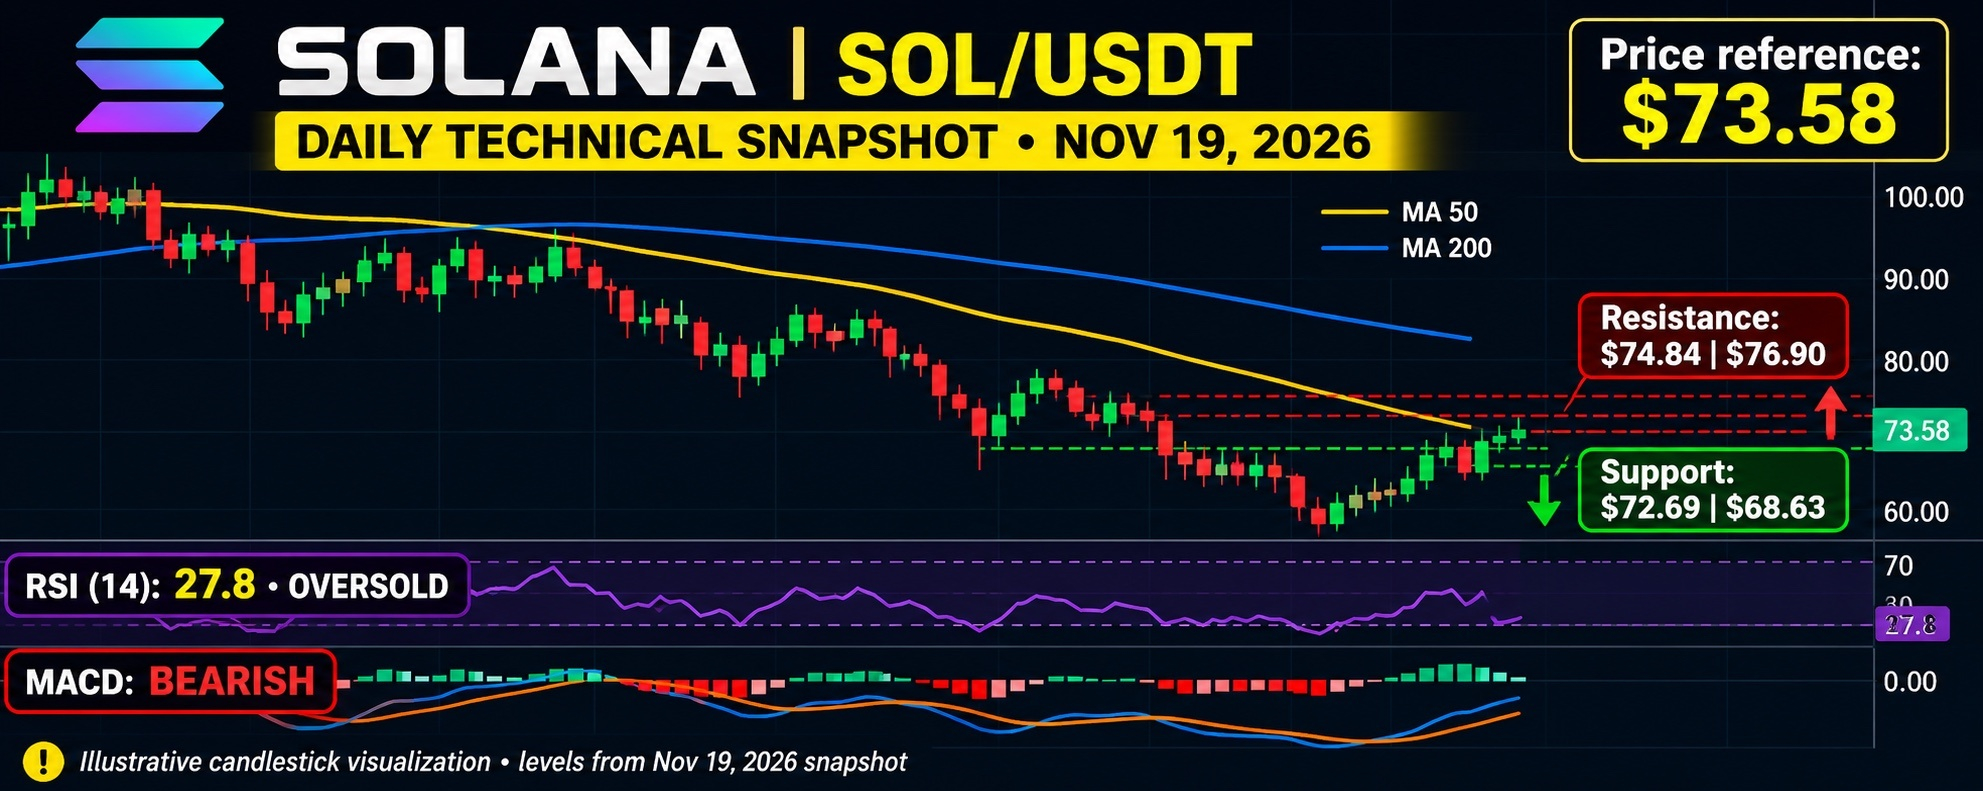
🚨 $SOLANA: BEARISH PRESSURE OR A POWERFUL COMEBACK AHEAD?Solana ( $SOL ) is approaching a critical technical zone where the next move could define its short-term direction.
📊 Technical Breakdown:
$SOL is showing a strong bearish structure, with price trading below major moving averages. RSI near 28 signals oversold conditions, while MACD remains negative, confirming that sellers still have momentum. Key support sits around $72.70, followed by $68.60. Resistance stands near $74.80–$76.90.
🔥 Market Prediction:
A strong-volume breakout above $77 could open the door toward $87 and potentially $95. However, losing $72 could expose SOL to another move toward $68 or even $64. An oversold RSI may trigger a relief bounce, but a confirmed trend reversal requires stronger buying pressure.
💡 Smart Insight: Watch volume, RSI recovery and MACD crossover before assuming the bulls are back. Solana’s next major move could create opportunities—but risk management remains essential.
#sol #solana #cryptouniverseofficial #altcoins
{future}(SOLUSDT)
🚨 $SOLANA: BEARISH PRESSURE OR A POWERFUL COMEBACK AHEAD?
Solana ( $SOL ) is approaching a critical technical zone where the next move could define its short-term direction.
📊 Technical Breakdown:
$SOL is showing a strong bearish structure, with price trading below major moving averages. RSI near 28 signals oversold conditions, while MACD remains negative, confirming that sellers still have momentum. Key support sits around $72.70, followed by $68.60. Resistance stands near $74.80–$76.90.
🔥 Market Prediction:
A strong-volume breakout above $77 could open the door toward $87 and potentially $95. However, losing $72 could expose SOL to another move toward $68 or even $64. An oversold RSI may trigger a relief bounce, but a confirmed trend reversal requires stronger buying pressure.
💡 Smart Insight: Watch volume, RSI recovery and MACD crossover before assuming the bulls are back. Solana’s next major move could create opportunities—but risk management remains essential.
#sol #solana #cryptouniverseofficial #altcoins
📊 Technical Breakdown:
$SOL is showing a strong bearish structure, with price trading below major moving averages. RSI near 28 signals oversold conditions, while MACD remains negative, confirming that sellers still have momentum. Key support sits around $72.70, followed by $68.60. Resistance stands near $74.80–$76.90.
🔥 Market Prediction:
A strong-volume breakout above $77 could open the door toward $87 and potentially $95. However, losing $72 could expose SOL to another move toward $68 or even $64. An oversold RSI may trigger a relief bounce, but a confirmed trend reversal requires stronger buying pressure.
💡 Smart Insight: Watch volume, RSI recovery and MACD crossover before assuming the bulls are back. Solana’s next major move could create opportunities—but risk management remains essential.
#sol #solana #cryptouniverseofficial #altcoins
2
1.1k

Bought the $SOL dip at $69.10… but the market had other plans. 🥲📉
20x Isolated Long. Already seeing red, while SOL struggles to recover.
Not every trade starts with green. Sometimes the real test is patience and risk management.
Would you hold this position or cut the loss and wait for a better entry? 👀
#SOL #solana #BinanceFutures #cryptotrading $BTC $ETH
Bought the $SOL dip at $69.10… but the market had other plans. 🥲📉
20x Isolated Long. Already seeing red, while SOL struggles to recover.
Not every trade starts with green. Sometimes the real test is patience and risk management.
Would you hold this position or cut the loss and wait for a better entry? 👀
#SOL #solana #BinanceFutures #cryptotrading $BTC $ETH
20x Isolated Long. Already seeing red, while SOL struggles to recover.
Not every trade starts with green. Sometimes the real test is patience and risk management.
Would you hold this position or cut the loss and wait for a better entry? 👀
#SOL #solana #BinanceFutures #cryptotrading $BTC $ETH
1
1
140

·
--
Fumbled $SOL badly. Bought the bounce, then watched it bleed.
Brutal lesson. 😵💫
It’s $67.28 now, down 7.34% in 24h after an 8% 4h flush, with $266.4M traded. RSI is 25, volume is 1.3x average, and shorts are paying funding at -0.020%. Oversold doesn’t cancel the bearish stack under the 20d and 50d MAs.
If it tags $60, I’m watching, not chasing. $BTC strength won’t magically fix this chart.
What’s your SOL target here? 👀
#Solana #Crypto
Fumbled $SOL badly. Bought the bounce, then watched it bleed.
Brutal lesson. 😵💫
It’s $67.28 now, down 7.34% in 24h after an 8% 4h flush, with $266.4M traded. RSI is 25, volume is 1.3x average, and shorts are paying funding at -0.020%. Oversold doesn’t cancel the bearish stack under the 20d and 50d MAs.
If it tags $60, I’m watching, not chasing. $BTC strength won’t magically fix this chart.
What’s your SOL target here? 👀
#Solana #Crypto
Brutal lesson. 😵💫
It’s $67.28 now, down 7.34% in 24h after an 8% 4h flush, with $266.4M traded. RSI is 25, volume is 1.3x average, and shorts are paying funding at -0.020%. Oversold doesn’t cancel the bearish stack under the 20d and 50d MAs.
If it tags $60, I’m watching, not chasing. $BTC strength won’t magically fix this chart.
What’s your SOL target here? 👀
#Solana #Crypto
146

·
--
Төмен (кемімелі)
💥 Many traders watch the price of $SOL , but smart investors watch what happens behind the chart.
🚦 3 IMPORTANT THINGS TO WATCH:
🐋 Whale Activity: Are large holders accumulating or selling?
📊 Trading Volume: Is buying volume supporting the price movement?
🛡️ Key Support: Can SOL hold its important support levels during market pressure?
$SOL
{spot}(SOLUSDT)
⚠️ Remember: A green candle doesn't guarantee a bullish trend. Always wait for confirmation before making a decision.
💡 Awareness is more powerful than FOMO. Protect your capital before chasing profits.
What do you think is $SOL preparing for recovery, or could more pressure be ahead?
#Solana #SOL #CryptoAwareness #BinanceSquare
💥 Many traders watch the price of $SOL , but smart investors watch what happens behind the chart.
🚦 3 IMPORTANT THINGS TO WATCH:
🐋 Whale Activity: Are large holders accumulating or selling?
📊 Trading Volume: Is buying volume supporting the price movement?
🛡️ Key Support: Can SOL hold its important support levels during market pressure?
$SOL
⚠️ Remember: A green candle doesn't guarantee a bullish trend. Always wait for confirmation before making a decision.
💡 Awareness is more powerful than FOMO. Protect your capital before chasing profits.
What do you think is $SOL preparing for recovery, or could more pressure be ahead?
#Solana #SOL #CryptoAwareness #BinanceSquare
🚦 3 IMPORTANT THINGS TO WATCH:
🐋 Whale Activity: Are large holders accumulating or selling?
📊 Trading Volume: Is buying volume supporting the price movement?
🛡️ Key Support: Can SOL hold its important support levels during market pressure?
$SOL
⚠️ Remember: A green candle doesn't guarantee a bullish trend. Always wait for confirmation before making a decision.
💡 Awareness is more powerful than FOMO. Protect your capital before chasing profits.
What do you think is $SOL preparing for recovery, or could more pressure be ahead?
#Solana #SOL #CryptoAwareness #BinanceSquare
1
345


·
--
Расталды
Solana放出2027年升级路线图:网络计算能力计划翻倍,SOL生态又要提速了?
Solana又准备给自己的网络性能加码了。
近日,Solana核心开发团队Anza公布了2027年技术路线图,最受关注的目标就是:将网络计算能力从每秒约2.5亿计算单位提升至5亿,直接翻一倍!
除了计算能力提升,还有几个升级方向值得关注:
普通交易成本有望降低。 团队计划将关联代币账户(ATA)相关操作的计算资源消耗减少80%。这意味着常见代币操作有望变得更加轻量,但不代表所有用户的交易手续费都会直接下降80%。
单笔交易能处理更多账户。 计划将单笔交易涉及的账户数量上限从64个提高到96个,让复杂的链上操作有更多空间,也有利于连接更多流动性池。
网络传输和交易排序继续优化。 Rotor计划改进区块传播效率,Constellation则希望让交易排序规则更加清晰,并增加验证者之间的竞争。
这些升级如果逐步落地,Solana未来在高频交易、DeFi和复杂链上应用方面,可能拥有更大的性能空间。
不过要注意,路线图不等于已经完成升级。计算能力翻倍是2027年的工程目标,最终效果还要看开发进度、网络测试和主网上线后的实际表现。
我觉得Solana这次真正想做的,不只是让交易更快,而是让网络能够承载更复杂的应用,让开发者有更多发挥空间。
你认为计算能力翻倍,会成为SOL下一轮生态增长的重要推动力吗?还是说,真正决定SOL价值的仍然是链上实际用户和资金规模?
#Solana #sol #solana2027路线图拟将网络计算容量翻倍
Solana放出2027年升级路线图:网络计算能力计划翻倍,SOL生态又要提速了?
Solana又准备给自己的网络性能加码了。
近日,Solana核心开发团队Anza公布了2027年技术路线图,最受关注的目标就是:将网络计算能力从每秒约2.5亿计算单位提升至5亿,直接翻一倍!
除了计算能力提升,还有几个升级方向值得关注:
普通交易成本有望降低。 团队计划将关联代币账户(ATA)相关操作的计算资源消耗减少80%。这意味着常见代币操作有望变得更加轻量,但不代表所有用户的交易手续费都会直接下降80%。
单笔交易能处理更多账户。 计划将单笔交易涉及的账户数量上限从64个提高到96个,让复杂的链上操作有更多空间,也有利于连接更多流动性池。
网络传输和交易排序继续优化。 Rotor计划改进区块传播效率,Constellation则希望让交易排序规则更加清晰,并增加验证者之间的竞争。
这些升级如果逐步落地,Solana未来在高频交易、DeFi和复杂链上应用方面,可能拥有更大的性能空间。
不过要注意,路线图不等于已经完成升级。计算能力翻倍是2027年的工程目标,最终效果还要看开发进度、网络测试和主网上线后的实际表现。
我觉得Solana这次真正想做的,不只是让交易更快,而是让网络能够承载更复杂的应用,让开发者有更多发挥空间。
你认为计算能力翻倍,会成为SOL下一轮生态增长的重要推动力吗?还是说,真正决定SOL价值的仍然是链上实际用户和资金规模?
#Solana #sol #solana2027路线图拟将网络计算容量翻倍
Solana又准备给自己的网络性能加码了。
近日,Solana核心开发团队Anza公布了2027年技术路线图,最受关注的目标就是:将网络计算能力从每秒约2.5亿计算单位提升至5亿,直接翻一倍!
除了计算能力提升,还有几个升级方向值得关注:
普通交易成本有望降低。 团队计划将关联代币账户(ATA)相关操作的计算资源消耗减少80%。这意味着常见代币操作有望变得更加轻量,但不代表所有用户的交易手续费都会直接下降80%。
单笔交易能处理更多账户。 计划将单笔交易涉及的账户数量上限从64个提高到96个,让复杂的链上操作有更多空间,也有利于连接更多流动性池。
网络传输和交易排序继续优化。 Rotor计划改进区块传播效率,Constellation则希望让交易排序规则更加清晰,并增加验证者之间的竞争。
这些升级如果逐步落地,Solana未来在高频交易、DeFi和复杂链上应用方面,可能拥有更大的性能空间。
不过要注意,路线图不等于已经完成升级。计算能力翻倍是2027年的工程目标,最终效果还要看开发进度、网络测试和主网上线后的实际表现。
我觉得Solana这次真正想做的,不只是让交易更快,而是让网络能够承载更复杂的应用,让开发者有更多发挥空间。
你认为计算能力翻倍,会成为SOL下一轮生态增长的重要推动力吗?还是说,真正决定SOL价值的仍然是链上实际用户和资金规模?
#Solana #sol #solana2027路线图拟将网络计算容量翻倍
1
594

Расталды
📊🚨عاجل تحديث رسمي: خارطة طريق سولانا 2027.. مضاعفة القدرة وخفض التكاليف بنسبة 80% ⚡
وفقاً لما نشره حساب Binance News الرسمي، كشفت شركة التطوير Anza عن تفاصيل خارطة طريق شبكة سولانا لعام 2027 (ما بعد ترقية Alpenglow)، والتي تركز على كفاءة الشبكة وقوة الأداء:
🔹 أبرز الأرقام والتحديثات التقنية:
مضاعفة القدرة الحاسوبية: رفع طاقة الشبكة إلى الضعف لاستيعاب تطبيقات أضخم.خفض التكاليف بنسبة 80%: تقليل وحدات الحوسبة (CU) اللازمة لمعاملات حسابات الرموز بنسبة 80%، مع تقليل البيانات المنقولة.مرونة وسرعة أعلى: زيادة عدد الحسابات المسموح بها في المعاملة الواحدة (من 64 إلى 96)، وإدخال نظام Constellation لتعزيز أمان وتطوير البروتوكول.
🔹 قراءة هادئة للسوق ($SOL ):
يتحرك السعر حالياً قرب مناطق $72.14 (-3.2%) وسط هدوء وتذبذب طبيعي في السوق.الخلاصة للمستثمر المنضبط: التطوير التقني للشبكة يسير بخطى ثابتة نحو المستقبل؛ وفي أوقات التراجع السعري، يركز المستثمر الصابر على بناء الكميات بهدوء وإدارة المخاطر بدلاً من التفاعل العاطفي مع الشاشة.
شاركنا رأيك: برأيك أي ميزة في خارطة طريق 2027 هي الأهم لمستقبل الشبكة؟ 👇
{spot}(SOLUSDT)
#CryptoPatience #Solana $SOL
📊🚨عاجل تحديث رسمي: خارطة طريق سولانا 2027.. مضاعفة القدرة وخفض التكاليف بنسبة 80% ⚡
وفقاً لما نشره حساب Binance News الرسمي، كشفت شركة التطوير Anza عن تفاصيل خارطة طريق شبكة سولانا لعام 2027 (ما بعد ترقية Alpenglow)، والتي تركز على كفاءة الشبكة وقوة الأداء:
🔹 أبرز الأرقام والتحديثات التقنية:
مضاعفة القدرة الحاسوبية: رفع طاقة الشبكة إلى الضعف لاستيعاب تطبيقات أضخم.خفض التكاليف بنسبة 80%: تقليل وحدات الحوسبة (CU) اللازمة لمعاملات حسابات الرموز بنسبة 80%، مع تقليل البيانات المنقولة.مرونة وسرعة أعلى: زيادة عدد الحسابات المسموح بها في المعاملة الواحدة (من 64 إلى 96)، وإدخال نظام Constellation لتعزيز أمان وتطوير البروتوكول.
🔹 قراءة هادئة للسوق ($SOL ):
يتحرك السعر حالياً قرب مناطق $72.14 (-3.2%) وسط هدوء وتذبذب طبيعي في السوق.الخلاصة للمستثمر المنضبط: التطوير التقني للشبكة يسير بخطى ثابتة نحو المستقبل؛ وفي أوقات التراجع السعري، يركز المستثمر الصابر على بناء الكميات بهدوء وإدارة المخاطر بدلاً من التفاعل العاطفي مع الشاشة.
شاركنا رأيك: برأيك أي ميزة في خارطة طريق 2027 هي الأهم لمستقبل الشبكة؟ 👇
#CryptoPatience #Solana $SOL
وفقاً لما نشره حساب Binance News الرسمي، كشفت شركة التطوير Anza عن تفاصيل خارطة طريق شبكة سولانا لعام 2027 (ما بعد ترقية Alpenglow)، والتي تركز على كفاءة الشبكة وقوة الأداء:
🔹 أبرز الأرقام والتحديثات التقنية:
مضاعفة القدرة الحاسوبية: رفع طاقة الشبكة إلى الضعف لاستيعاب تطبيقات أضخم.خفض التكاليف بنسبة 80%: تقليل وحدات الحوسبة (CU) اللازمة لمعاملات حسابات الرموز بنسبة 80%، مع تقليل البيانات المنقولة.مرونة وسرعة أعلى: زيادة عدد الحسابات المسموح بها في المعاملة الواحدة (من 64 إلى 96)، وإدخال نظام Constellation لتعزيز أمان وتطوير البروتوكول.
🔹 قراءة هادئة للسوق ($SOL ):
يتحرك السعر حالياً قرب مناطق $72.14 (-3.2%) وسط هدوء وتذبذب طبيعي في السوق.الخلاصة للمستثمر المنضبط: التطوير التقني للشبكة يسير بخطى ثابتة نحو المستقبل؛ وفي أوقات التراجع السعري، يركز المستثمر الصابر على بناء الكميات بهدوء وإدارة المخاطر بدلاً من التفاعل العاطفي مع الشاشة.
شاركنا رأيك: برأيك أي ميزة في خارطة طريق 2027 هي الأهم لمستقبل الشبكة؟ 👇
#CryptoPatience #Solana $SOL

1
1
3
466
Мақала
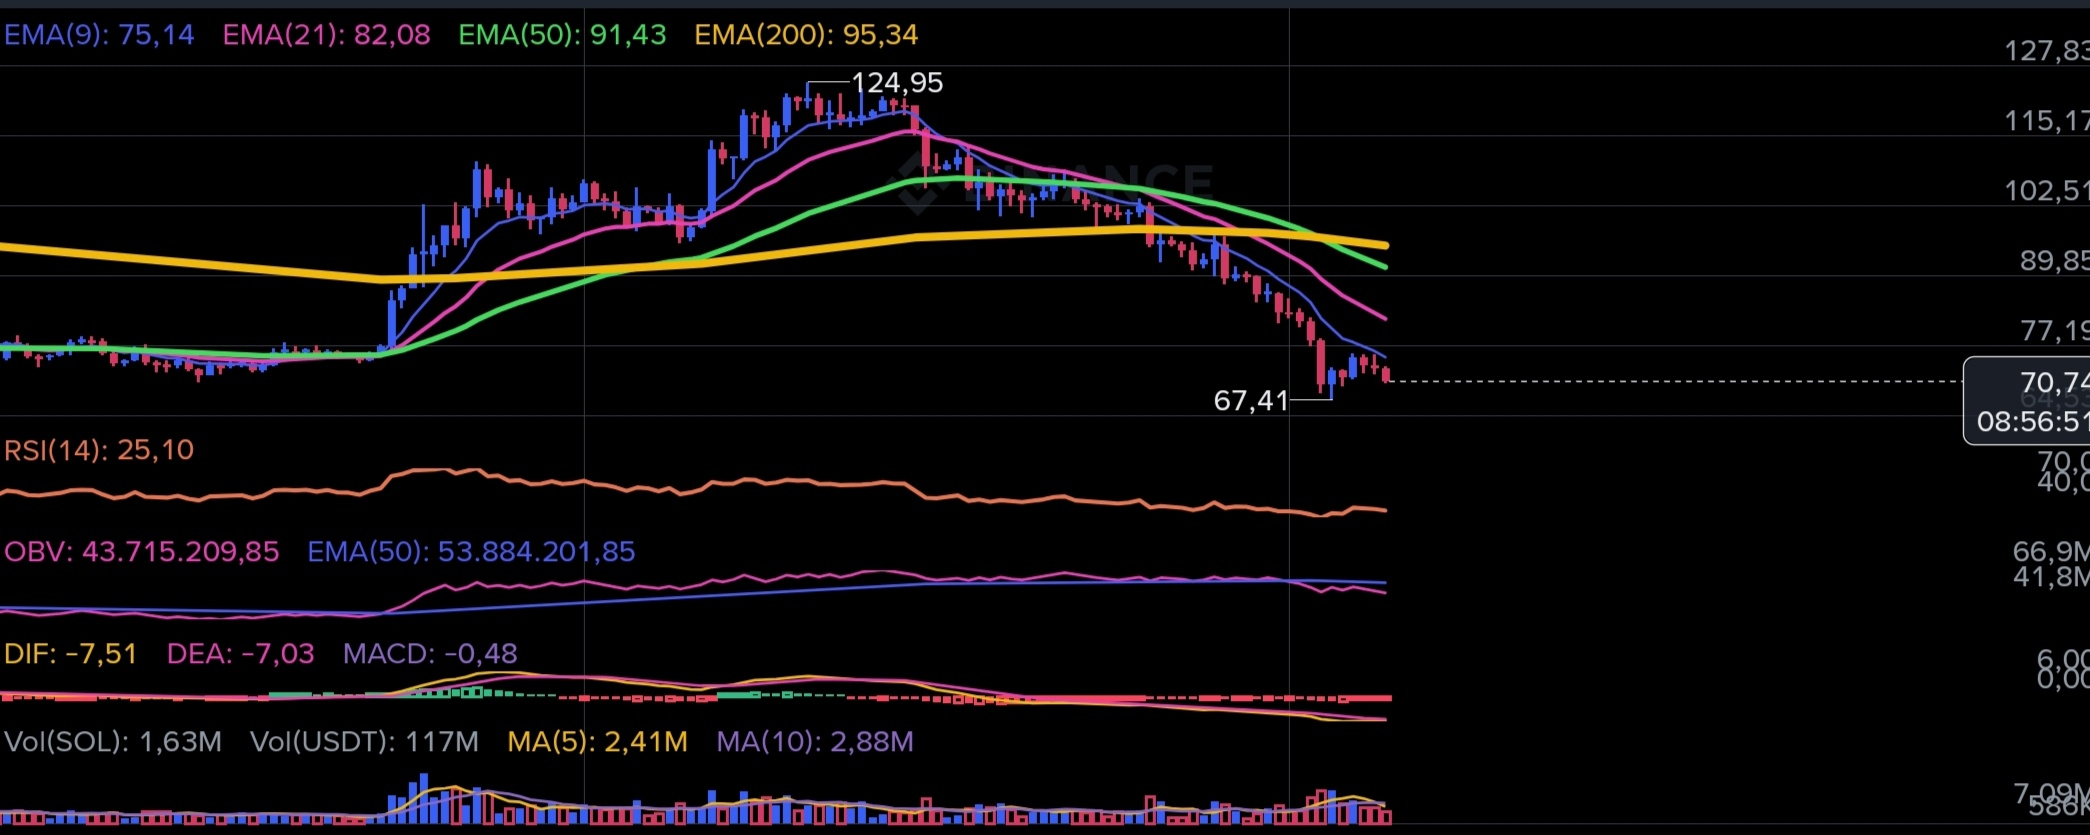
SOLANA | 2026-11-20 15:04 UTC$SOL #solana
Estrutura totalmente baixista em todos os timeframes, com preço abaixo das EMAs 9/21/50/200.
Candle diário anterior fechou em queda e candle 1H anterior varreu liquidez em $70,42 antes de repique parcial, mantendo topos descendentes.
Fluxo vendedor predominante nos futuros (CVD 100m em -59.388,60) apesar do volume elevado (DEX $1,90B / CEX $1,86B) e entrada de $400,9M em stablecoins.
Momentum vendedor ativo, com RSI diário em 25,1 e 4H em 34,4, sinalizando possível exaustão de curto prazo sem reversão confirmada.
Excesso de comprados entre top traders (62,9% Longs / L/S 1,69) contra CVD negativo cria risco de long squeeze abaixo de $70,40, moderado por inflow de stablecoins.
Projeção Macro: Queda (Probabilidade: 62%)
Suporte imediato: $70.42 Mínima do candle anterior de 1 hora e proximidade do book topo ($70.78)
Suporte estrutural: $68.50 Zona psicológica e de liquidez abaixo da mínima recente de $70.42 em extensão de baixa
Resistência imediata: $71.57 EMA 9 de 1 hora ($71,57) e máxima recente de 1 hora ($71,70)
Resistência macro: $75.52 EMA 50 de 4 horas ($75,52) e máxima do candle diário anterior ($75,63)
AVISO: Análise educacional baseada em modelagem matemática e probabilística. Criptoativos envolvem risco elevado.
{spot}(SOLUSDT)
SOLANA | 2026-11-20 15:04 UTC
$SOL #solana
Estrutura totalmente baixista em todos os timeframes, com preço abaixo das EMAs 9/21/50/200.
Candle diário anterior fechou em queda e candle 1H anterior varreu liquidez em $70,42 antes de repique parcial, mantendo topos descendentes.
Fluxo vendedor predominante nos futuros (CVD 100m em -59.388,60) apesar do volume elevado (DEX $1,90B / CEX $1,86B) e entrada de $400,9M em stablecoins.
Momentum vendedor ativo, com RSI diário em 25,1 e 4H em 34,4, sinalizando possível exaustão de curto prazo sem reversão confirmada.
Excesso de comprados entre top traders (62,9% Longs / L/S 1,69) contra CVD negativo cria risco de long squeeze abaixo de $70,40, moderado por inflow de stablecoins.
Projeção Macro: Queda (Probabilidade: 62%)
Suporte imediato: $70.42 Mínima do candle anterior de 1 hora e proximidade do book topo ($70.78)
Suporte estrutural: $68.50 Zona psicológica e de liquidez abaixo da mínima recente de $70.42 em extensão de baixa
Resistência imediata: $71.57 EMA 9 de 1 hora ($71,57) e máxima recente de 1 hora ($71,70)
Resistência macro: $75.52 EMA 50 de 4 horas ($75,52) e máxima do candle diário anterior ($75,63)
AVISO: Análise educacional baseada em modelagem matemática e probabilística. Criptoativos envolvem risco elevado.
Estrutura totalmente baixista em todos os timeframes, com preço abaixo das EMAs 9/21/50/200.
Candle diário anterior fechou em queda e candle 1H anterior varreu liquidez em $70,42 antes de repique parcial, mantendo topos descendentes.
Fluxo vendedor predominante nos futuros (CVD 100m em -59.388,60) apesar do volume elevado (DEX $1,90B / CEX $1,86B) e entrada de $400,9M em stablecoins.
Momentum vendedor ativo, com RSI diário em 25,1 e 4H em 34,4, sinalizando possível exaustão de curto prazo sem reversão confirmada.
Excesso de comprados entre top traders (62,9% Longs / L/S 1,69) contra CVD negativo cria risco de long squeeze abaixo de $70,40, moderado por inflow de stablecoins.
Projeção Macro: Queda (Probabilidade: 62%)
Suporte imediato: $70.42 Mínima do candle anterior de 1 hora e proximidade do book topo ($70.78)
Suporte estrutural: $68.50 Zona psicológica e de liquidez abaixo da mínima recente de $70.42 em extensão de baixa
Resistência imediata: $71.57 EMA 9 de 1 hora ($71,57) e máxima recente de 1 hora ($71,70)
Resistência macro: $75.52 EMA 50 de 4 horas ($75,52) e máxima do candle diário anterior ($75,63)
AVISO: Análise educacional baseada em modelagem matemática e probabilística. Criptoativos envolvem risco elevado.
407
Көбірек контент көру үшін кіріңіз
Binance Square платформасында әлемдік криптоқоғамдастыққа қосылыңыз
⚡️ Криптовалюта туралы ең соңғы және пайдалы ақпаратты алыңыз.
💬 Әлемдегі ең ірі криптобиржаның сеніміне ие.
👍 Расталған авторлардың нақты пікірлерін табыңыз.
Электрондық пошта/телефон нөмірі
Трендтегі тақырыптар
1
#CanBTCReboundAfterFallingBelow60K?
0 рет көрілді
418 адам талқылап жатыр
2
#GlobalStocksFaceLongestLosingStreakSince2023
0 рет көрілді
451 адам талқылап жатыр
3
#AnthropicPlungesTowardIPOPriceonDay2
0 рет көрілді
155 адам талқылап жатыр
4
#GaoTengBitcoinETFListsOnHKEX
0 рет көрілді
356 адам талқылап жатыр
5
#TradFiForBeginners
946,825 рет көрілді
5,758 адам талқылап жатыр
6
#NvidiaBoardReportedlySplitOverHuang’sReturn
258,674 рет көрілді
2,552 адам талқылап жатыр
7
#TetherBurns8BillionUSDTInPast20Days
0 рет көрілді
146 адам талқылап жатыр
8
#BitcoinWalletSignatureFlawExploitableWithinSeconds
0 рет көрілді
71 адам талқылап жатыр
9
#CanGTA6'sLaunchLiftTTWOShares?
207,868 рет көрілді
1,795 адам талқылап жатыр
10
#HongKongProposesSFCLicensingForFourVirtualAssetServices
404 рет көрілді
35 адам талқылап жатыр