

MH_cryptotrading
27 投稿

MH_cryptotrading
報告
ユーザーをブロック
5 フォロー
1 フォロワー
31 いいね
投稿
すべて
動画
·
--
ブリッシュ
翻訳参照
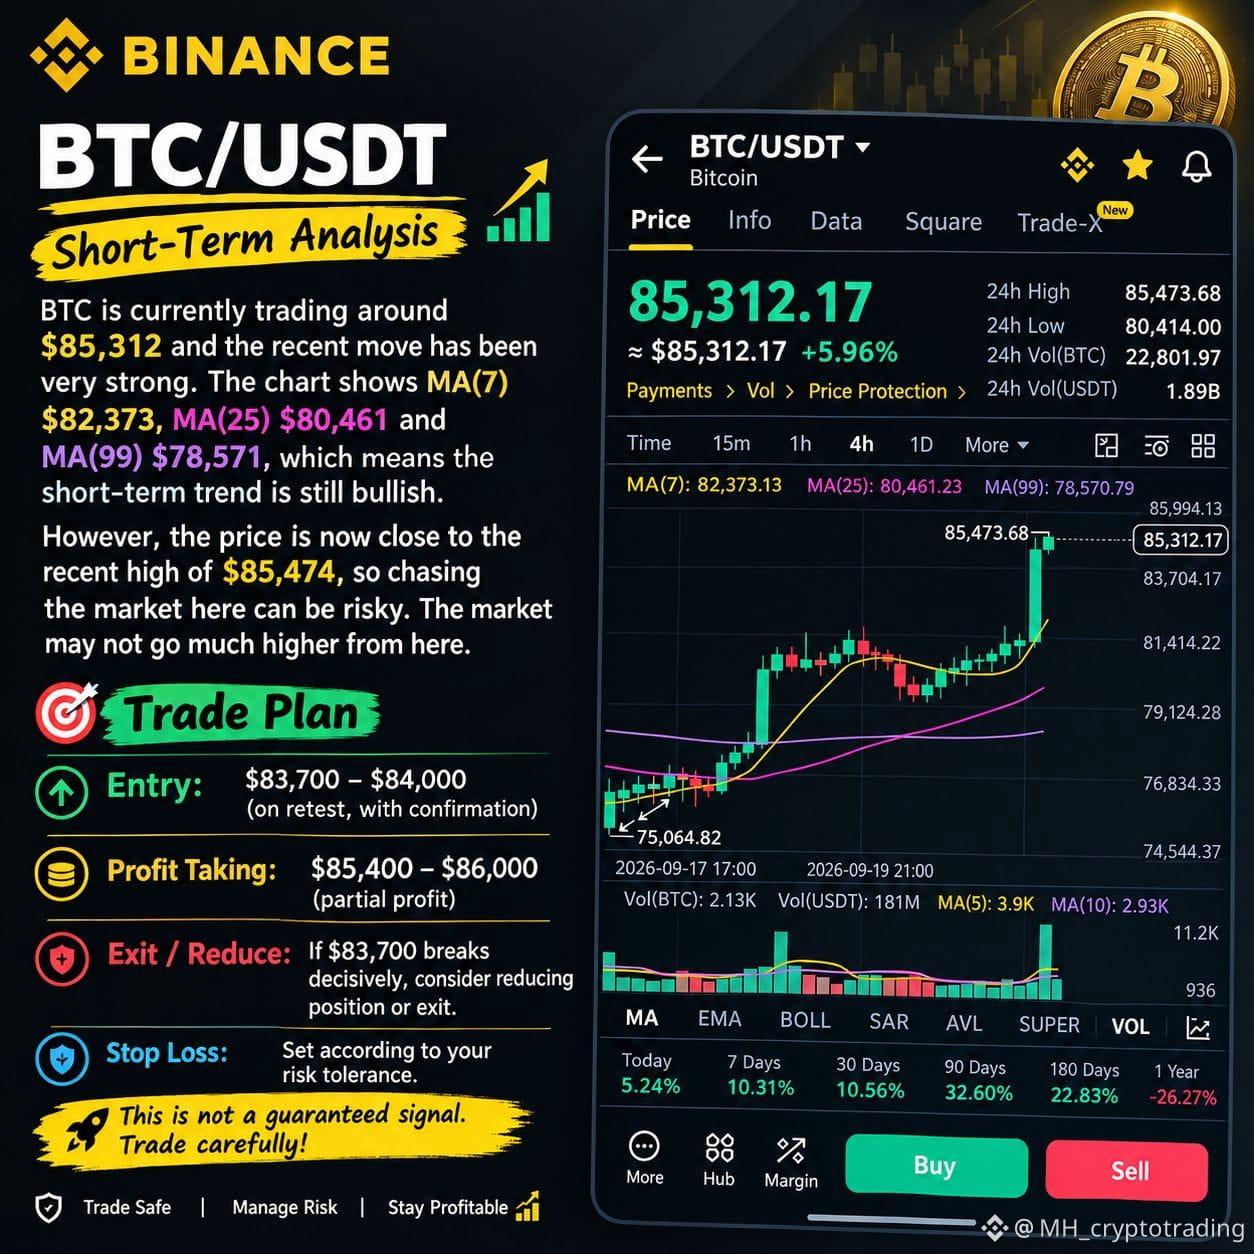
$BTC is currently trading around $85,312 after a strong move up.. However, BTC is already close to its recent high of $85,474, so entering at the current level can be risky.
Entry: $83,700–$84,000 after a confirmed retest.
Take Profit: $85,400–$86,000, preferably partial profit-taking.
Exit/Reduce: If BTC breaks below $83,700 decisively, consider reducing the position or exiting.
Stop-Loss: Keep it according to your risk tolerance.
{future}(BTCUSDT)
$BTC $BNB
{spot}(BNBUSDT)
$BTC is currently trading around $85,312 after a strong move up.. However, BTC is already close to its recent high of $85,474, so entering at the current level can be risky.
Entry: $83,700–$84,000 after a confirmed retest.
Take Profit: $85,400–$86,000, preferably partial profit-taking.
Exit/Reduce: If BTC breaks below $83,700 decisively, consider reducing the position or exiting.
Stop-Loss: Keep it according to your risk tolerance.
$BTC $BNB
Entry: $83,700–$84,000 after a confirmed retest.
Take Profit: $85,400–$86,000, preferably partial profit-taking.
Exit/Reduce: If BTC breaks below $83,700 decisively, consider reducing the position or exiting.
Stop-Loss: Keep it according to your risk tolerance.
$BTC $BNB
1
91
·
--
ブリッシュ
翻訳参照
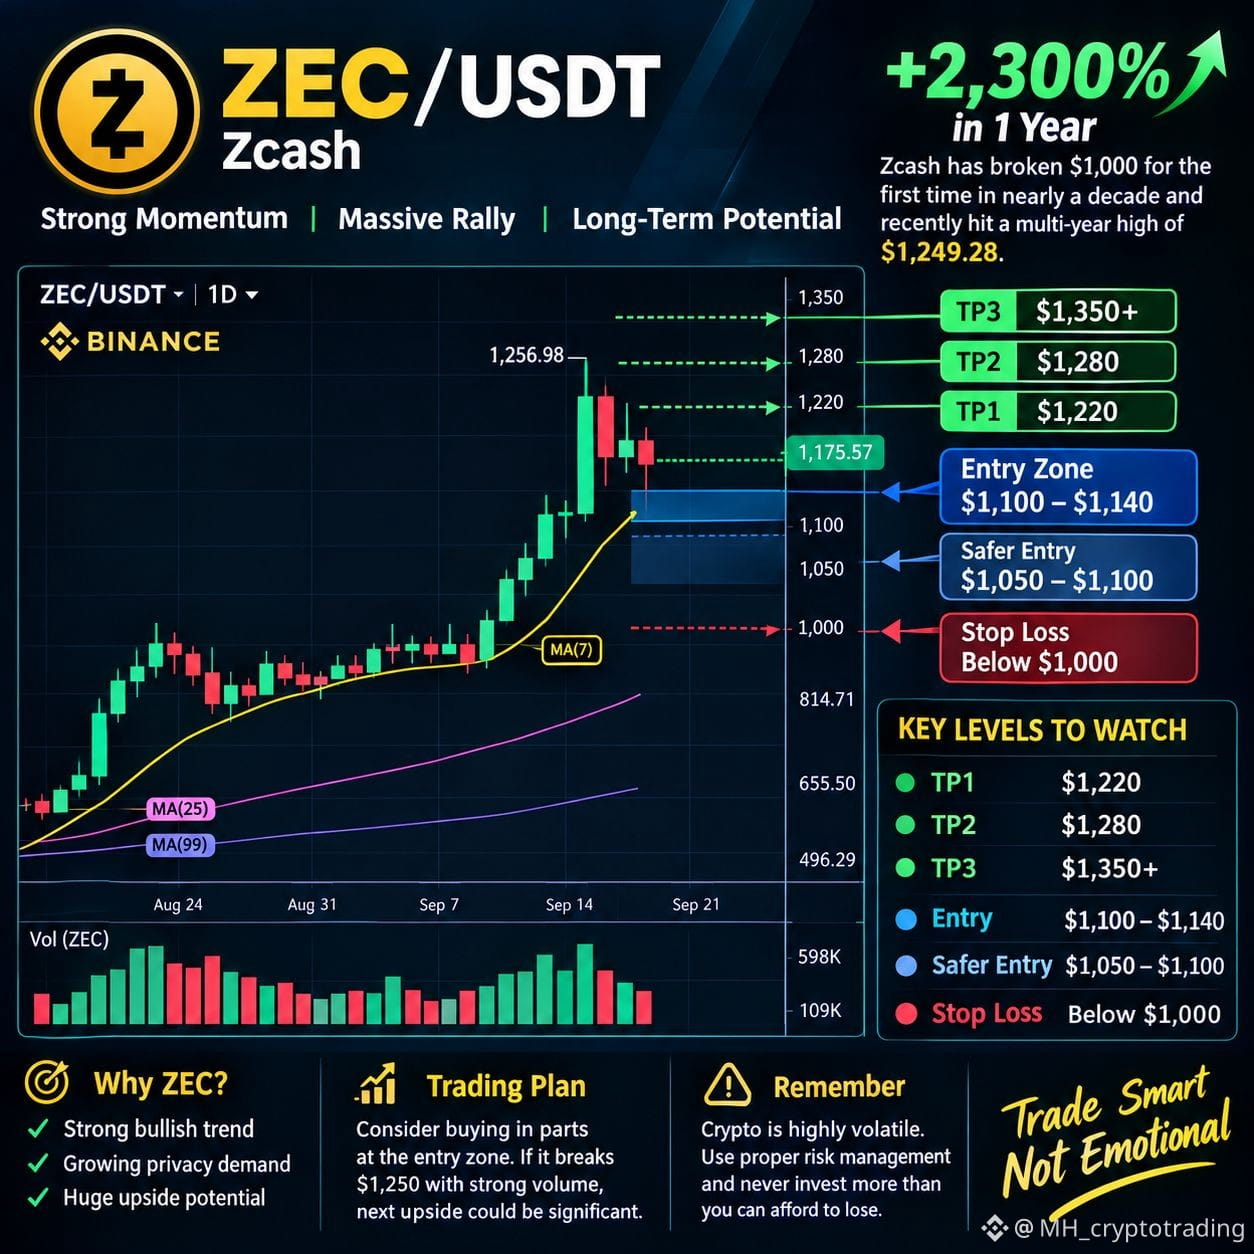
$ZEC is showing a strong bullish trend after its massive rally, but entering at the top can be risky. After recently reaching around $1,250+, a pullback could provide a better entry.
Potential Entry: $1,100–$1,140
Safer Entry: $1,050–$1,100
TP1: $1,220
TP2: $1,280
TP3: $1,350+
Stop-Loss: Below $1,000
If ZEC breaks $1,250 with strong volume, the next upside move could be significant. Avoid FOMO and consider entering in parts
{spot}(ZECUSDT)
$SOL
{spot}(SOLUSDT)
#ZEC/USDT #ZECUSDT #zec
$ZEC is showing a strong bullish trend after its massive rally, but entering at the top can be risky. After recently reaching around $1,250+, a pullback could provide a better entry.
Potential Entry: $1,100–$1,140
Safer Entry: $1,050–$1,100
TP1: $1,220
TP2: $1,280
TP3: $1,350+
Stop-Loss: Below $1,000
If ZEC breaks $1,250 with strong volume, the next upside move could be significant. Avoid FOMO and consider entering in parts
$SOL
#ZEC/USDT #ZECUSDT #zec
Potential Entry: $1,100–$1,140
Safer Entry: $1,050–$1,100
TP1: $1,220
TP2: $1,280
TP3: $1,350+
Stop-Loss: Below $1,000
If ZEC breaks $1,250 with strong volume, the next upside move could be significant. Avoid FOMO and consider entering in parts
$SOL
#ZEC/USDT #ZECUSDT #zec
1
91
翻訳参照
🎁🎁🎁8 and 9 September red packet code. 1) HPVQA0T5 2)J6H9YWTO 3)LK84LRSE 4)V8UST0EK 5)8UWJ2Z0S 🎁🎁🎁 Go and claim.limited time remaining. Follow me for the daily red packet. $ZEC
{spot}(ZECUSDT)
$SOPH
{spot}(SOPHUSDT)
🎁🎁🎁8 and 9 September red packet code. 1) HPVQA0T5 2)J6H9YWTO 3)LK84LRSE 4)V8UST0EK 5)8UWJ2Z0S 🎁🎁🎁 Go and claim.limited time remaining. Follow me for the daily red packet. $ZEC
$SOPH
$SOPH
4
1
418
翻訳参照
$BNB is showing a strong recovery on the 1D chart, but the recent move also brings higher volatility. Price is currently around $756, while the recent high near $780 is an important resistance area. The $735 region looks important for short-term support. If BNB breaks above $780 with strong volume, bullish momentum could continue. On the other hand, losing the $735 area may lead to a deeper pullback. Personally, I would wait for confirmation instead of chasing sudden moves.$BNB $ETC
$BNB is showing a strong recovery on the 1D chart, but the recent move also brings higher volatility. Price is currently around $756, while the recent high near $780 is an important resistance area. The $735 region looks important for short-term support. If BNB breaks above $780 with strong volume, bullish momentum could continue. On the other hand, losing the $735 area may lead to a deeper pullback. Personally, I would wait for confirmation instead of chasing sudden moves.$BNB $ETC
1
226
翻訳参照
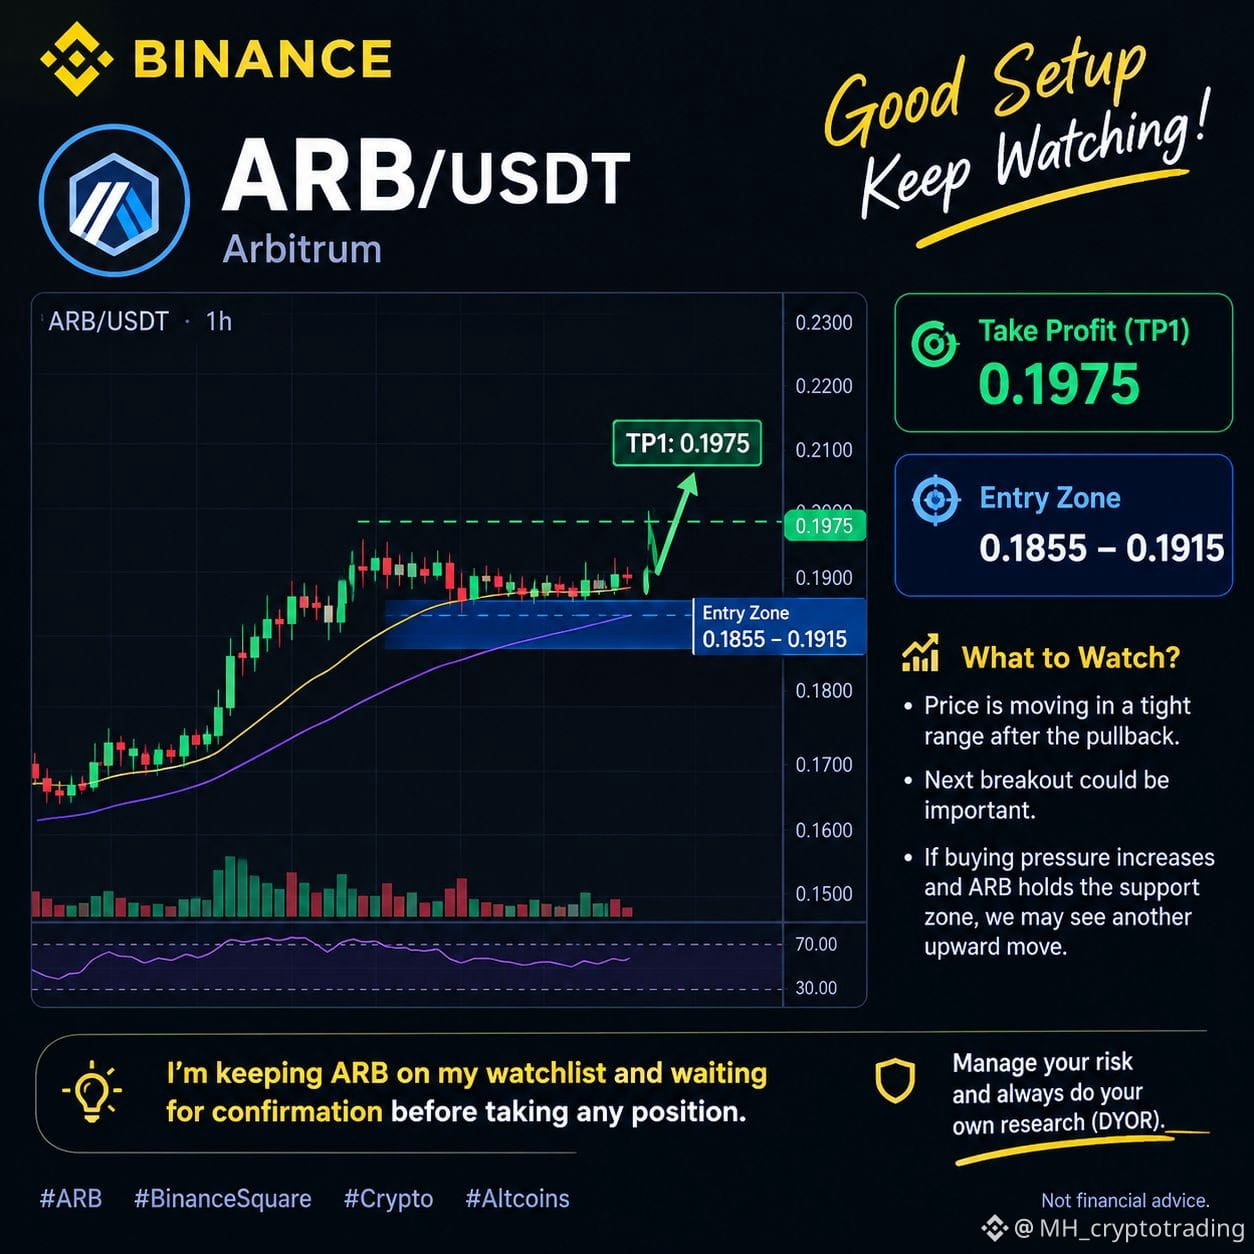
$ARB is showing an interesting setup after the recent pullback. The suggested entry zone is around 0.1855–0.1915, while 0.1975 is marked as the first take-profit level. Price is currently moving in a tight range, so the next breakout could be important. If buying pressure increases and ARB holds the support zone, we may see another upward move.
I’m keeping ARB on my watchlist and waiting for confirmation before taking any position.
{future}(ARBUSDT)
$ARB $SOL
$ARB is showing an interesting setup after the recent pullback. The suggested entry zone is around 0.1855–0.1915, while 0.1975 is marked as the first take-profit level. Price is currently moving in a tight range, so the next breakout could be important. If buying pressure increases and ARB holds the support zone, we may see another upward move.
I’m keeping ARB on my watchlist and waiting for confirmation before taking any position.
$ARB $SOL
I’m keeping ARB on my watchlist and waiting for confirmation before taking any position.
$ARB $SOL
1
246
$SOPH 今週のトップ・ゲイナー。
{future}(SOPHUSDT)
米国との対立が初めて本格化した際、イランはホルムズ海峡でアメリカの船を攻撃した。その結果、戦争は激化した。$SOL $BNB
$SOPH 今週のトップ・ゲイナー。
米国との対立が初めて本格化した際、イランはホルムズ海峡でアメリカの船を攻撃した。その結果、戦争は激化した。$SOL $BNB
米国との対立が初めて本格化した際、イランはホルムズ海峡でアメリカの船を攻撃した。その結果、戦争は激化した。$SOL $BNB

1
1
275
·
--
ブリッシュ
翻訳参照
{future}(IOSTUSDT)
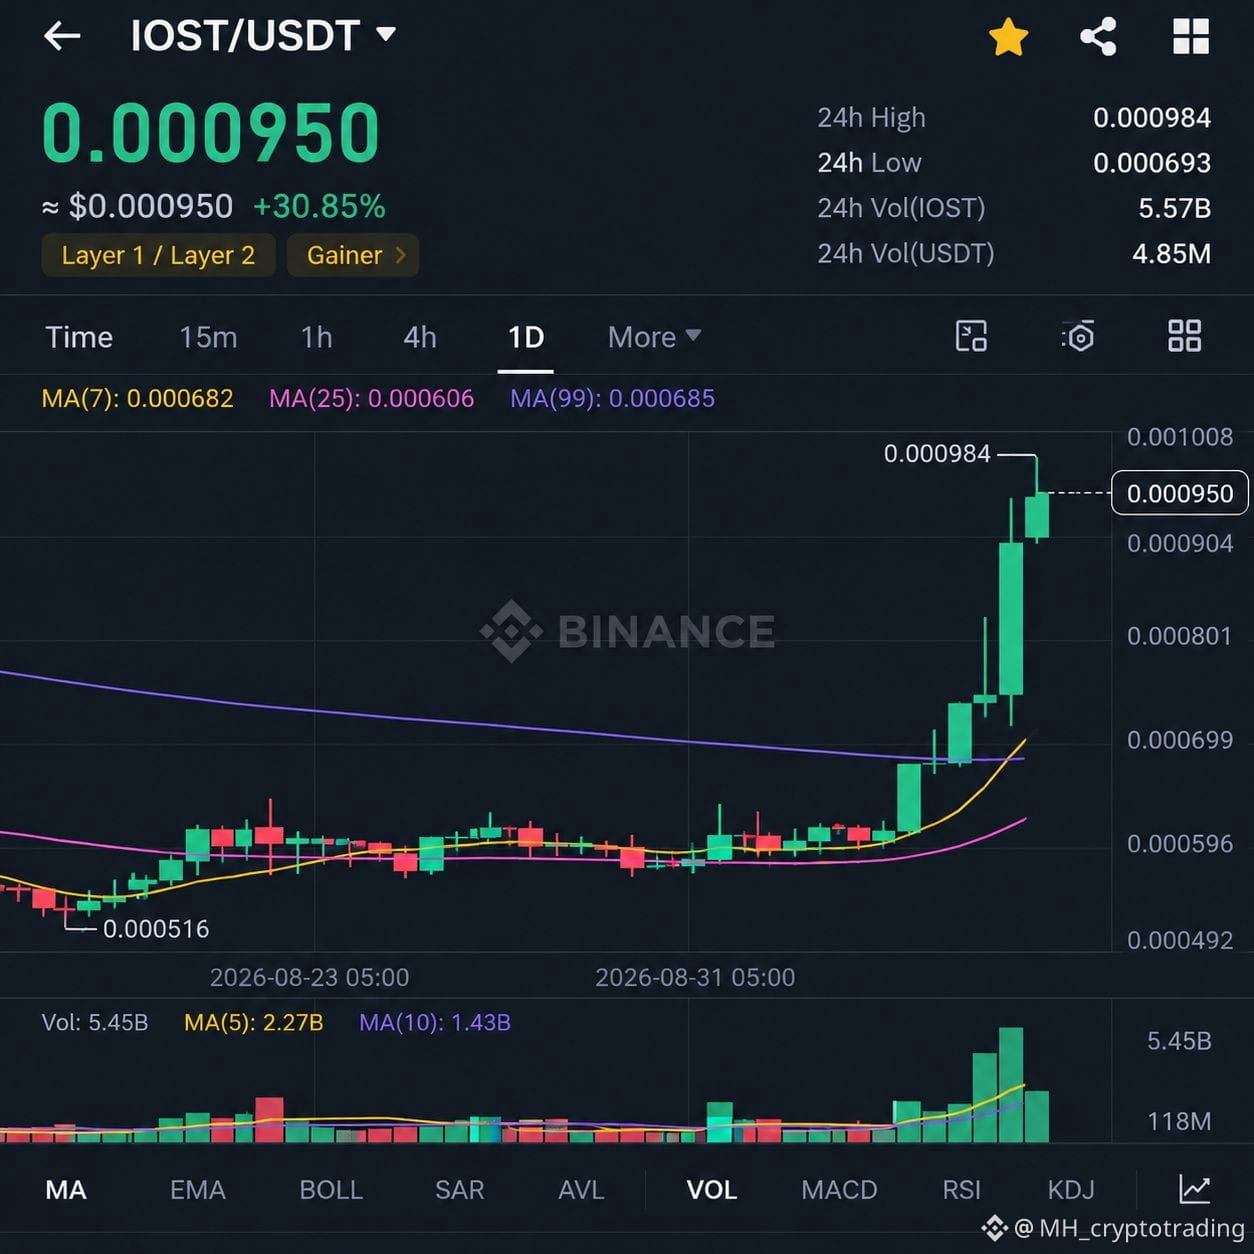
$IOST is showing a strong move on the 1D chart. The price is currently around 0.000950 USDT, up approximately 30.85% in 24 hours.
The chart shows a clear change in momentum. After moving sideways around the 0.00055–0.00060 area for several days, $IOST T started forming larger green candles, indicating stronger buying pressure. The biggest move is also supported by a sharp increase in trading volume, which makes the recent price action more noticeable.
$IOST is now trading above the MA(7), MA(25), and MA(99), showing strong short-term momentum. However, the price is approaching the 24h high of 0.000984, which could act as resistance.
{future}(IOTAUSDT)
$IOST is showing a strong move on the 1D chart. The price is currently around 0.000950 USDT, up approximately 30.85% in 24 hours.
The chart shows a clear change in momentum. After moving sideways around the 0.00055–0.00060 area for several days, $IOST T started forming larger green candles, indicating stronger buying pressure. The biggest move is also supported by a sharp increase in trading volume, which makes the recent price action more noticeable.
$IOST is now trading above the MA(7), MA(25), and MA(99), showing strong short-term momentum. However, the price is approaching the 24h high of 0.000984, which could act as resistance.
$IOST is showing a strong move on the 1D chart. The price is currently around 0.000950 USDT, up approximately 30.85% in 24 hours.
The chart shows a clear change in momentum. After moving sideways around the 0.00055–0.00060 area for several days, $IOST T started forming larger green candles, indicating stronger buying pressure. The biggest move is also supported by a sharp increase in trading volume, which makes the recent price action more noticeable.
$IOST is now trading above the MA(7), MA(25), and MA(99), showing strong short-term momentum. However, the price is approaching the 24h high of 0.000984, which could act as resistance.
1
164
·
--
ブリッシュ
翻訳参照
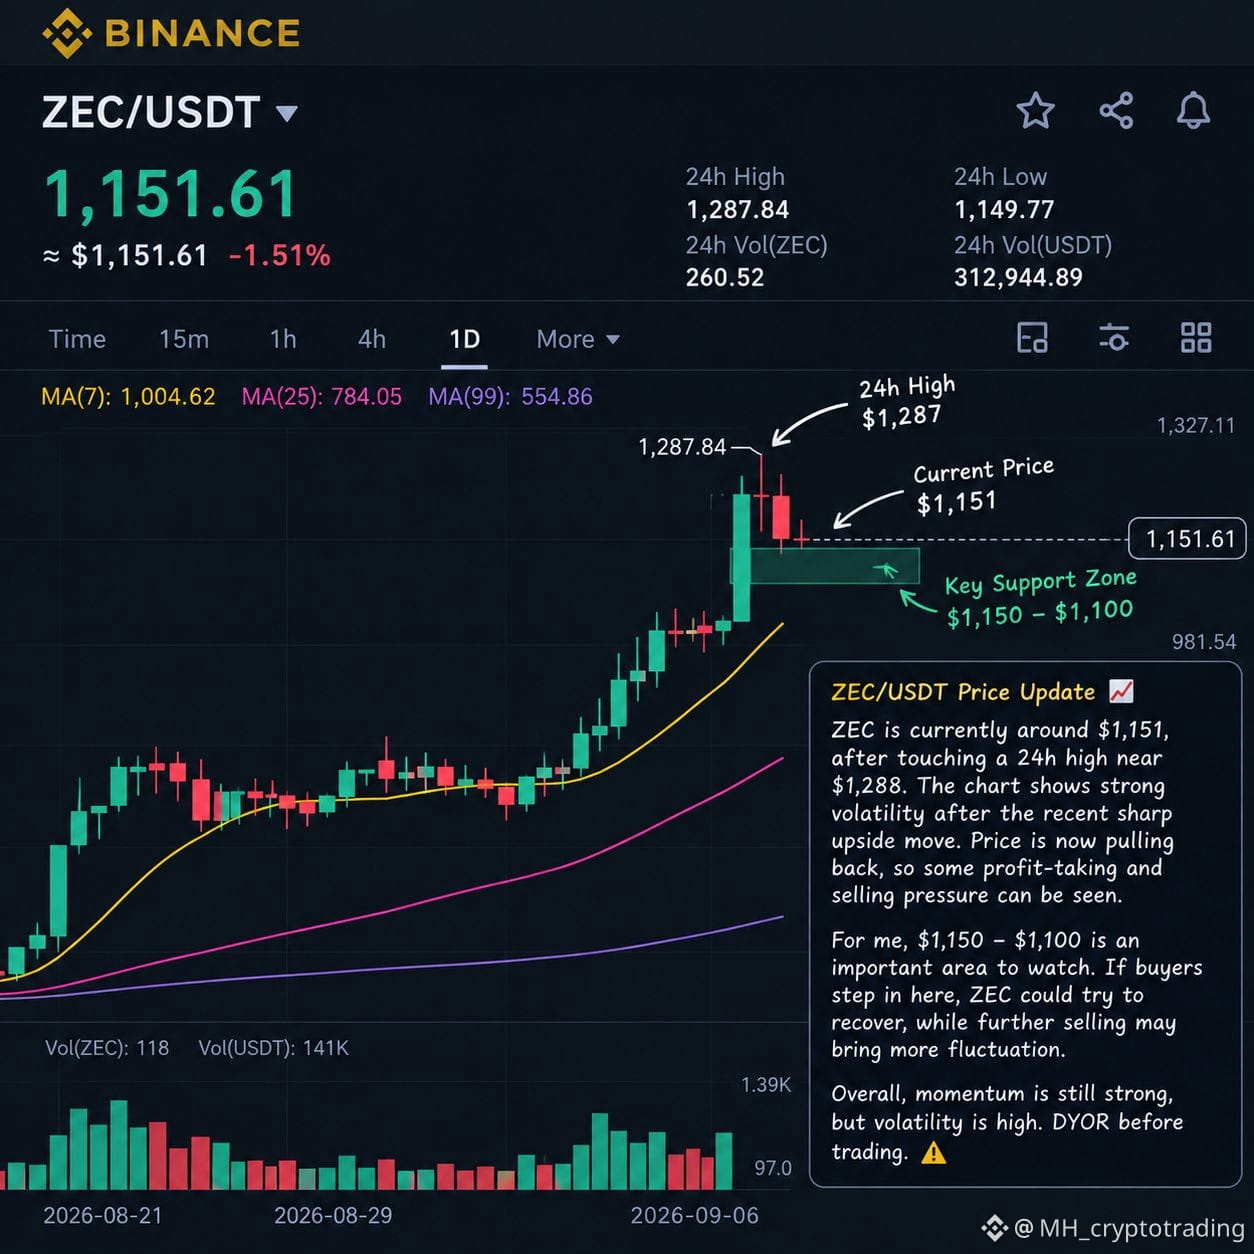
$ZEC is currently around $1,151, after touching a 24h high near $1,288. The chart shows strong volatility after the recent sharp upside move. Price is now pulling back, so some profit-taking and selling pressure can be seen.
For me, $1,150–$1,100 is an important area to watch. If buyers step in here, ZEC could try to recover, while further selling may bring more fluctuation. Overall, momentum is still strong, but volatility is high.
{future}(ZECUSDT)
$ZEC
{future}(BNBUSDT)
$BNB
$ZEC is currently around $1,151, after touching a 24h high near $1,288. The chart shows strong volatility after the recent sharp upside move. Price is now pulling back, so some profit-taking and selling pressure can be seen.
For me, $1,150–$1,100 is an important area to watch. If buyers step in here, ZEC could try to recover, while further selling may bring more fluctuation. Overall, momentum is still strong, but volatility is high.
$ZEC
$BNB
For me, $1,150–$1,100 is an important area to watch. If buyers step in here, ZEC could try to recover, while further selling may bring more fluctuation. Overall, momentum is still strong, but volatility is high.
$ZEC
$BNB
1
2
201
記事
翻訳参照
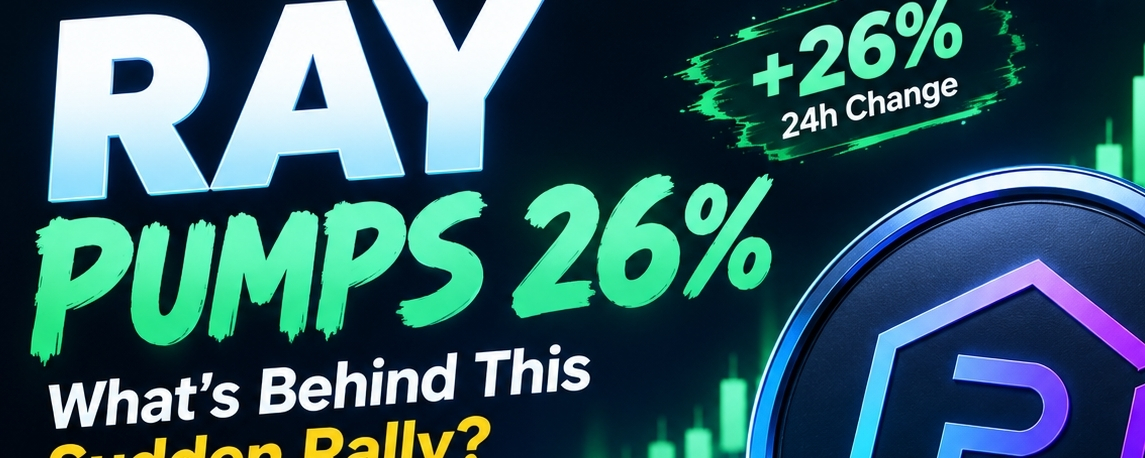
RAY BReaks higher- Can It reach $1.44 again????$RAY is showing a strong move, trading around $1.23, up roughly 26% in 24 hours. The coin recently touched a 24h high of $1.44, supported by a sharp increase in trading volume.
One reason behind this pump is increased activity around Raydium’s LaunchLab. The recent integration of StonkFun with Raydium LaunchLab has brought more attention, token-launch activity and trading volume to the Raydium ecosystem.
Another positive factor is RAY’s buyback mechanism. When Raydium generates more protocol activity and fees, buybacks can potentially create additional demand for RAY.
📊 Key levels from the chart: • Price: ~$1.23
• 24h Change: +26%
• 24h High: $1.4428
• 24h Volume: ~$41.84M USDT
• MA(7): $1.2152
• MA(25): $0.9416
• MA(99): $0.8254
Technically, RAY remains above its major moving averages, showing strong momentum. However, after such a rapid pump, profit-taking and a pullback are possible.
I’m watching $1.20–$1.21 as support and $1.44 as key resistance. A strong breakout above $1.44 with high volume could bring further upside.
{spot}(RAYUSDT)
#ray #mhcrypotrsding
RAY BReaks higher- Can It reach $1.44 again????
$RAY is showing a strong move, trading around $1.23, up roughly 26% in 24 hours. The coin recently touched a 24h high of $1.44, supported by a sharp increase in trading volume.
One reason behind this pump is increased activity around Raydium’s LaunchLab. The recent integration of StonkFun with Raydium LaunchLab has brought more attention, token-launch activity and trading volume to the Raydium ecosystem.
Another positive factor is RAY’s buyback mechanism. When Raydium generates more protocol activity and fees, buybacks can potentially create additional demand for RAY.
📊 Key levels from the chart: • Price: ~$1.23
• 24h Change: +26%
• 24h High: $1.4428
• 24h Volume: ~$41.84M USDT
• MA(7): $1.2152
• MA(25): $0.9416
• MA(99): $0.8254
Technically, RAY remains above its major moving averages, showing strong momentum. However, after such a rapid pump, profit-taking and a pullback are possible.
I’m watching $1.20–$1.21 as support and $1.44 as key resistance. A strong breakout above $1.44 with high volume could bring further upside.
#ray #mhcrypotrsding
One reason behind this pump is increased activity around Raydium’s LaunchLab. The recent integration of StonkFun with Raydium LaunchLab has brought more attention, token-launch activity and trading volume to the Raydium ecosystem.
Another positive factor is RAY’s buyback mechanism. When Raydium generates more protocol activity and fees, buybacks can potentially create additional demand for RAY.
📊 Key levels from the chart: • Price: ~$1.23
• 24h Change: +26%
• 24h High: $1.4428
• 24h Volume: ~$41.84M USDT
• MA(7): $1.2152
• MA(25): $0.9416
• MA(99): $0.8254
Technically, RAY remains above its major moving averages, showing strong momentum. However, after such a rapid pump, profit-taking and a pullback are possible.
I’m watching $1.20–$1.21 as support and $1.44 as key resistance. A strong breakout above $1.44 with high volume could bring further upside.
#ray #mhcrypotrsding
1
102
記事
翻訳参照
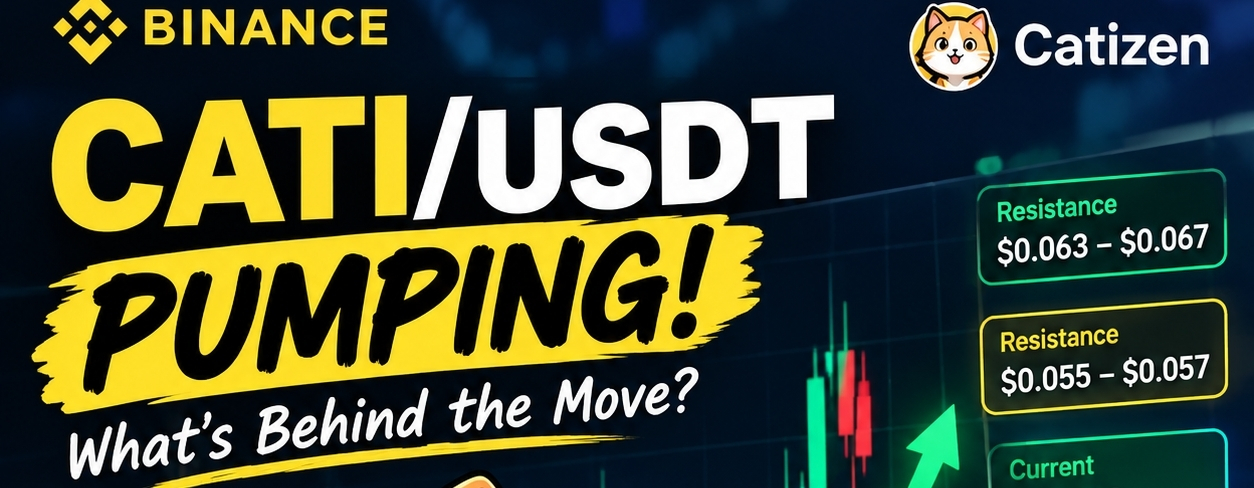
Why CATI price pumps??? no$CATI has been showing some interesting price action lately. After dropping toward the $0.048–$0.050 area, buyers started coming back in and the price bounced toward $0.053.
I think the main reason behind this move is the combination of buying pressure, higher trading activity and a technical rebound after the recent sell-off.
The $0.048–$0.050 zone looks important right now. Buyers managed to defend this area, which helped CATI recover. If the momentum continues, the first level I’m watching is around $0.055–$0.057.
If CATI can break that resistance with good volume, we could see another move toward the previous $0.063–$0.067 zone. 👀
But I wouldn’t call this a confirmed bullish reversal yet. $CATI is still highly volatile, and after a quick pump, another pullback is always possible.
For me, the key things to watch are volume, the $0.050 support and the $0.057 resistance.
{spot}(CATIUSDT)
#CATI #cati
Why CATI price pumps??? no
$CATI has been showing some interesting price action lately. After dropping toward the $0.048–$0.050 area, buyers started coming back in and the price bounced toward $0.053.
I think the main reason behind this move is the combination of buying pressure, higher trading activity and a technical rebound after the recent sell-off.
The $0.048–$0.050 zone looks important right now. Buyers managed to defend this area, which helped CATI recover. If the momentum continues, the first level I’m watching is around $0.055–$0.057.
If CATI can break that resistance with good volume, we could see another move toward the previous $0.063–$0.067 zone. 👀
But I wouldn’t call this a confirmed bullish reversal yet. $CATI is still highly volatile, and after a quick pump, another pullback is always possible.
For me, the key things to watch are volume, the $0.050 support and the $0.057 resistance.
#CATI #cati
I think the main reason behind this move is the combination of buying pressure, higher trading activity and a technical rebound after the recent sell-off.
The $0.048–$0.050 zone looks important right now. Buyers managed to defend this area, which helped CATI recover. If the momentum continues, the first level I’m watching is around $0.055–$0.057.
If CATI can break that resistance with good volume, we could see another move toward the previous $0.063–$0.067 zone. 👀
But I wouldn’t call this a confirmed bullish reversal yet. $CATI is still highly volatile, and after a quick pump, another pullback is always possible.
For me, the key things to watch are volume, the $0.050 support and the $0.057 resistance.
#CATI #cati
1
120
·
--
ブリッシュ
翻訳参照
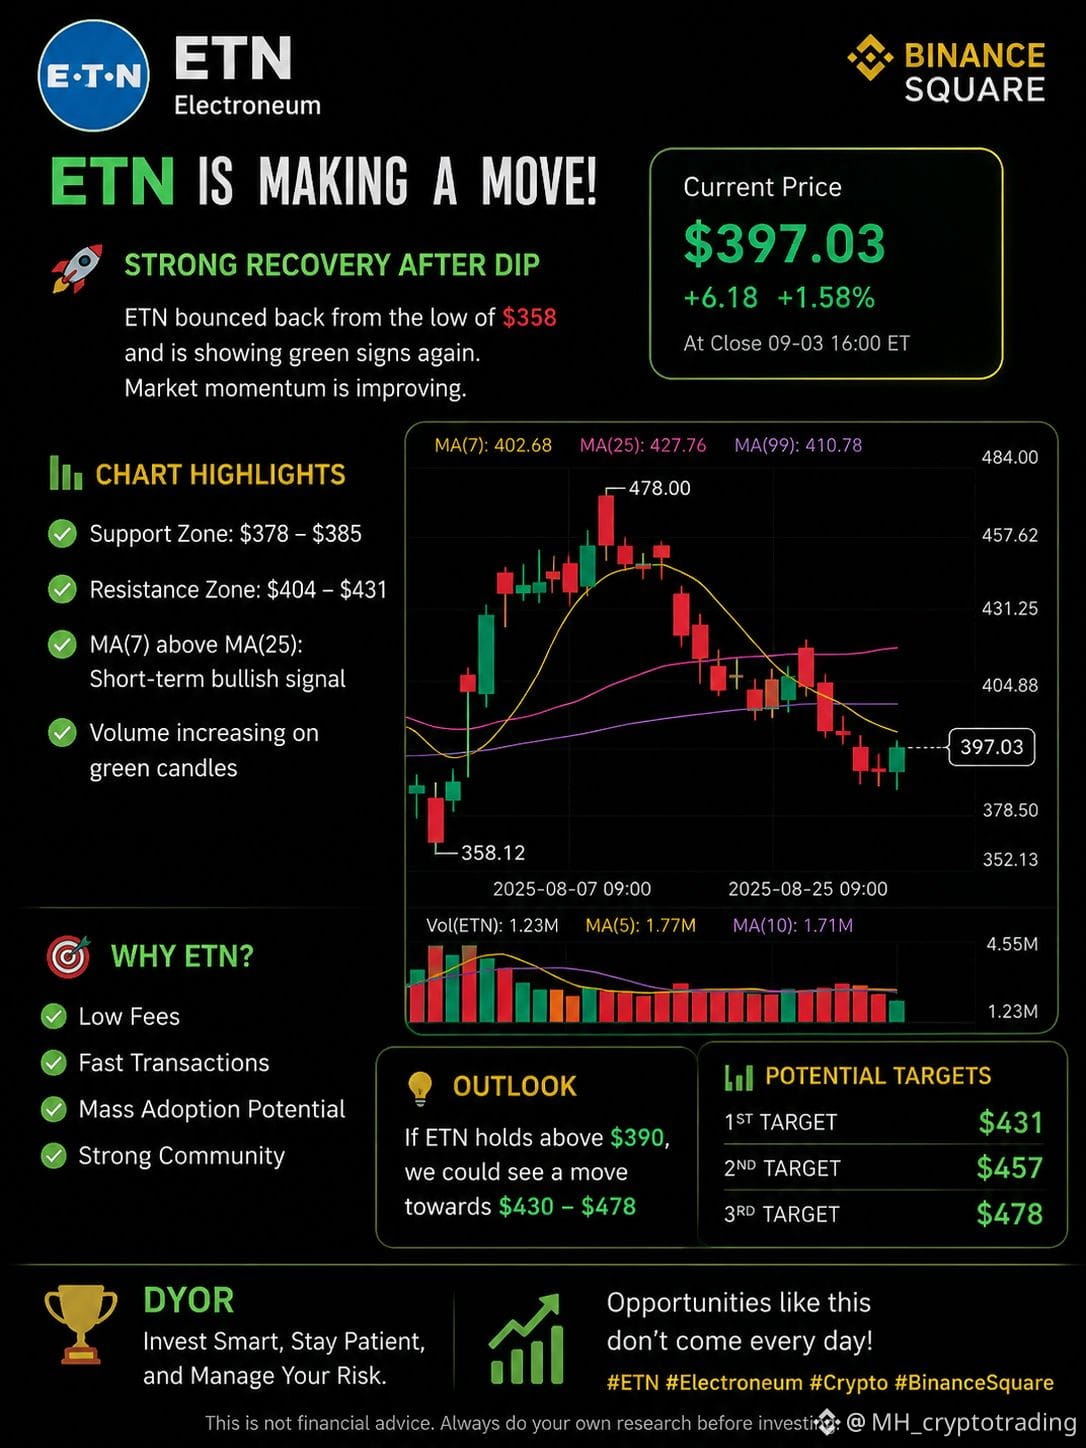
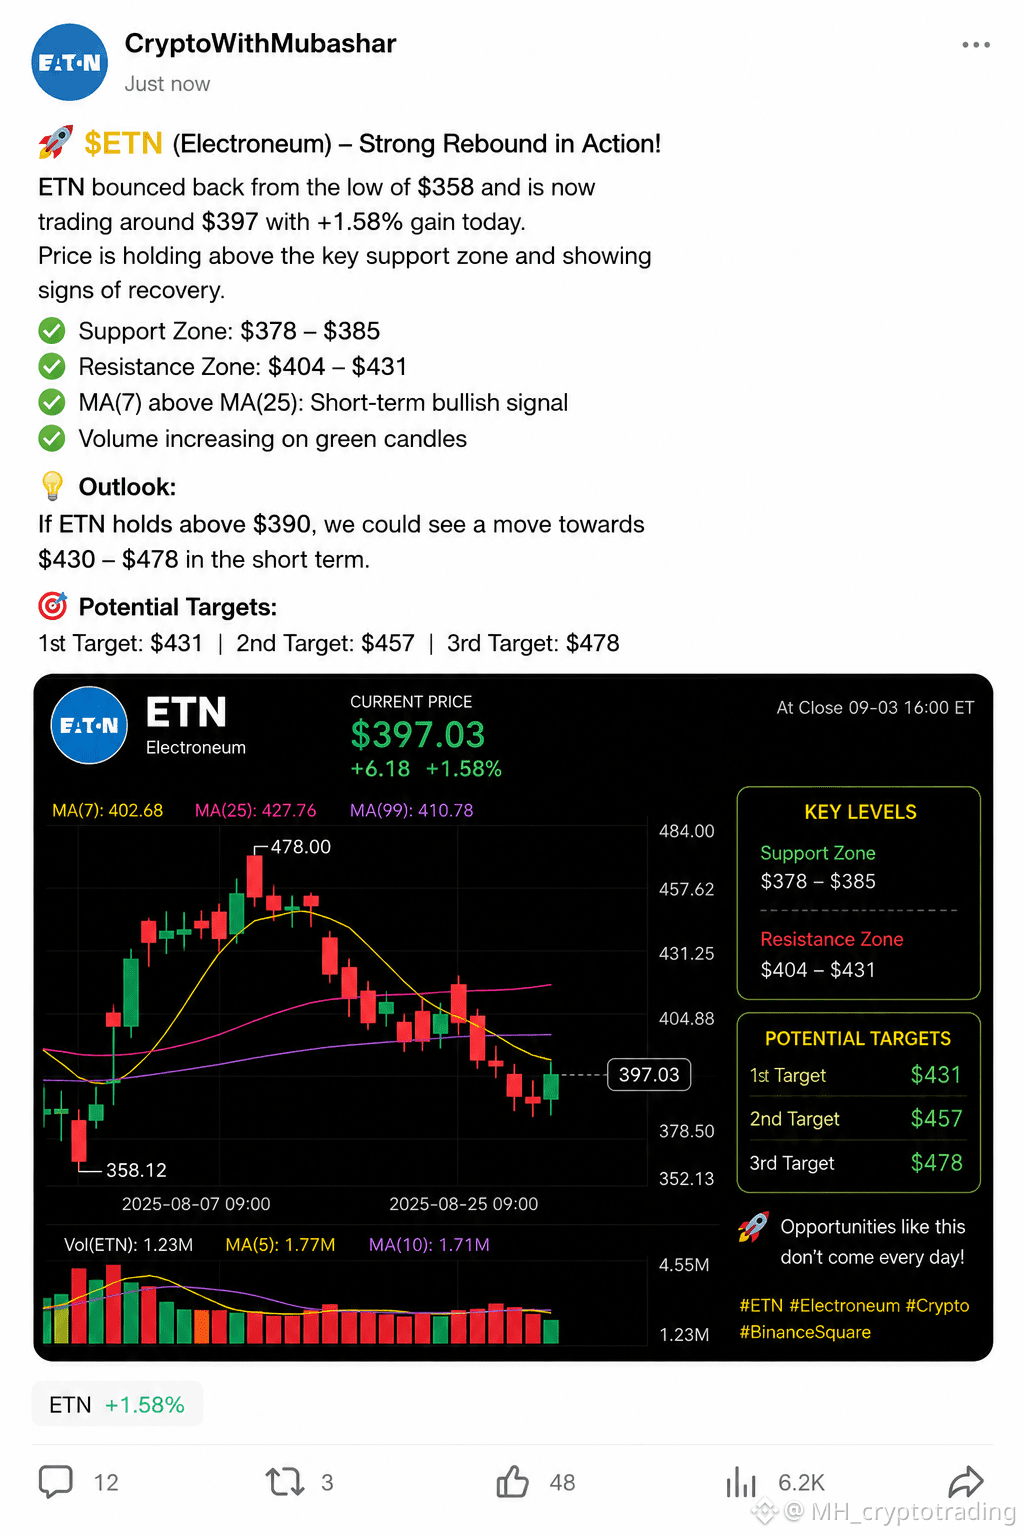
$ETN.US best time to enter. Price of $ETN.US is low due to US attack on iralast night.
{spot}(ETHUSDT)
$ETN.US best time to enter. Price of $ETN.US is low due to US attack on iralast night.
1
231
·
--
ブリッシュ
$ETN.US 良い時期に入る。イランへの米国攻撃により価格が低い。$ETN.US
{future}(ETHUSDT)
$ETN.US 良い時期に入る。イランへの米国攻撃により価格が低い。$ETN.US
2
290
ログインして、さらにコンテンツを読む
厳選トピックで世界の暗号資産トレーダーの仲間入り
⚡️ 暗号資産に関する最新かつ有益な情報が見つかります。
💬 世界最大の暗号資産取引所から信頼されています。
👍 認証を受けたクリエイターから、有益なインサイトを得られます。
メール / 電話番号
トレンドトピック
BNBSurpasses$790
閲覧回数 16,689
140人が討論中
$BNB 戦略的なロングプラン -> 今すぐFOCUS
BNBは内部の流動性を取り込んだ後、強い安値を2つ作りました
$815-$830のスイングハイ方向への動きを見込んでおり、グリーンボックスのリテストでロングを狙っています
#BNBSurpasses$790 #bnb
Ghost Writer
·いいね:6件
·閲覧回数 8.2k
ZamaRises15.99%ToIntradayHigh$0.09
閲覧回数 14,263
104人が討論中
BitcoinSpotETFsDraw$6.34BInflowsInQ3
閲覧回数 5,533
89人が討論中