

MAFIA COINS FAMILY
393 投稿

MAFIA COINS FAMILY
報告
ユーザーをブロック
170 フォロー
142 フォロワー
56 いいね
投稿
すべて
引用
#earningsseasons $XAUT
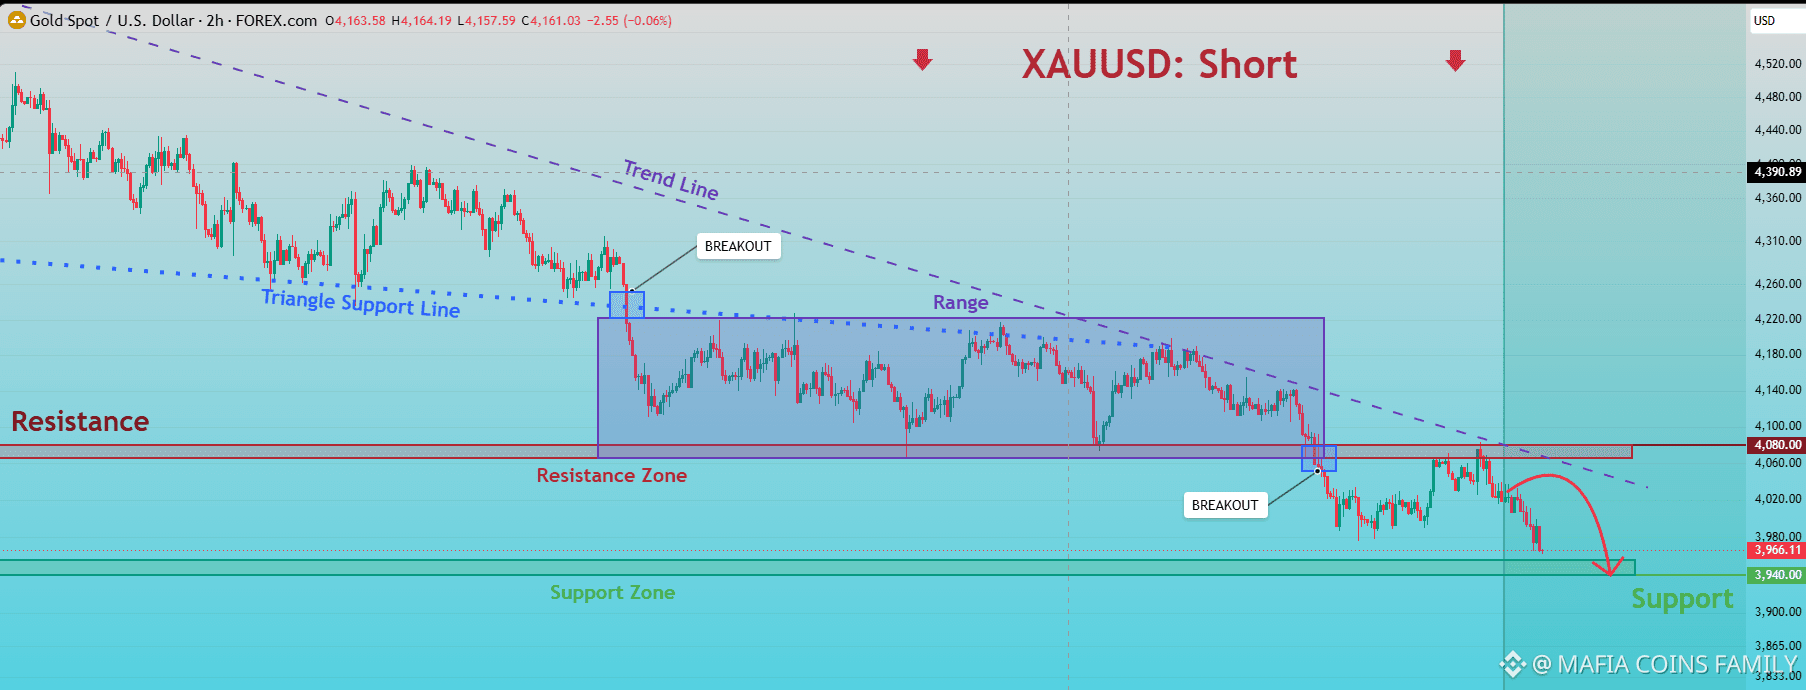
XAUUSDT(金)– 2時間足テクニカル分析
重要な動きは4つあります。
金価格は高値を切り下げながら、下降三角形を形成しました。
4,220ドル付近の三角形のサポートを下抜けました。
価格は約4,060~4,220ドルの間で保ち合いました。
4,060~4,080ドルを再び下抜けたことで、さらなる下落圧力が確認されました。
これまでのサポートは、現在レジスタンスに転じています。
重要な価格水準
価格
テクニカル上の意味
4,220ドル
主要レンジのレジスタンス
4,080~4,060ドル
大きく下抜けたサポート/レジスタンス
4,020ドル
小幅なレジスタンス
3,980ドル
短期サポート
3,940ドル
目先の主要サポート
3,900ドル
次の下値目標
3,865~3,833ドル
下方のサポートエリア
下落継続
弱気シナリオ
金価格が3,940ドルを下回る。
2時間足のローソク足がサポートを下回って確定する。
3,940~3,960ドルへの戻りが失敗する。
想定目標:
3,900ドル
3,865ドル
3,833ドル
この展開は、あなたの弱気予測を裏付けるでしょう。
一時的な反発
逆張りの反発
$XAU
{future}(XAUUSDT)
3,940ドルが維持された場合:
金価格は3,980ドル付近まで回復する可能性があります。
次のレジスタンス:4,020ドル。
より強いレジスタンス:4,060~4,080ドル。
反発だけでは弱気トレンドは反転しません。弱気の構造を崩すには、金価格が4,080ドルを明確に回復する必要があります。
サポート割れと反転
金価格は一時的に3,940ドルを下回ってストップロスを誘発した後、この水準を上回る可能性があります。
次の点に注目してください:
長い下ヒゲ。
強い買いの2時間足ローソク。
3,960~3,980ドルの回復。
これが確認されれば、明確なブレイクダウンではなく、流動性の掃討だった可能性を示します。
{future}(XAUTUSDT)
#earningsseasons $XAUT
XAUUSDT(金)– 2時間足テクニカル分析
重要な動きは4つあります。
金価格は高値を切り下げながら、下降三角形を形成しました。
4,220ドル付近の三角形のサポートを下抜けました。
価格は約4,060~4,220ドルの間で保ち合いました。
4,060~4,080ドルを再び下抜けたことで、さらなる下落圧力が確認されました。
これまでのサポートは、現在レジスタンスに転じています。
重要な価格水準
価格
テクニカル上の意味
4,220ドル
主要レンジのレジスタンス
4,080~4,060ドル
大きく下抜けたサポート/レジスタンス
4,020ドル
小幅なレジスタンス
3,980ドル
短期サポート
3,940ドル
目先の主要サポート
3,900ドル
次の下値目標
3,865~3,833ドル
下方のサポートエリア
下落継続
弱気シナリオ
金価格が3,940ドルを下回る。
2時間足のローソク足がサポートを下回って確定する。
3,940~3,960ドルへの戻りが失敗する。
想定目標:
3,900ドル
3,865ドル
3,833ドル
この展開は、あなたの弱気予測を裏付けるでしょう。
一時的な反発
逆張りの反発
$XAU
3,940ドルが維持された場合:
金価格は3,980ドル付近まで回復する可能性があります。
次のレジスタンス:4,020ドル。
より強いレジスタンス:4,060~4,080ドル。
反発だけでは弱気トレンドは反転しません。弱気の構造を崩すには、金価格が4,080ドルを明確に回復する必要があります。
サポート割れと反転
金価格は一時的に3,940ドルを下回ってストップロスを誘発した後、この水準を上回る可能性があります。
次の点に注目してください:
長い下ヒゲ。
強い買いの2時間足ローソク。
3,960~3,980ドルの回復。
これが確認されれば、明確なブレイクダウンではなく、流動性の掃討だった可能性を示します。
2
688
翻訳参照
Security Incident Update
Security Incident Update


Binance Announcement
·
--
セキュリティインシデントに関する最新情報(2026-10-30)
これは一般的なお知らせです。ここで言及する商品やサービスは、お客様の地域ではご利用いただけない場合があります。
Binanceをご利用の皆様
Binanceによる初期調査では、今回のセキュリティインシデントには、DevOpsエンジニアのノートパソコンが侵害されたことが関与している可能性が示されています。これにより攻撃者はサービスコンテナにアクセスし、不正な出金取引を送信できたとみられます。ウォレットの秘密鍵が漏洩した証拠は確認されていません。調査が完了し、事実関係が十分に確認され次第、詳細な技術的事後報告を共有します。
Binanceをご利用の皆様
Binanceによる初期調査では、今回のセキュリティインシデントには、DevOpsエンジニアのノートパソコンが侵害されたことが関与している可能性が示されています。これにより攻撃者はサービスコンテナにアクセスし、不正な出金取引を送信できたとみられます。ウォレットの秘密鍵が漏洩した証拠は確認されていません。調査が完了し、事実関係が十分に確認され次第、詳細な技術的事後報告を共有します。
89
翻訳参照
#earningsseasons $BTC $BTC $BTC
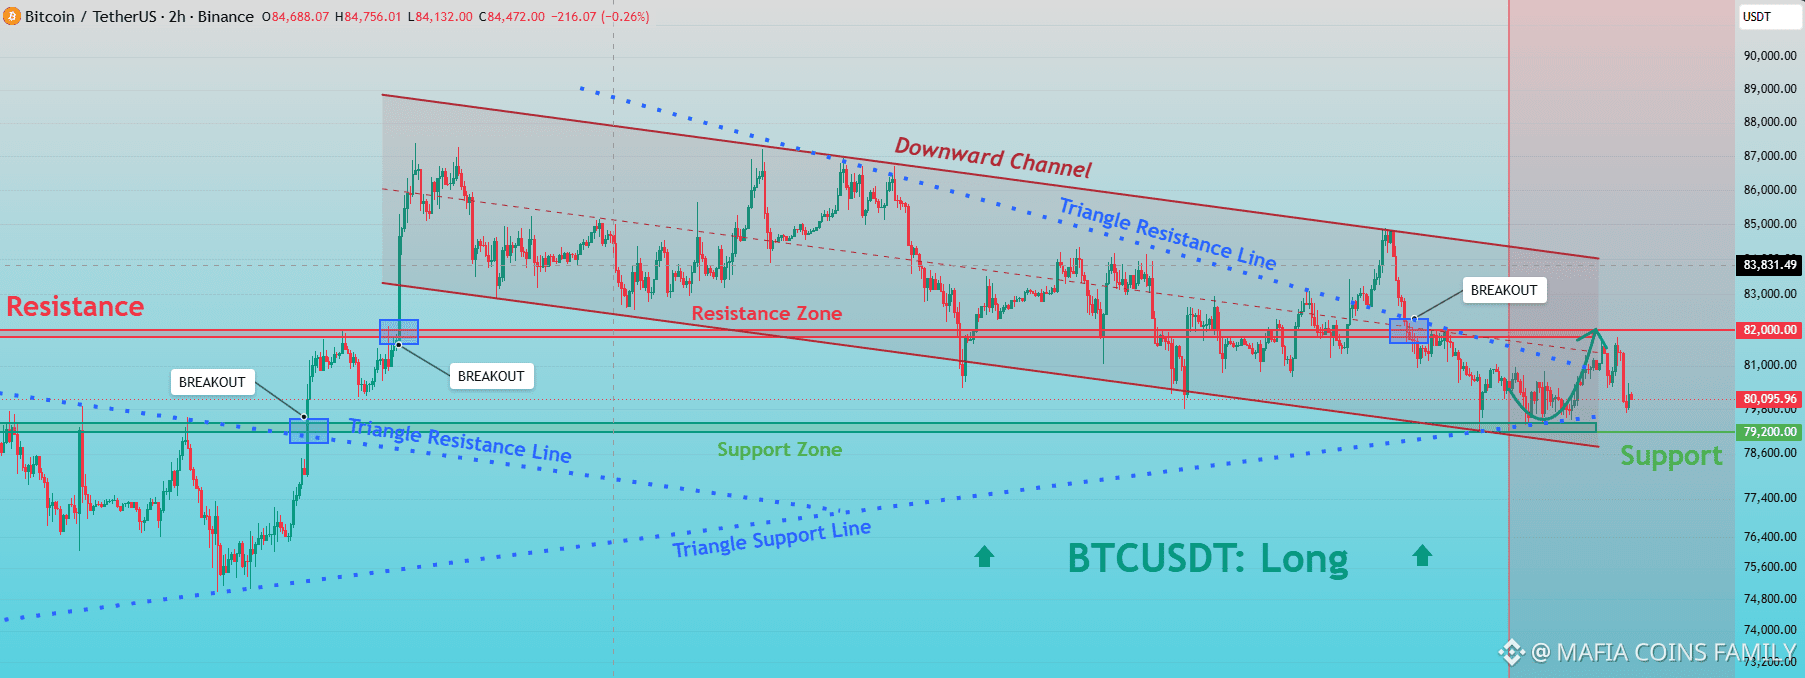
1. Key levels to watch
Resistance zone
$81,800–$82,200
Major reclaim level; previous support/resistance and possible rejection area.
Current price area
$80,000–$80,500
Price is near the lower consolidation area and needs to show whether buyers are defending it.
Major support zone
$79,200–$79,800
A breakdown and failed retest would weaken the bullish setup.
{spot}(BTCUSDT)
{future}(BTCUSDT)
#earningsseasons $BTC $BTC $BTC
1. Key levels to watch
Resistance zone
$81,800–$82,200
Major reclaim level; previous support/resistance and possible rejection area.
Current price area
$80,000–$80,500
Price is near the lower consolidation area and needs to show whether buyers are defending it.
Major support zone
$79,200–$79,800
A breakdown and failed retest would weaken the bullish setup.
57
$XAU
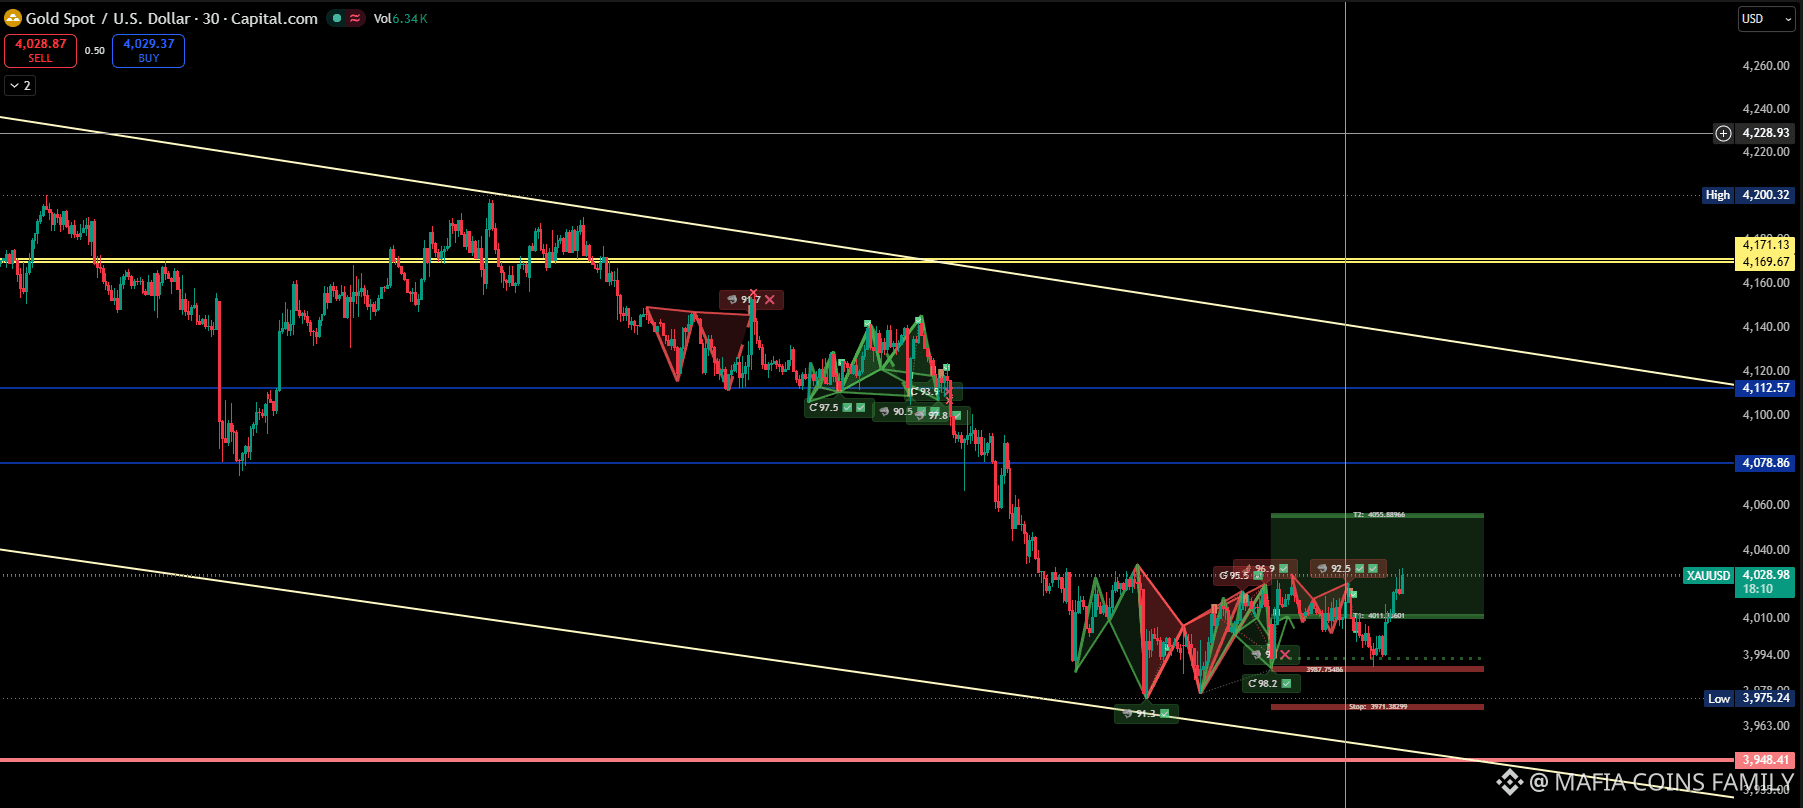
$XAUT 1. 重要なサポート水準とレジスタンス水準
価格帯
テクニカル上の意味
4,169–4,171
主要な上値抵抗
4,112.57
以前のサポート、現在はレジスタンス
4,078.86
中間的なレジスタンス
4,035–4,040
直近のブレイクアウト/反落ゾーン
4,010–4,015
短期サポート
3,990–3,994
局所的なサポートゾーン
3,975.24
直近チャート安値
3,948.41
下値サポート/下落目標水準
. 想定されるトレードシナリオ
シナリオA — 反落を確認して売る
優先する方向性
注目水準:4,030–4,040での反落。
確認条件:30分足のローソク足がこのゾーンで反落し、4,010を再び下回る。
目標値:3,994 → 3,975 → 3,948。
無効化条件:反落ゾーンを上回る水準で価格が定着すること。特に安値が切り上がる場合。
重要なのは、全体的なトレンドが弱気だからという理由だけで売るのではなく、反落を待つことです。
シナリオB — 短期的な強気反発
確認条件:30分足が4,040を上回って引け、その後のリテストに成功する。
目標値:4,055–4,060、その後4,078.86。
より強い回復:4,078.86を持続的に上抜ければ、強気シナリオが強まります。
無効化条件:ブレイクアウトに失敗し、4,010を下回る。
これは当初、トレンドに逆行するトレードであり、全体的な下降トレンドが反転した証拠ではありません。
{future}(XAUUSDT)
{spot}(XAUTUSDT)
$XAU
$XAUT 1. 重要なサポート水準とレジスタンス水準
価格帯
テクニカル上の意味
4,169–4,171
主要な上値抵抗
4,112.57
以前のサポート、現在はレジスタンス
4,078.86
中間的なレジスタンス
4,035–4,040
直近のブレイクアウト/反落ゾーン
4,010–4,015
短期サポート
3,990–3,994
局所的なサポートゾーン
3,975.24
直近チャート安値
3,948.41
下値サポート/下落目標水準
. 想定されるトレードシナリオ
シナリオA — 反落を確認して売る
優先する方向性
注目水準:4,030–4,040での反落。
確認条件:30分足のローソク足がこのゾーンで反落し、4,010を再び下回る。
目標値:3,994 → 3,975 → 3,948。
無効化条件:反落ゾーンを上回る水準で価格が定着すること。特に安値が切り上がる場合。
重要なのは、全体的なトレンドが弱気だからという理由だけで売るのではなく、反落を待つことです。
シナリオB — 短期的な強気反発
確認条件:30分足が4,040を上回って引け、その後のリテストに成功する。
目標値:4,055–4,060、その後4,078.86。
より強い回復:4,078.86を持続的に上抜ければ、強気シナリオが強まります。
無効化条件:ブレイクアウトに失敗し、4,010を下回る。
これは当初、トレンドに逆行するトレードであり、全体的な下降トレンドが反転した証拠ではありません。
334
$XAU
$XAU
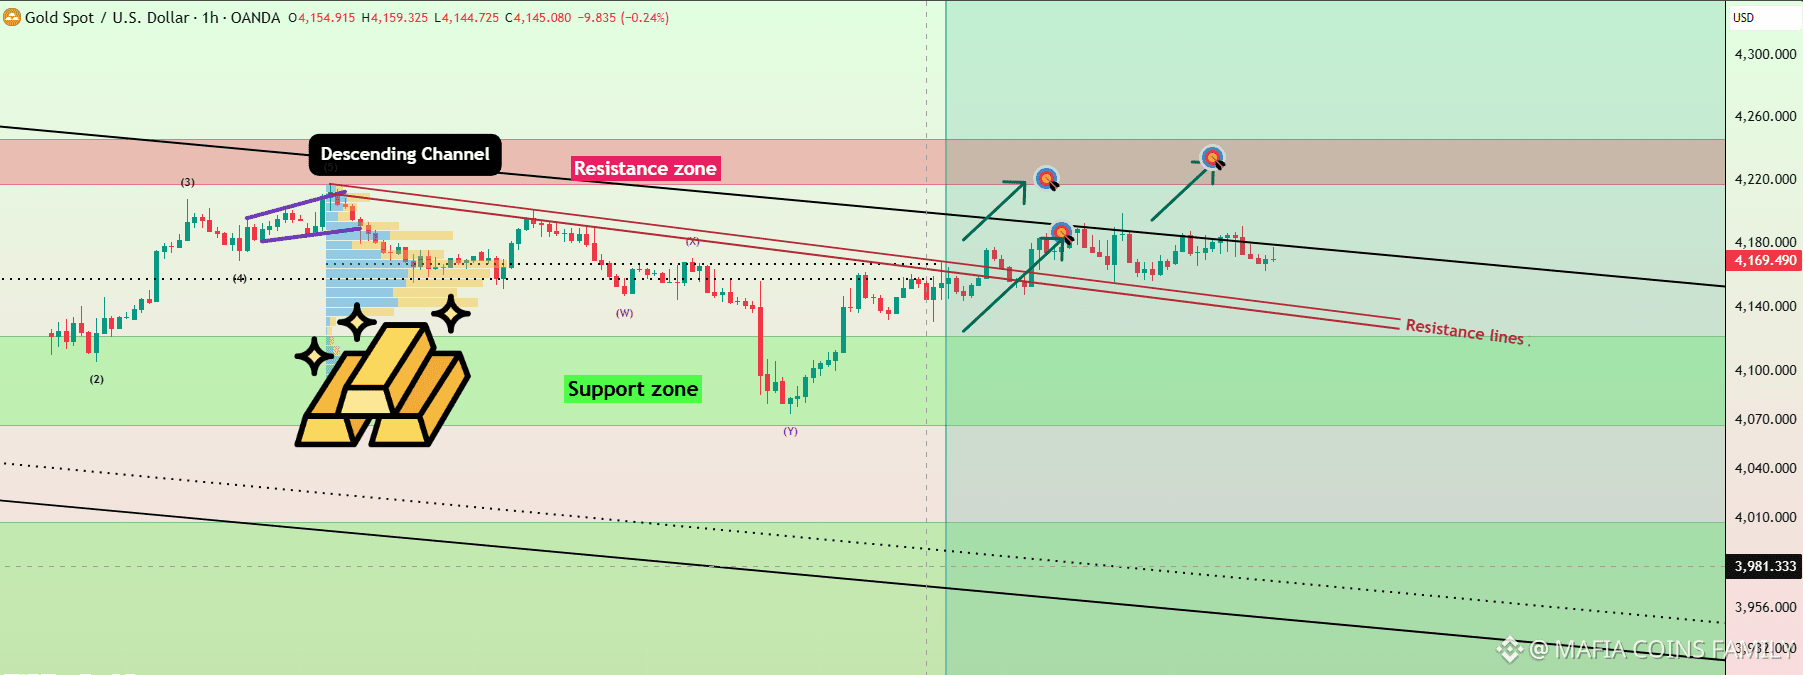
主要なレジスタンス
4,220–4,245
赤で強調されたゾーン。利益確定や反落が起こる可能性のあるエリア。
目先のレジスタンス
4,180–4,200
下降トレンドラインと直近のスイング高値が位置するエリア。価格がこの水準を再び上回る必要があります。
短期サポート
4,150–4,140
押し目や強気の反応を確認する最初のエリア。
主要なサポート
4,120–4,070
急反発が起きたエリアを含む、緑色の需要ゾーン。
2. 値動きが示していること
サポートからの回復:約4,080に向けた急落の後、力強く反発しました。買い手が需要ゾーンに入ったことがうかがえます。
レジスタンスは依然として有効:価格は主要な下降黒トレンドラインの下、またはその付近で推移しています。反発しただけでは、トレンド転換が確認されたとは言えません。
レジスタンス付近での値動きの収束:直近の4,160–4,190付近のローソク足は、比較的横ばいに推移しています。ここはブレイクアウトまたは反落が起こり得る判断局面です。
トレンド転換の確認には至らず:下降トレンドラインを上回る強い1H足の終値に続き、その水準へのリテストが成功すれば、強気への転換を示すより確かな根拠になります。
3. 想定されるトレードシナリオ
以下は条件付きのプランであり、リアルタイムの売買シグナルではありません。
シナリオ A — ブレイクアウトでの買い
強気
発動条件:強い1Hローソク足が4,190–4,200を上回って引ける。
エントリー案:ブレイクアウトした水準を上回って維持するリテストを待つ。
目標:4,220、次に4,240–4,245。
無効化条件:価格が再び回復した水準を下回る。ストップはリテストの値動きに基づいて設定します。
シナリオ B — レジスタンスでの反落を狙う売り
弱気
発動条件:4,180–4,200付近で明確な弱気の反落があり、その後、局所サポートを下抜ける。
エントリー案:サポートに直接売りを仕掛けるのではなく、反落が確認された後にのみ検討します。
目標:4,150、次に4,140。さらに下落が続けば4,120に達する可能性があります。
無効化条件:価格が反落時の高値を上抜け、その水準を維持する。
{future}(XAUTUSDT)
{future}(XAUUSDT)
$XAU
$XAU
主要なレジスタンス
4,220–4,245
赤で強調されたゾーン。利益確定や反落が起こる可能性のあるエリア。
目先のレジスタンス
4,180–4,200
下降トレンドラインと直近のスイング高値が位置するエリア。価格がこの水準を再び上回る必要があります。
短期サポート
4,150–4,140
押し目や強気の反応を確認する最初のエリア。
主要なサポート
4,120–4,070
急反発が起きたエリアを含む、緑色の需要ゾーン。
2. 値動きが示していること
サポートからの回復:約4,080に向けた急落の後、力強く反発しました。買い手が需要ゾーンに入ったことがうかがえます。
レジスタンスは依然として有効:価格は主要な下降黒トレンドラインの下、またはその付近で推移しています。反発しただけでは、トレンド転換が確認されたとは言えません。
レジスタンス付近での値動きの収束:直近の4,160–4,190付近のローソク足は、比較的横ばいに推移しています。ここはブレイクアウトまたは反落が起こり得る判断局面です。
トレンド転換の確認には至らず:下降トレンドラインを上回る強い1H足の終値に続き、その水準へのリテストが成功すれば、強気への転換を示すより確かな根拠になります。
3. 想定されるトレードシナリオ
以下は条件付きのプランであり、リアルタイムの売買シグナルではありません。
シナリオ A — ブレイクアウトでの買い
強気
発動条件:強い1Hローソク足が4,190–4,200を上回って引ける。
エントリー案:ブレイクアウトした水準を上回って維持するリテストを待つ。
目標:4,220、次に4,240–4,245。
無効化条件:価格が再び回復した水準を下回る。ストップはリテストの値動きに基づいて設定します。
シナリオ B — レジスタンスでの反落を狙う売り
弱気
発動条件:4,180–4,200付近で明確な弱気の反落があり、その後、局所サポートを下抜ける。
エントリー案:サポートに直接売りを仕掛けるのではなく、反落が確認された後にのみ検討します。
目標:4,150、次に4,140。さらに下落が続けば4,120に達する可能性があります。
無効化条件:価格が反落時の高値を上抜け、その水準を維持する。

179
翻訳参照
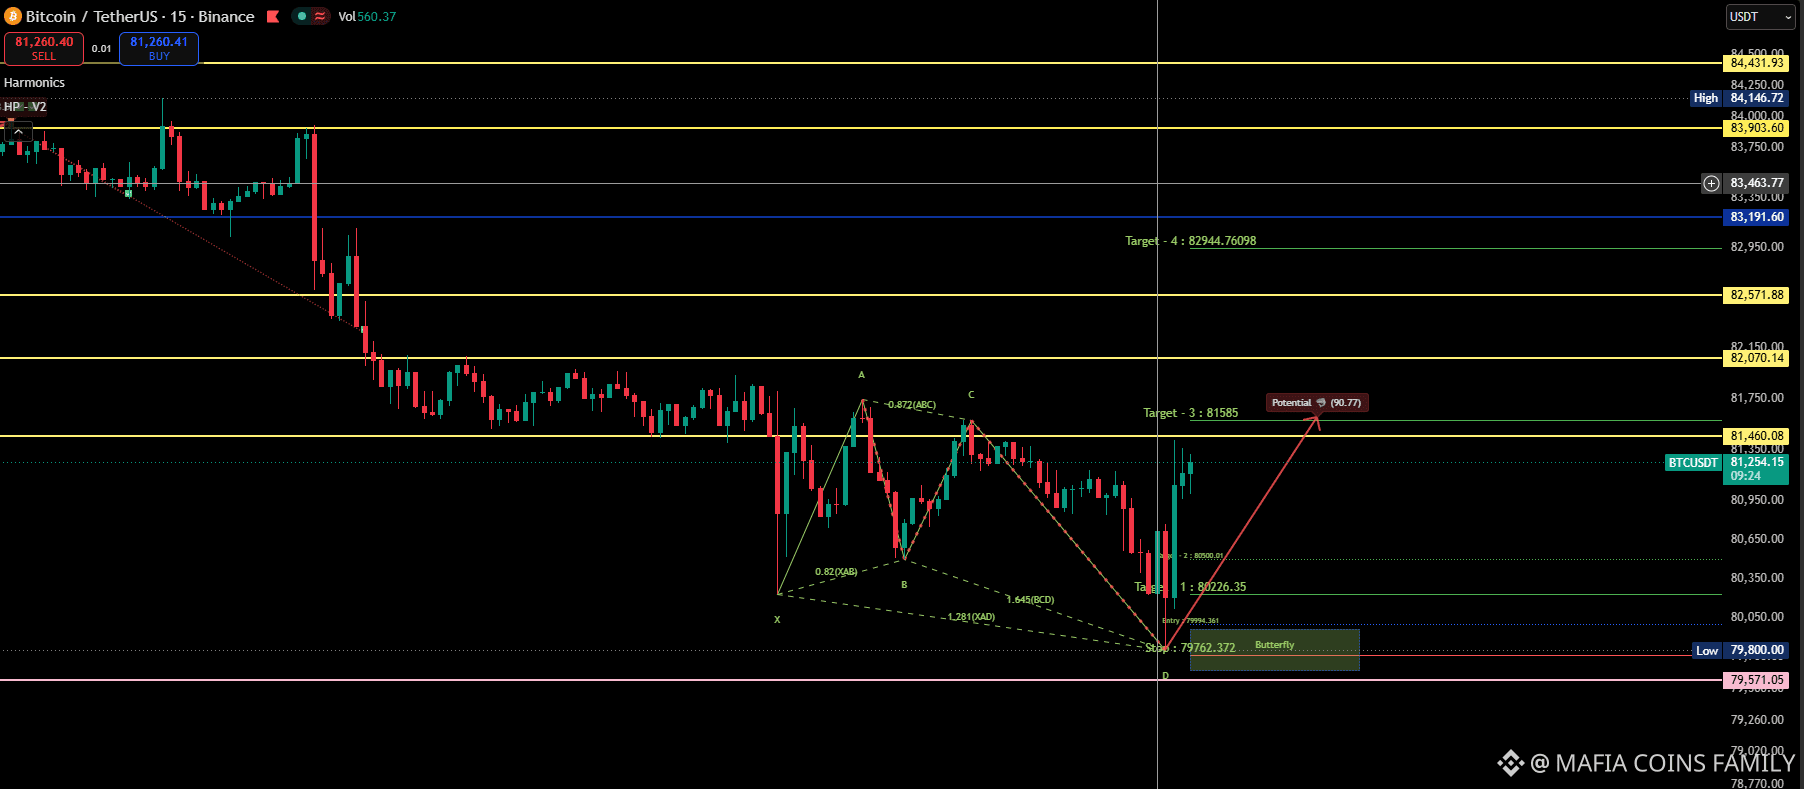
$BTC Harmonic Butterfly pattern
Your chart marks a potential bullish Butterfly completion near point D around 79,762.
X–A–B–C–D: The projected harmonic structure identifies a possible reversal zone.
D zone: The sharp reaction from around 79,800 supports the possibility that buyers are defending this level.
Projected rebound: The red arrow points toward approximately 81,585, which is a plausible first major recovery target if momentum continues.
Important: a harmonic pattern is a setup, not confirmation. The bounce alone does not prove that the low is in.
BTC closes a 15-minute candle above 81,460–81,585 and successfully retests that zone as support.
{future}(BTCDOMUSDT)
First upside objective: 82,070
Next objective: 82,572
Extended objective: 82,945
A breakout without a successful retest can still fail.👍👍👍👍
{future}(BTCUSDT)
$BTC Harmonic Butterfly pattern
Your chart marks a potential bullish Butterfly completion near point D around 79,762.
X–A–B–C–D: The projected harmonic structure identifies a possible reversal zone.
D zone: The sharp reaction from around 79,800 supports the possibility that buyers are defending this level.
Projected rebound: The red arrow points toward approximately 81,585, which is a plausible first major recovery target if momentum continues.
Important: a harmonic pattern is a setup, not confirmation. The bounce alone does not prove that the low is in.
BTC closes a 15-minute candle above 81,460–81,585 and successfully retests that zone as support.
First upside objective: 82,070
Next objective: 82,572
Extended objective: 82,945
A breakout without a successful retest can still fail.👍👍👍👍
70
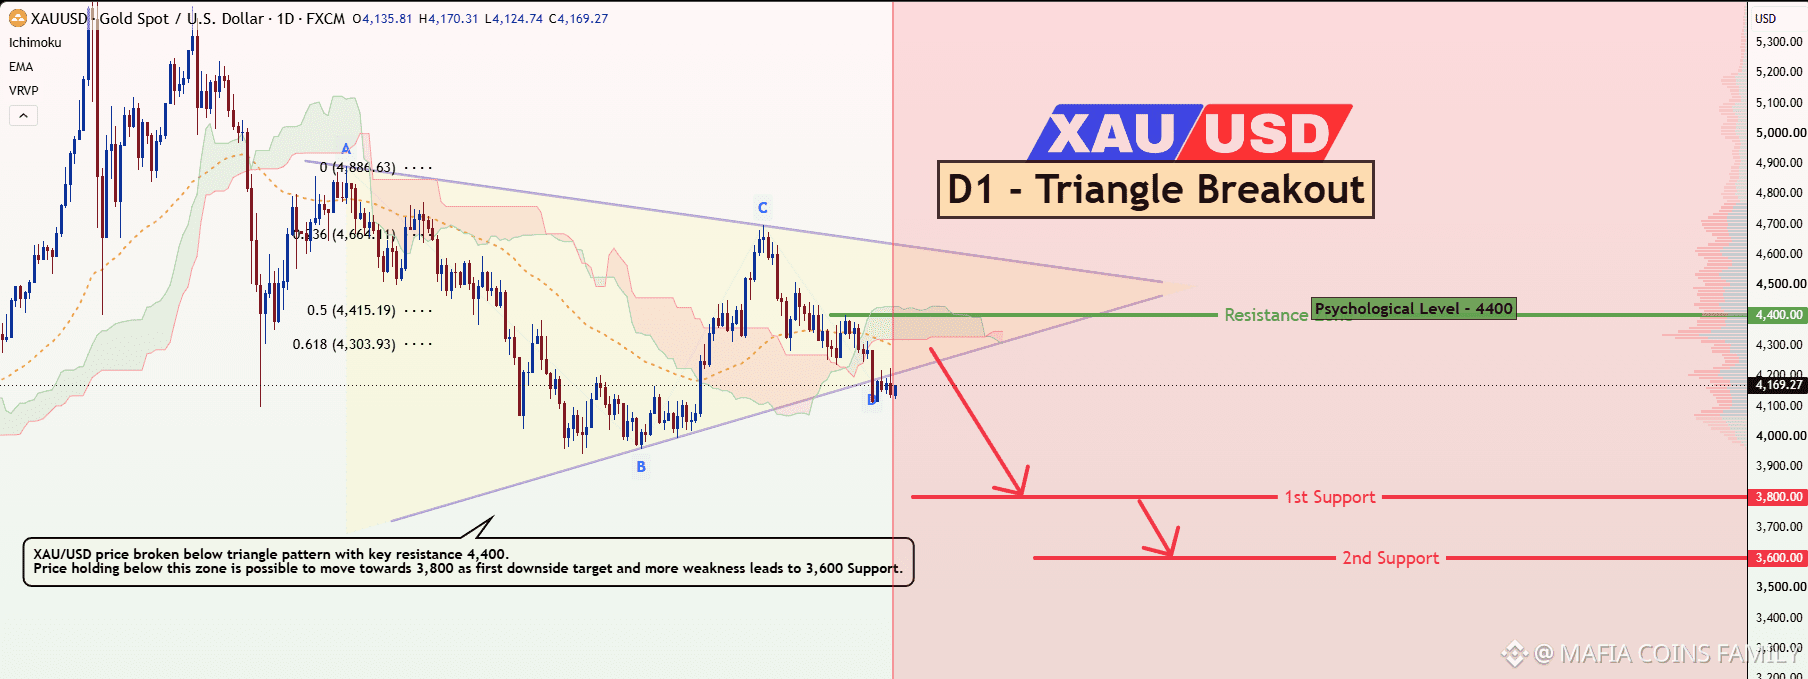
$XAU 現在の構造
現在価格:約4,169
主な心理的抵抗帯:4,400
三角持ち合いのサポート/トレンドラインを下抜けました。
直近のスイング構造では高値が切り下がっており、一方で、より大きな三角持ち合いの中では価格が収束していました。
一目均衡表も、現在価格付近で強い強気シグナルを示していません。
弱気シナリオ — 私が有力と考える見方
XAU/USDが4,300~4,400を下回って推移するなら、チャートは下落継続を示唆しています。
想定される値動きは次のとおりです。
4,170 → 4,000 → 3,800 → 3,600
3,800付近は、チャート上で最初にはっきり示されているサポートであるため、特に重要です。価格がこの水準に達し、日足で強い反転を示せば、調整的な反発は十分にあり得ます。
日足終値で3,800を明確に下抜けた場合、次の大きな目標は3,600になります。
強気シナリオ
価格が反発したというだけで、下抜けが完全に否定されたとは考えません。
強気派にとって確認したいのは、次の動きです。
4,300を回復 → 4,400を日足終値で上抜け → 4,400をサポートとして維持するリテストに成功。
4,400を上回る動きが続けば、三角持ち合い下抜けの見方は大きく後退し、ダマシの下抜けだった可能性が示されます。
{future}(XAUUSDT)
$XAU 現在の構造
現在価格:約4,169
主な心理的抵抗帯:4,400
三角持ち合いのサポート/トレンドラインを下抜けました。
直近のスイング構造では高値が切り下がっており、一方で、より大きな三角持ち合いの中では価格が収束していました。
一目均衡表も、現在価格付近で強い強気シグナルを示していません。
弱気シナリオ — 私が有力と考える見方
XAU/USDが4,300~4,400を下回って推移するなら、チャートは下落継続を示唆しています。
想定される値動きは次のとおりです。
4,170 → 4,000 → 3,800 → 3,600
3,800付近は、チャート上で最初にはっきり示されているサポートであるため、特に重要です。価格がこの水準に達し、日足で強い反転を示せば、調整的な反発は十分にあり得ます。
日足終値で3,800を明確に下抜けた場合、次の大きな目標は3,600になります。
強気シナリオ
価格が反発したというだけで、下抜けが完全に否定されたとは考えません。
強気派にとって確認したいのは、次の動きです。
4,300を回復 → 4,400を日足終値で上抜け → 4,400をサポートとして維持するリテストに成功。
4,400を上回る動きが続けば、三角持ち合い下抜けの見方は大きく後退し、ダマシの下抜けだった可能性が示されます。

296
私についてきて 🧧🧧🧧
私についてきて 🧧🧧🧧

龙虾量化带单
·
--
ブリッシュ私をフォローしてボーナスを受け取ってください。さらに、リポストした方の中から3名を選び、各5ドルをお送りします。
私をフォローしてボーナスを受け取ってください。リポストした方から3名がそれぞれ5ドルを獲得します。
私をフォローしてボーナスを受け取ってください。リポストした方から3名がそれぞれ5ドルを獲得します。

6
ログインして、さらにコンテンツを読む
厳選トピックで世界の暗号資産トレーダーの仲間入り
⚡️ 暗号資産に関する最新かつ有益な情報が見つかります。
💬 世界最大の暗号資産取引所から信頼されています。
👍 認証を受けたクリエイターから、有益なインサイトを得られます。
メール / 電話番号